Abstract
Quantitative computed tomography-based finite element models of proximal femora must be validated with cadaveric experiments before using them to assess fracture risk in osteoporotic patients. During validation it is essential to carefully assess whether the boundary condition modeling matches the experimental conditions. This study evaluated proximal femur stiffness results predicted by six different boundary condition methods on a sample of 30 cadaveric femora and compared the predictions with experimental data. The average stiffness varied by 280% among the six boundary conditions. Compared with experimental data the predictions ranged from overestimating the average stiffness by 65% to underestimating it by 41%. In addition we found that the boundary condition that distributed the load to the contact surfaces similar to the expected contact mechanics predictions had the best agreement with experimental stiffness. We concluded that boundary conditions modeling introduced large variations in proximal femora stiffness predictions.
Keywords: hip fracture, osteoporosis, quantitative computed tomography
1. Introduction
Quantitative computed tomography (QCT) based finite element analysis (FEA) is a tool that has been developed in the last two decades to help assess the proximal femur stiffness and strength and to predict fracture risk in patients (Keyak, Rossi et al. 1998). To assess the accuracy of the method, femoral stiffness and ultimate load measured from controlled fracture tests of cadaveric femora have been compared with QCT/FEA models constructed from scans of the same femora (Keyak, Rossi et al. 1998; Dragomir-Daescu, Den Buijs et al. 2011). While correlation obtained by regression of test and model stiffness data has been quite good (>75%), the absolute prediction of stiffness has been reported to differ from experiments by over100% (Dragomir-Daescu, Den Buijs et al. 2011). In situ bone material properties have been studied as a potential source of this discrepancy (Cong, Den Buijs et al. 2011). By fitting coefficients of a power and sigmoid material law, the differences between the model and tests were minimized and the differences between modeling and test stiffness were reduced. However, in such a process all other sources of error in the model must be understood otherwise bias could be introduced into the optimized material law. Because there are no studies specific to the effect of different types of boundary conditions (BC) modeling on femoral stiffness predictions, we hypothesized that a potential way to improve modeling accuracy and predict results closer to experimental values was to carefully consider the implementation of BC relative to the test conditions (Figure 1).
Figure 1.
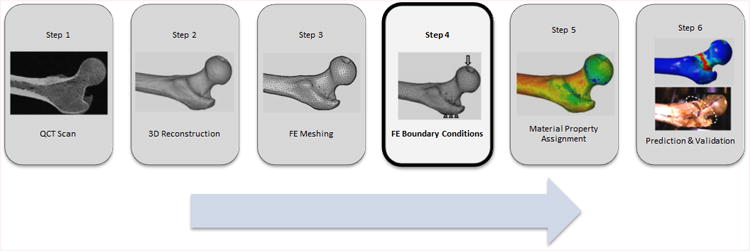
QCT/FEA process flow chart.
In experimental fracture testing of proximal femora, contact interfaces exist between the test fixtures and the femoral head and greater trochanter of the femora for applying impact loads similar to physiological loading (figure 2, Dragomir-Daescu, Den Buijs et al. 2011) while the distal end of the femur is allowed to freely rotate about an axis representing the location of the knee joint. A study of the literature revealed that most researchers have predominantly used distributed nodal forces across a group of nodes on the femoral head contact surface and direct nodal displacement constraints on the opposing surface for application of this impact loading (Keyak, Rossi et al. 1998; Verhulp, van Rietbergen et al. 2008; Dragomir-Daescu, Den Buijs et al. 2011; Op Den Buijs and Dragomir-Daescu 2011). The distributed force thus approximates the distribution of forces transferred from the test fixture to the bone. However, the direct displacement constraints typically employed on the greater trochanter contact surface implicitly constrained the rotation about the axes transverse to the load which may not be realistic and could lead to overestimations of femoral stiffness. When using this method, QCT/FEA estimates of stiffness were found to be up to twice as stiff as experimental data indicated (Dragomir-Daescu, Den Buijs et al. 2011). Researchers modeling a stance-like loading of the femur faced similar dilemmas when modeling experimental loading and also used direct nodal conditions (Cody, Gross et al. 1999; Keyak 2001; Trabelsi and Yosibash 2011; Francis 2012; Mirzaei 2012) with two reporting their FEA models over-predicted the stiffness measured in their tests (Keyak 2001; Mirzaei 2012).
Figure 2.
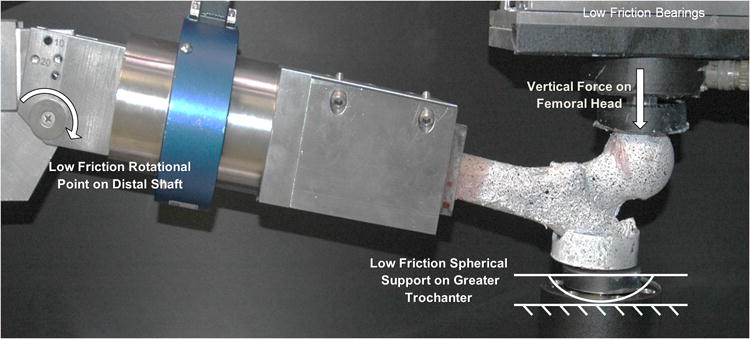
Experimental boundary conditions.
To overcome this limitation for the stance loading condition Tanck et al. (2009) applied the load to the model through a remote node connected by spring elements to the femoral head while the distal shaft was supported in a similar fashion through spring elements to a remote node constrained to resist the load (Tanck, van Aken et al. 2009). Thus application of loads to the femoral nodes through springs connected to a pilot node with prescribed displacement maintained the model's rotational freedom similar to the test setup while distributing the load over the predicted contact surface. However, one drawback of this constraint type is that the spring stiffness assignment may not accurately represent the stiffness of the test fixture, thus raising questions about the likelihood of the contact reaction forces to be similar to the ones predicted by contact mechanics.
Other BC models (Orwoll, Marshall et al. 2009; Koivumaki, Thevenot et al. 2012; Dall'Ara, Luisier et al. 2013) applied the loads through shear-free deformable bodies attached to the femoral head and the greater trochanter to represent the actual test fixtures typically used in fall on the hip testing. These methods benefit from modeling the actual compliance of the material engaged with the femur and from applying the constraints away from the femur surfaces thus better satisfying Saint-Venant's principle (Budynas 1999). A weakness of this method is the assumption of perfect bonding between the femur and the deformable contact material, a condition which cannot be satisfied during the entire femur deformation experiment.
Therefore, with a wide range of methods available in the literature, the current work aimed to evaluate the range of stiffness obtained from six different methods used to model experimental contact and compare their estimates with experimental stiffness results obtained from a large femoral sample population. Additionally, the reaction force distributions at the contact area for each BC loading method were compared with results obtained from contact mechanics theory.
2. Materials & Methods
2.1 Femur Testing
Thirty fresh-frozen cadaveric femora were processed and mechanically tested in a fall on the hip configuration as shown in Fig. 2 (Dragomir-Daescu, Den Buijs et al. 2011). Dual X-ray absorptiometry at the femoral neck was used to classify the femora into three categories based on areal bone mineral density (aBMD) resulting in equal groupings of ten osteoporotic (T-score <= -2.5), tenosteopenic (T-score, -1 to -2.4), and ten normal (T-score >= -1) femora (Table 1). All femora were loaded to fracture under displacement control using a Mini Bionix (MTS Systems Corporation, Eden Prairie, MN) mechanical tester. Force was measured at each femur support location (distal shaft, head, and greater trochanter) and synchronized with displacement data measured at the femoral head rigid fixture that contacted the bone to mitigate potentially erroneous measurements due to load chain compliance. This data was used to compute stiffness for each femur from the linear portion of the head load-displacement curve.
Table 1. Characteristics of the tested femora.
| Attribute | Data |
|---|---|
| Sample Size | 30 (16 Female, 14 Male) |
| Age (mean +/- std, range) | 66 ± 14, [34-91] |
| Side (left/right) | 17 Left, 13 Right |
| Neck aBMD (g cm-2) | 0.82 ± 0.22, [0.47-1.42] |
| Total aBMD (g cm-2) | 0.89 ± 0.22, [0.49-1.34] |
| Condition (neck aBMD) | 10 each: Osteoporotic, Osteopenic, Normal |
2.2 Test BC Description
The femoral head bone material was in contact with a spherical surface machined into an aluminum cup through which an applied force acted vertically (Fig. 2). The greater trochanter surface was potted with PMMA into an aluminum cup with a curved bottom which rested at a single point on the test fixture's rigid fixed surface. The measured frictional forces developed in the test apparatus were negligible at just 2% of the direct applied forces. The distal end of the femur was constrained by the fixture in three translational and two rotational axes and allowed to rotate about a third axis mimicking knee rotation.
2.3 QCT/FEA Process Overview
Prior to testing, QCT scans (Fig 1, Step 1) of the femora were taken with a QCT calibration phantom (Mindways Inc., Austin, TX, USA) in the field of view to allow conversion of Hounsfield units (HU) to equivalent K2HPO4 density which was assumed to be equal to bone ash density (Cong, Den Buijs et al. 2011). The femora were oriented in the scanner using a fixture designed to register the reconstructed bone geometry in a position identical to the bone orientation during testing. The scans were performed in air to obtain the maximum contrast of bone mineral density (BMD) for accurate cortical bone segmentation and thus to minimize the partial volume effects at the surface by avoiding inclusion of voxels outside of the cortical surface. The scan data were used to reconstruct the 3D geometry (Fig. 1, Step 2) using Mimics® (Materialise, Leuven, Belgium) software. Quadratic tetrahedral FE meshes (Fig. 1, Step 3) were created with ANSYS ICEM® (ANSYS, Canonsburg, PA, USA) with discretization size based on a prior published work ((Dragomir-Daescu, Den Buijs et al. 2011) that demonstrated converged results with an maximum element edge length of 1.5mm in the head, neck and trochanter regions, 2.5mm in the subtrochanteric region, and 4.0mm in the rest of the shaft based on one of the boundary conditions described below (Direct 2). In the next step, the loading BC (Fig. 1, Step 4) were applied. Isotropic, linear elastic bone material properties (Fig. 1, Step 5) were assigned to each finite element using a power law relationship between bone ash density (ρash, g/cm̂3) and elastic modulus (E, MPa): (Morgan, Bayraktar et al. 2003; Dragomir-Daescu, Den Buijs et al. 2011). Finally, the resulting QCT/FEA models were solved to estimate cadaveric femoral stiffness (Fig. 1, Step 6) and the predicted results were compared with the experimental results.
2.4 FEA BC Considered
Six approximations of the experimental BC were modeled as shown in Fig. 3. The distal femur boundary condition was kept the same for all femora and was modeled by a bundle of very stiff beam elements connecting a large number of mesh nodes in contact with the fixture, at the distal end of the femoral shaft, to a pilot node (not shown in Fig. 1). The model was allowed to rotate about the horizontal X-axis mimicking the experimental condition. Five of the proximal femur BC were displacement-controlled : Direct 1, distributed stiff springs (DSS), multipoint constraints (MPC), Contact 1, and Contact 2, while Direct 2 was load-controlled. Displacement controlled BC tend to improve convergence of the non-linear contact conditions and they also better mimic our displacement controlled experiments. A literature survey showed that the load controlled BC (Direct 2) was the method adopted by most researchers.
Figure 3.
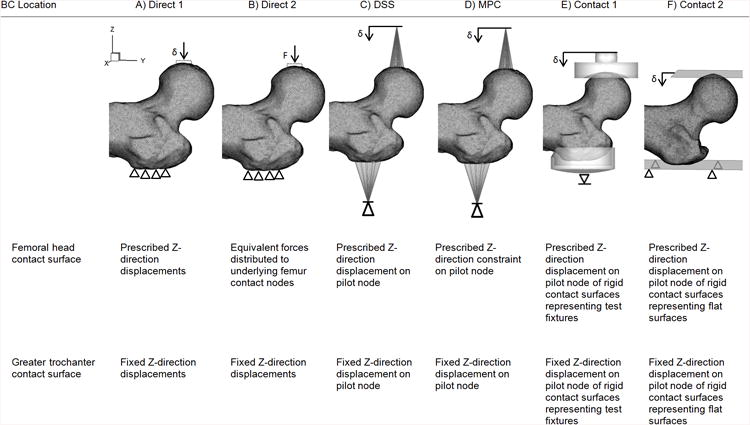
FEA BC models. Note: The fixture representations for Contact 1 and 2 are transparent and do not penetrate the bone.
The six proximal-femur BC were applied on the same set of surface nodes for each model. A node group at the femoral head was defined to include all nodes that were likely to be in contact with the fixture. A second node group was defined at the trochanter which included the portion of the femur surface that was in contact with PMMA during testing. Each selection was evaluated using Direct 2 to ensure the stiffness results were relatively insensitive to perturbation of the number of nodes in the anticipated contact area and typically included 250 to 300 nodes at each location.
The two direct nodal BC, Direct 1 and Direct 2 (Fig. 3A, B),constrained all three translational degrees of freedom (DOF) at the trochanter. For Direct 1, the head node group moved in the Z-axis and for Direct 2, equal Z-axis forces were applied to the head nodes that summed up to the equivalent applied load.
The DSS and MPC BC (Fig. 3C-D) applied loads to the head and trochanter node groups through either springs or analytical constraints from two remote pilot nodes which were displacement constrained only in the Z-axis. The DSS BC connected the pilot node to each node group through springs with a stiffness of 1000 N/mm each (Fig. 3C) providing a composite stiffness mimicking the fixture thus, much stiffer than the bone. In contrast, the MPC BC in Fig. 3D utilized mathematically defined multipoint constraints in ANSYS® (ANSYS APDL, ANSYS, Canonsburg, PA) to connect the pilot node to the femur contact nodes using force-distribution constraint equations that relate the motion of the pilot node to the femur nodes taking into account the shape functions of the underlying finite elements (2011). This bypassed the need for weight factors to be assigned in more traditional force -distributed constraint FE methods (i.e., more commonly known as RBE3 implementations).
The two contact BC (Fig. 3E-F) simulate full non-linear contact between the femur and contact surfaces representing the test fixtures. Contact 1 (Fig. 3E) modeled contact between the femoral head and a rigid concave surface of the test fixture using a vertical displacement applied through a pilot node to help distribute the contact forces. The trochanter was supported by an impression of the trochanter surface onto a rigid surface and connected to a pilot node fixed in the Z direction. In contrast, Contact 2 (Fig. 3 F) substituted flat rigid surfaces in place of the actual test fixture geometry at the femoral head and trochanter support surface. Both of these methods permit a nearly shear-free state for both Contact 1 and Contact 2 by allowing the pilot node to easily move in the transverse directions X and Y. A pure shear-free state was not numerically possible as soft springs with a small stiffness of 1 N/mm oriented in the horizontal X- and Y-axes were required at the pilot nodes to reach convergence for all simulations. It should be noted that a third contact configuration similar to Contact 1 but with deformable test fixture models, which could eventually model the aluminum cup and the PMMA was attempted, however, satisfactory convergence for static equilibrium was not obtained for a sufficient number of femora, and the results were not incorporated into this study.
2.5 Solving the Models
The solution settings for all model simulations included large deflection. The displacement controlled BC was applied in 0.1mm steps while the load controlled BC was applied in increments of 100N. Contact in ANSYS® used the Augmented Lagrangian method and was solved using the PCG iterative solver with a tolerance of 1E-6 (ANSYS® 14.0, ANSYS, Canonsburg, PA) driven by the ANSYS Parametric Design Language (APDL) protocol using a TCL/TK in-house script which ensured all FE models were built and run similarly to eliminate user error. Models were run on a 240 core HPC cluster and the TCL script calculated reaction forces for each run when completed. Each completed result was inspected to check reaction force distributions at the head and trochanter contact areas. The equivalent displacement at the femoral head was computed as the average displacement of the femoral head node group. In the cases of displacement controlled BCs (MPC, DSS, Contact 1, and Contact 2, the pilot node displacement was verified to be within 0.1% of the average of the femoral head node group displacement and used for calculations. The reaction force was taken as the sum of the individual reactions for Direct 1, as the opposite of the applied load in Direct 2, and as the reaction force on the head pilot node for MPC, DSS, Contact 1, and Contact 2.
2.6 Analysis of Model Results
The QCT/FEA estimated stiffness was calculated as the slope of the linear portion of the head force-displacement curve and used to compare among the six models and to experimental results. The methods used for comparisons were: summary statistics (mean and standard deviation), the concordance correlation assessment, the Spearman rank-order correlation assessment, and a paired t-test. Summary statistics were used to compare the stiffness mean values obtained for the thirty femora sample for each of the six boundary condition types to the experimental mean stiffness and were computed with JMP® statistical analysis software (SAS Institute Inc., Cary, North Carolina). The concordance correlation coefficient (CCC)ρ,c, was used to assess pairwise the degree of similarity between the BC predictions and the experimental results because of its suitability for evaluating the agreement between two measurements on the same sample, a method proposed by Lin (Lin 1989) and was computed with Matlab® (MathWorks, Natick, Massachusetts, USA). The Spearman rank correlation coefficient (Keller 1999) was computed with JMP and used to compare the rank order of stiffness from smallest to largest and chosen for its ability to distinguish stronger correlations in the presence of large systematic error, such as potential error in the material elastic modulus assignment assumption. Finally, the paired t-test performed in JMP compares the means of the differences between BC predictions and experimental results with zero (Walker and Shostak 2010).
The reaction force distributions were plotted for each femur and examined for their agreement with traditional contact mechanics results. Tecplot® (Tecplot, Inc., Bellevue, WA) was used to plot the minimum principal stress on the femoral surface of the contact areas and overlay the nodal reaction forces for each BC loading approach.
3. Results
The experimental total force measured at the femoral head as a function of displacement is plotted in Fig. 4A along with the load estimates from the six BC for a representative femur. The linear part of these responses is used to calculate and compare stiffness. For this femur, the calculated stiffness varied widely between 1050 N/mm for Contact 2 to 2735 N/mm for Direct 1.
Figure 4.
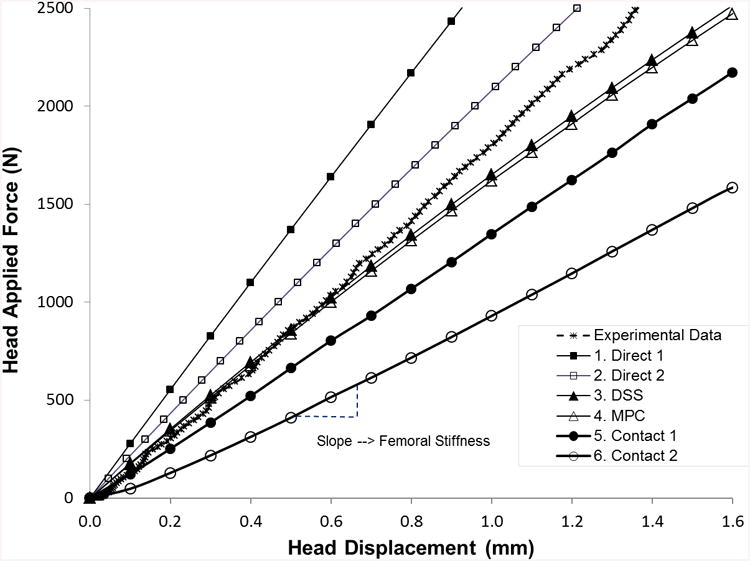
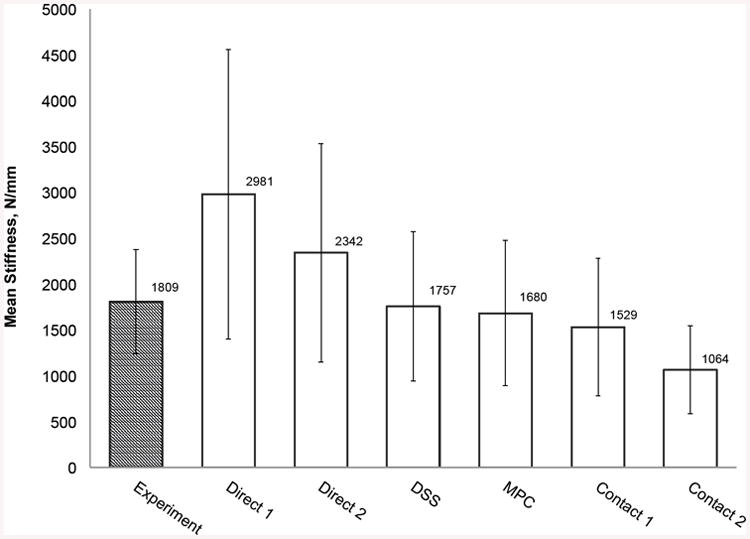
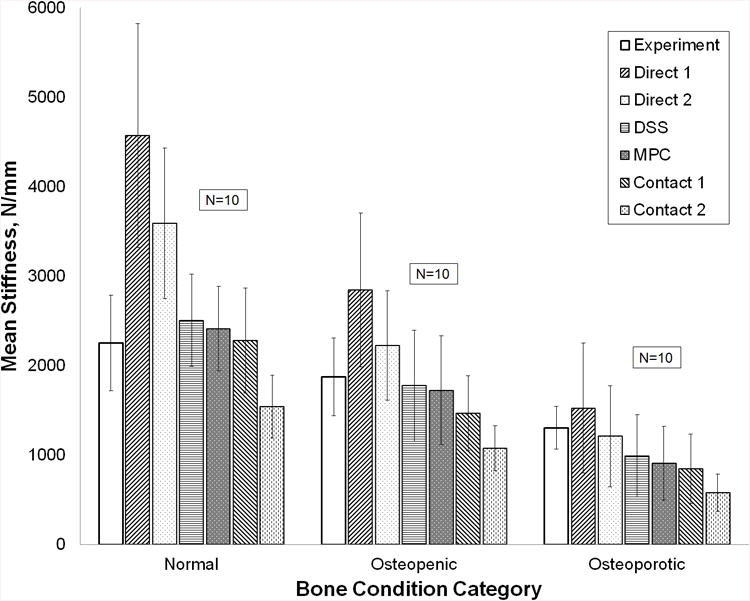
(a) Force-displacement experimental force and FEA calculated response curves for all six boundary condition models of a representative femur. (b) Summary statistics for experimentally measured stiffness and QCT/FEA predictions of stiffness for all six boundary condition models (N=30 femora). (c) Mean stiffness and standard deviation for each bone condition category (N=10 in each category).
For the entire sample of 30 femora, Fig. 4B shows the mean and standard deviation of the experimental stiffness compared with the mean and standard deviation of the QCT/FEA estimated stiffness for each of the six BC loading cases. Direct 1 using direct displacement constraints on the femur head and trochanter nodes predicted the largest stiffness (μ=2981 N/mm, σ=1579 N/mm), while the contact BC using flat rigid surfaces (Contact 2) predicted the lowest value (μ=1064 N/mm, σ=481 N/mm). When contrasting with experimental results, Direct 1 predicted 65% larger mean stiffness while Contact 2 predicted 41% smaller mean stiffness. The DSS and MPC BC most closely matched the experimental average with 3% and 7% smaller predicted values, respectively.
Figure 4C shows stiffness results for each of the three bone condition categories. Experimentally, normal femora are on average stiffer than osteopenic femora which are stiffer than osteoporotic femora, a trend that holds for the QCT/FEA estimated stiffness (p = 0.0001 for the experiment stiffness and p < 0.0001 for each QCT/FEA model when testing bone condition category as the explanatory variable). Similar to the results obtained for the entire sample, the Direct 1 BC estimated the largest stiffness in each bone category, while the Contact 2 BC estimated the smallest (Fig. 5C).
Figure 5.
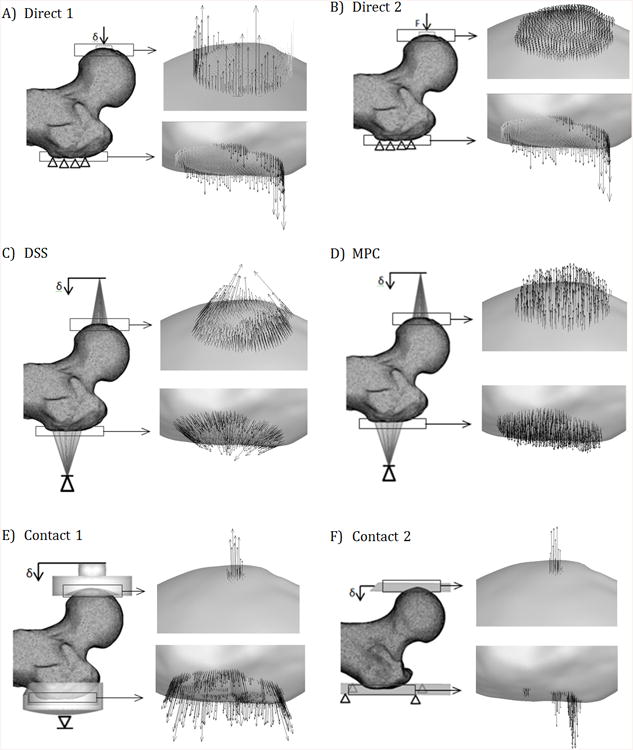
Typical QCT/FEA reaction force distributions at a femoral head displacement of 1 mm. Black arrows represent compressive forces acting toward the test fixture; grey arrows (only present in a and b) represent unphysical tensile forces acting away from fixtures.
The CCC, Spearman correlation coefficient, and paired t-test results were calculated and listed in Table 2. When correlating the predictions with experimental data, the DSS, MPC, and Contact 1 BC had the largest values, with CCC varying between 0.739 and 0.754, compared to the commonly used Direct 2 BC, with CCC at only 0.507. The DSS, MPC, and Contact 1 BC also showed the three highest Spearman correlation coefficients for rank order varying between 0.868 and 0.892 (Table 2). The t-test results for both DSS and MPC boundary conditions showed significance for supporting the null hypothesis which assumed that the estimated means were the same as the mean of experimental stiffness (α=0.05, p-values of 0.559 and 0.147, respectively).
Table 2. CCC, Spearman correlation coefficient, and paired t-test results for the six BC models.
| Experimental Stiffness | Predicted Stiffness | ρc | ρspm | Paired t-test |
|---|---|---|---|---|
| Test | Direct 1 | 0.310 | 0.800 | <0.0001 |
| Test | Direct 2 | 0.507 | 0.832 | <0.0001 |
| Test | DSS | 0.754 | 0.870 | 0.559 |
| Test | MPC | 0.752 | 0.868 | 0.147 |
| Test | Contact 1 | 0.739 | 0.892 | 0.0009 |
| Test | Contact 2 | 0.389 | 0.856 | <0.0001 |
The distributions of reaction forces that developed at the contact areas were vastly different among the six models (Fig. 5). DSS, MPC, Contact 1, and Contact 2 showed reaction force distributions that act in the anticipated direction of test fixture contact (black outward pointing vectors) while Direct 1 and Direct 2 showed an unphysical reversal of reaction force direction (grey inward pointing vectors) for a significant number of contact points on the trochanter and for Direct 1, also in the contact area of the head.
4. Discussion and Conclusions
From these results, it is clear that the BC modeling approach for loading can significantly alter the QCT/FEA model's stiffness estimate. The ratio of predicted mean stiffness extremes from the six BC approaches was very large at 2.8:1 and occurred when comparing Direct 1 (2981 N/mm) to Contact 2 (1064 N/mm). The fact that a simple choice of a possible and reasonable BC method, selected by the analyst, leads to significant inconsistencies in stiffness predictions highlights the importance of assessing the suitability of FEA boundary conditions carefully.
As found in the literature, two of the most used approaches, Direct 1 and Direct 2, led to the highest average stiffness results of 2981 N/mm and 2342 N/mm, respectively, which were considerably higher than the average experimental stiffness of 1809 N/mm. This finding is consistent with the over-predictions of stiffness reported by other researchers using similar BC (Keyak 2001; Dragomir-Daescu, Den Buijs et al. 2011; Mirzaei 2012). We observed these BC incorrectly model all the trochanter nodes in contact with the fixture as having zero Z-axis displacement during loading, with no rotation of this node group allowed, a condition that over constrains the trochanter and was also confirmed by the wrongly predicted inward nodal reaction forces at the greater trochanter (Fig. 5B). In our experiment, the greater trochanter was potted in PMMA and was geometrically locked for compression within the cup, while the cup was however allowed to roll on a fixed surface during bone deformation. It is known that PMMA does not bond to bone making thus impossible for the development of any tensile reaction forces as predicted by the two direct boundary conditions modeling.
We expect that the DSS, MPC, and Contact1 approaches - providing the best agreement among themselves, the largest CCC coefficients, and the best agreement with the experimental stiffness - could be used to further improve the QCT/FEA predictions for this fall on the hip loading case. Among these three types, the MPC BC led to contact force distributions that are more similar to the Hertzian contact mechanics distribution where the contact pressure decays from the axis of load application and has an elliptically-varying magnitude (Hertz 1881). In contrast, the DSS and Contact 1 BC have singularities and non-physical reaction forces at the boundary of both the head and trochanter contact node groups (Fig. 5C and 5E), a distribution not supported by classical contact theory which, instead, is more similar to the behavior of the analytical solution of a rigid cylindrical die in contact with a semi-infinite plate (Young 1989). In this analytical solution, the contact stresses approach infinity at the outer radius of the die. It is therefore likely that the distribution of contact stiffness of these BC is estimated to be too high near the periphery leading to such large predictions of contact forces.
A limitation of the two contact boundary condition types studied here was to not include the compliance of the PMMA, used to distribute the contact force at the trochanter during testing, or the compliance of our fixture – albeit very stiff compared to bone stiffness. We attempted to explicitly model these deformable components with their associated contact pairs on a subset of five femora but encountered significant difficulties as static equilibrium convergence required extremely small loading increments that led to model runtimes being extended from several hours, for the six BC cases include here, to weeks, when contact surface compliance was modeled explicitly. Our future work in this area will focus on finding, if possible, efficient solutions for non-rigid contact modeling, including the PMMA, to try to improve the accuracy of the calculated contact forces. However, linear approximation alternatives such as DSS or MPC must be also better assessed, verified, and validated with experiments as they are likely candidates to be used instead of full contact methods because they can more easily lead to predictable, converged results.
The results and conclusions of this study were only verified for the chosen tested configuration which represents a typical load orientation for a fall on the hip and may be different for other test orientations. The methods described in this manuscript should provide a basis for a sensitivity study for other load orientations. In addition, the mesh discretization and contact node group selection in the models was based on sensitivity studies performed only with the Direct 2 BC; different settings might need independent mesh verification for other BC. However, each model's results were carefully evaluated to ensure that the contact forces were distributed over a significant number of nodes and elements to avoid contact force singularities.
Finally, the femoral stiffness in the tested configuration is not a direct measure of fracture strength. However, stiffness has been shown to be well correlated with fracture strength (Cody, Gross et al. 1999; Keyak 2001). Nevertheless, stiffness is a foundational mechanical property for any mechanical analysis of femoral fracture so its accurate estimation is essential, thus it must be insensitive to BC selection.
We concluded that boundary conditions in QCT/FEA modeling of cadaveric femora can significantly affect the predicted femoral stiffness.
Acknowledgments
The authors would like to thank Samad Javid, Pascal Swider, and Iwona Jasiuk for their review and comments. The study was financially supported by NIH grant AR027065Z-30S1 and the Grainger Foundation: Grainger Innovation Fund. The CT imaging of the femora was performed through the Opus CT Imaging Resource of Mayo Clinic (NIH construction grant RR018898). This publication was made possible by CTSA Grant Number UL1 TR000135 from the National Center for Advancing Translational Sciences (NCATS), a component of the National Institutes of Health (NIH). Its contents are solely the responsibility of the authors and do not necessarily represent the official view of NIH.
Footnotes
Conflict of interest statement: None of the authors have conflicts of interest to disclose.
References
- ANSYS. Mechanical APDL Contact Technology Guide. Chapter 9. SAS IP, Inc.; 2011. ANSYS 14.0 Help Module. [Google Scholar]
- Budynas RG. Advanced Strength and Applied Stress Analysis. McGraw-Hill Education; 1999. [Google Scholar]
- Cody DD, Gross GJ, et al. Femoral strength is better predicted by finite element models than QCT and DXA. Journal of Biomechanics. 1999;32(10):1013–1020. doi: 10.1016/s0021-9290(99)00099-8. [DOI] [PubMed] [Google Scholar]
- Cong A, Op Den Buijs J, et al. In situ parameter identification of optimal density-elastic modulus relationships in subject-specific finite element models of the proximal femur. Medical Engineering & Physics. 2011;33(2):164–173. doi: 10.1016/j.medengphy.2010.09.018. [DOI] [PMC free article] [PubMed] [Google Scholar]
- Dall'Ara E, Luisier B, et al. A nonlinear QCT-based finite element model validation study for the human femur tested in two configurations in vitro. Bone. 2013;52(1):27–38. doi: 10.1016/j.bone.2012.09.006. [DOI] [PubMed] [Google Scholar]
- Dragomir-Daescu D, Op Den Buijs J, et al. Robust QCT/FEA Models of Proximal Femur Stiffness and Fracture Load During a Sideways Fall on the Hip. Annals of Biomedical Engineering. 2011;39(2):742–755. doi: 10.1007/s10439-010-0196-y. [DOI] [PMC free article] [PubMed] [Google Scholar]
- Francis A, Kumar V. Computational Modeling of Human Femur using CT Data for Finite Element Analysis. International Journal of Engineering Research & Technology. 2012;1 Issue 6:1–7. [Google Scholar]
- Hertz H. Journal of Mathematics. 1881;92:156–171. [Google Scholar]
- Keller G. Statistics for Management and Economics. Pacific Grove (CA): Brooks/Cole Publishing Company; 1999. pp. 674–675. [Google Scholar]
- Keyak JH. Improved prediction of proximal femoral fracture load using nonlinear finite element models. Medical Engineering & Physics. 2001;23(3):165–173. doi: 10.1016/s1350-4533(01)00045-5. [DOI] [PubMed] [Google Scholar]
- Keyak JH, Rossi SA, et al. Prediction of femoral fracture load using automated finite element modeling. Journal of Biomechanics. 1998;31(2):125–133. doi: 10.1016/s0021-9290(97)00123-1. [DOI] [PubMed] [Google Scholar]
- Koivumaki JEM, Thevenot J, et al. Ct-based finite element models can be used to estimate experimentally measured failure loads in the proximal femur. Bone. 2012;50(4):824–829. doi: 10.1016/j.bone.2012.01.012. [DOI] [PubMed] [Google Scholar]
- Lin LI. A concordance correlation coefficient to evaluate reproducibility. Biometrics. 1989;45(1):255–268. [PubMed] [Google Scholar]
- Mirzaei M, Samiezadeh S, Khodadadi A, Ghazavi MR. Finite Element Prediction and Experimental Verification of the Failure Pattern of Proximal Femur using Quantitative Computed Tomography Images. Engineering and Technology. 2012;66:111–117. [Google Scholar]
- Morgan EF, Bayraktar HH, et al. Trabecular bone modulus-density relationships depend on anatomic site. Journal of Biomechanics. 2003;36(7):897–904. doi: 10.1016/s0021-9290(03)00071-x. [DOI] [PubMed] [Google Scholar]
- Op Den Buijs J, Dragomir-Daescu D. Validated finite element models of the proximal femur using two-dimensional projected geometry and bone density. Computer methods and programs in biomedicine. 2011;104(2):168–174. doi: 10.1016/j.cmpb.2010.11.008. [DOI] [PMC free article] [PubMed] [Google Scholar]
- Orwoll ES, Marshall LM, et al. Finite Element Analysis of the Proximal Femur and Hip Fracture Risk in Older Men. Journal of Bone and Mineral Research. 2009;24(3):475–483. doi: 10.1359/JBMR.081201. [DOI] [PMC free article] [PubMed] [Google Scholar]
- Tanck E, van Aken JB, et al. Pathological fracture prediction in patients with metastatic lesions can be improved with quantitative computed tomography based computer models. Bone. 2009;45(4):777–783. doi: 10.1016/j.bone.2009.06.009. [DOI] [PubMed] [Google Scholar]
- Trabelsi N, Yosibash Z. Patient-Specific Finite-Element Analyses of the Proximal Femur with Orthotropic Material Properties Validated by Experiments. Journal of Biomechanical Engineering-Transactions of the Asme. 2011;133(6):1666–1672. doi: 10.1115/1.4004180. [DOI] [PubMed] [Google Scholar]
- Verhulp E, van Rietbergen B, et al. Load distribution in the healthy and osteoporotic human proximal femur during a fall to the side. Bone. 2008;42(1):30–35. doi: 10.1016/j.bone.2007.08.039. [DOI] [PubMed] [Google Scholar]
- Walker GA, Shostak J. Common statistical methods for clinical research with SAS examples. Cary, NC: SAS Institute Inc; 2010. [Google Scholar]
- Young W. Roark's Formulas for Stress and Strain. Boston (MA): McGraw-Hill Education; 1989. [Google Scholar]


