Abstract
Ultraconserved elements (UCEs) have become popular markers in phylogenetic studies because of their cost effectiveness in phylogenomic analyses and because of their potential to resolve problematic phylogenetic questions such as interspecific relationships within the rayfinned fishes. Although UCE datasets typically contain a much larger number of loci and sites than more traditional datasets of PCR-amplified, single-copy, protein coding genes, a fraction of UCE sites are expected to be part of a nearly invariant core, and the relative performance of UCE datasets versus protein coding gene datasets is poorly understood. Here we use phylogenetic informativeness (PI) to compare the resolving power of multi-locus and UCE datasets in a sample of percomorph fishes with sequenced genomes (genome-enabled). We compare three data sets: UCE core regions, flanking sequence adjacent to the UCE core and a set of ten protein coding genes commonly used in fish systematics. We found the net informativeness of UCE core and flank regions to be roughly ten-fold and 100-fold more informative than that of the protein coding genes. On a per locus basis UCEs and protein coding genes exhibited similar levels of phylogenetic informativeness. Our results suggest that UCEs offer enormous potential for resolving relationships across the percomorph tree of life.
Keywords: Ultraconserved elements, Next-generation sequencing, Non-coding DNA, Phylogenomics, Molecular Evolution, Phylogenetic informativeness
Graphical Abstract
1 Introduction
Ultraconserved elements (UCEs) have become increasingly popular in recent phylogenomic studies. They have been used to reconstruct phylogenies for clades as divergent as the mammals, fish, birds, turtles, and arthropods (Bejerano et al., 2004; Faircloth et al., 2014; Faircloth et al., 2013; McCormack et al., 2013; Smith et al., 2014; Sun et al., 2014). The utility of UCEs for sequence-capture approaches has been well justified on practical grounds. They are shared loci found among most, if not all vertebrate genomes (Bejerano et al., 2004; Siepel et al., 2005) and researchers can easily detect and align UCEs from divergent taxonomic groups (Miller et al., 2007). UCEs do not intersect paralogous genes (Derti et al., 2006) or have retroelement insertions (Simons et al., 2006). Stephen et al. (2008) found that most eutherian UCEs were intergenic with only 3% falling within protein coding exons and suggested splicing regulation as one of their functions. One of the most compelling phylogenetic characteristics of UCEs is that the flanking regions increase in variant sites as the distance from the UCE center increases, allowing for better resolution of nodes across a range of evolutionary timescales in a given phylogeny (Faircloth et al., 2012b). This aspect potentially allows phylogeneticists to tailor their use of UCEs by choosing those with similar evolutionary rates or selecting a subsample of UCE regions whose flanking regions optimize their analyses. However, the relative performance of UCEs compared to traditional molecular markers remains poorly understood.
Traditional markers might be expected to exhibit better phylogenetic performance than UCEs because traditional markers have been highly selected for their potential ability to resolve polytomies and they have been well curated and validated. Sets of traditional markers that yield reasonable phylogenetic results have been identified for many major sections of the tree of life. In fishes for example, Li et al. (2007) identified a cohort of 10 genes from a pool of 154 that have become widely used at various phylogenetic scales (Betancur et al., 2013; Li et al., 2009; Li et al., 2008; Near et al., 2012; Wainwright et al., 2012). These protein coding genes were carefully selected and validated for the purpose of reconstructing the ray-finned fish phylogeny (Li et al., 2007). In contrast, UCEs are identified by the presence of nearly invariant core regions. UCE cores are thus expected to have very low to no phylogenetic resolving power. The flanking regions of UCE are, by definition, not invariant and should thus provide more resolving power than the core. However individual UCE loci have not generally been subjected to the same degree of scrutiny as the phylogenetic workhorse, PCR-amplified, single copy protein coding genes, and thus, on average, might be expected to perform more poorly at resolving phylogenetic problems. One resolution of this paradox would be that the greater degree of resolution obtained in recent UCE studies (Crawford et al., 2012; McCormack et al., 2012) is largely due to the sheer number of sites that are captured through high-throughput sequencing methods, as on a per locus basis the ability of UCEs to resolve polytomies is thought to be relatively poor.
UCE cores are highly conserved throughout the genome, which suggests there may be little phylogenetic informativeness in these regions. More specifically, we ask the question, what is the impact of UCE core conservation on overall phylogenetic informativeness and on the UCEs’ ability to resolve hypothetical polytomies?
To better understand the utility of UCEs in a phylogenetic context, we characterize their phylogenetic informativeness (Townsend, 2007) by analyzing a dataset comprised of 1201 UCEs and 10 protein coding genes collected from eight species of percomorphs with fully sequenced genomes (genome-enabled), Gasterosteus aculeatus, Oryzias latipes, Takifugu rubripes, Tetraodon nigroviridis, Oreochromis niloticus, Neolamprologus brichardi, Pundamila nyererei and Haplochromis burtoni. We chose to examine the percomorphs because recent studies have demonstrated that this large clade has undergone recent radiations and many relationships remain unresolved, which heavily impact age estimations in the clade (Betancur et al., 2013; Broughton R. E. et al., 2013; Smith et al., 2007; Wainwright et al., 2012). Li et al. (2007) demonstrated that a carefully chosen set of 10 protein coding genes can successfully resolve many groups within the percomorphs. Faircloth et al. (2012b) demonstrated that UCEs successfully resolve older lineage relationships in the euteleost tree of life but they did not specifically focus on resolving polytomies within sub-clades of the percomorphs, for example the order Perciformes, and it is yet untested whether more recent radiations within the Euteleosts can be resolved using UCEs.
We chose phylogenetic informativeness (PI) to make our comparison. PI estimates the probability that a character resolves a hypothetical polytomy in a four-taxon phylogeny and then remains unchanged along the peripheral branches (Townsend, 2007). PI is a function of the rate of evolutionary change and the time to most recent common ancestor among the taxa under analysis, and it provides one estimate of the amount of phylogenetic signal relative to noise across a specified time period. Marker sets for more than four taxa can be compared using PI if a consistent topology is used across the markers. Calculation of the PI per nucleotide allows estimation of the cost-effectiveness of character sampling. Thus our study seeks to address which dataset, the UCEs or the protein coding genes, has the greatest PI so that researchers interested in clades within the percomorphs can focus on the appropriate data to best resolve the remaining polytomies.
2 Materials and Methods
2.1 UCE Core Region Design Pipeline
We identified 1201 UCEs found in the eight percomorphs whose genomes were available at the start of our study, one three-spined stickleback, G. aculeatus, one medaka, O. latipes, two puffers, T. rubripes, T. nigroviridis, and four cichlids, O. niloticus, N. brichardi, P. nyererei and H. burtoni. Following Faircloth et al. (2013), we: (1) located nuclear DNA regions of 180 +/− 10 base pairs (bp) where there were at least 80 contiguous bp with 100% conservation and the remainder with >80% conservation between G. aculeatus and O. latipes; (2) aligned these sequences to the genomes of the remaining six fishes (T. rubripes, T. nigroviridis, O. niloticus, N. brichardi, P. nyererei and H. burtoni) using LASTZ (Harris, 2007); and (3) required >80% sequence identity across all eight species. We defined the core as the contiguous region of the aligned sequence, which corresponds to the original 180 bp from G. aculeatus and O. latipes, and flank as all the remaining sequence 5′ or 3′ of the core. To ensure that PI is accurately calculated, we limited our analysis to UCEs with at least 50 bp flanking the 5′ or 3′ end of the core. This reduced the final count used for all further analysis to 988 UCE loci with cores of aligned lengths of 171 bp to 219 bp and flanks of aligned lengths of 144 bp to 1626 bp.
2.2 Protein Coding Genes
We compared the UCEs recovered in this study to ten protein coding genes identified by Li and colleagues (2007) (see Supplemental Table 1). We downloaded individual gene data for each of these loci across the eight genome-enabled percomorph species from the ENSEMBL Genome Browser (Hubbard et al., 2007), the UCSC genome browser (Kent et al., 2002), and NCBI GenBank (Benson et al., 2005). We translated the nucleotide sequences of the ten loci into amino acid sequences using TranslatorX (Abascal et al., 2010) and aligned amino acids using MUSCLE (Edgar, 2004). We used the DNA version of these alignments when calculating PI.
2.3 In silico Phylogeny Design for the PI guide tree
We constructed a time-calibrated phylogenetic framework needed for calculation of PI using divergence times from recently published phylogenetic studies to date node splits for the eight taxon tree of genome-enabled percomorph fishes (Betancur et al., 2013; Broughton R. E. et al., 2013; Santini et al., 2009; Wainwright et al., 2012). We provide the time-calibrated phylogeny for the eight genome-enabled species used in this study (Supplemental Figure 1).
2.4 PI Calculations
We used the software package TAPIR (http://faircloth-lab.github.com/tapir/) to measure the PI of the UCE core regions, the flanking regions of the UCE cores and the set of ten protein coding genes. TAPIR employs a similar pipeline for estimating PI to that used in PhyDesign (Lopez-Giraldez and Townsend, 2011) although the PI computation is parallelized to work across large genomic datasets (Faircloth et al., 2012a; Pond et al., 2005). TAPIR calculates substitution rates from sequence alignment files and then uses these substitution rates to estimate the PI profile of each locus. We calculated net PI for each dataset, PI per locus per dataset, and PI per nucleotide per locus per dataset. The net PI is the sum of the individual PI’s for each nucleotide across all loci in a dataset. Thus, net PI is additive and the length of each dataset contributes to its respective net PI curve. When displaying or analyzing the time of maximum PI, we removed seven UCEs whose cores were invariant across all taxa and thus had PI = 0 across the entire time-calibrated phylogeny.
2.5 Statistical Analysis
We conducted statistical analyses using the R package (http://www.r-project.org/) and TAPIR (http://faircloth-lab.github.com/tapir/). We calculated the distribution of the average per nucleotide PI, the maximum nucleotide PI, and the time in millions of years (Ma) of maximum PI using plyr, gtools, and xtable libraries in R and ggplot2 (Harrell Jr., 2014; Team, 2014; Warnes, 2014; Wickham, 2009, 2011). We performed regression analyses using the lm function of R.
2.6 Verification of the Percomorph Phylogeny
To verify that both the UCE dataset and the protein coding gene dataset produced the expected phylogeny (Dornburg et al., 2014; Faircloth et al., 2013; Near et al., 2013; Wainwright et al., 2012)) we reconstructed the phylogeny for the eight genome-enabled species. We prepared our data for phylogenetic reconstruction using phyluce (https://github.com/fairclothlab/phyluce). To estimate the best fitting locus-specific site rate substitution models we used Cloudforest (Crawford and Faircloth, 2014) and partitioned the UCEs by their best-fitting substitution models. Bayesian methods were used for phylogenetic inference as implemented in MrBayes 3.1(Huelsenbeck, 2001; Ronquist and Huelsenbeck; Ronquist et al.) thus over 5,000,000 iterations we sampled trees every 500 iterations to yield 10,000 trees. Convergence was confirmed by checking Effective Sampling Size values >200 in TRACER (Rambaut et al., 2014).
3 Results
3.1 Net Phylogenetic Informativeness of Each Dataset
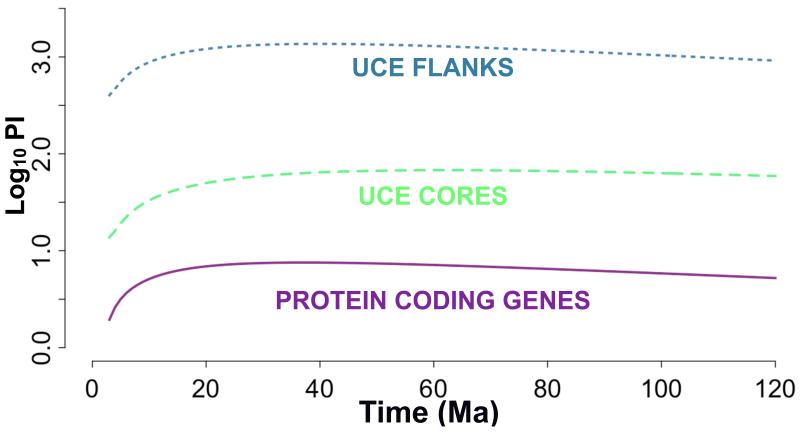
The UCE flanking regions outperformed the UCE core regions, which outperformed the protein coding genes, for estimates of net PI across all times scales (presented as the log10 of PI versus time in Ma in Figure 1). PI for the UCE flanks rose rapidly, reached a maximum at 43 Ma and then slowly tapered off. We observed similar behavior for the PI of the UCE cores and the PI of the protein coding genes (Figure 1).
Figure 1.
The log10 of net phylogenetic informativeness plotted against time for each data type. The blue dashed line shows UCE flanking regions, the green line shows the UCE core, and the purple line shows the protein coding genes chosen from Li et al. (2007).
3.2 PI per Locus in Each Data Set
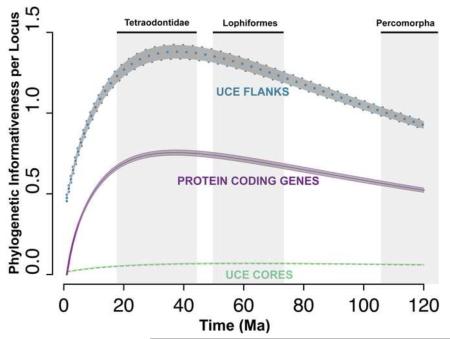
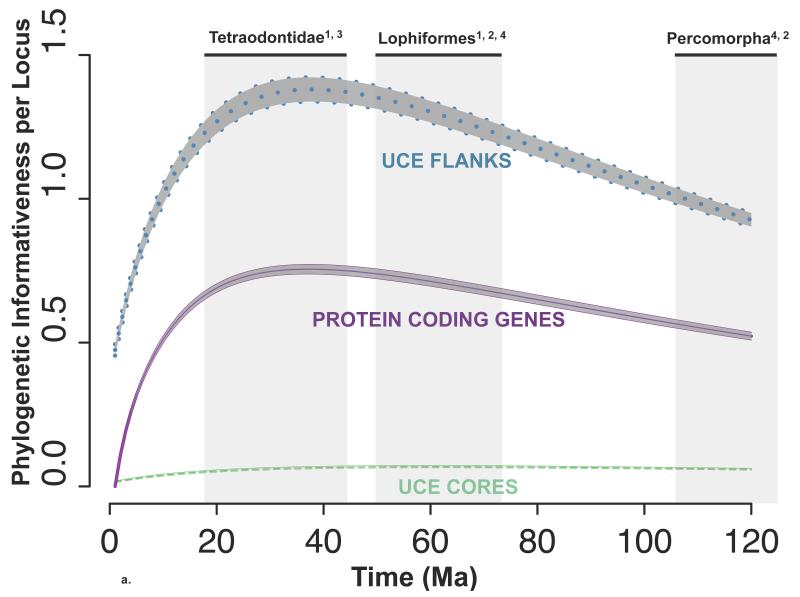
The average and 95% confidence interval (CI) for the per locus PI of the UCE flanking regions, the UCE core regions, and the ten protein coding genes are shown versus time in Ma (Figure 2a). UCE flanking regions had the highest PI per locus, surpassing both the UCE core regions and protein coding genes. The UCE core had the lowest per locus PI, reflecting that region’s relative invariance.
Figure 2a-b.
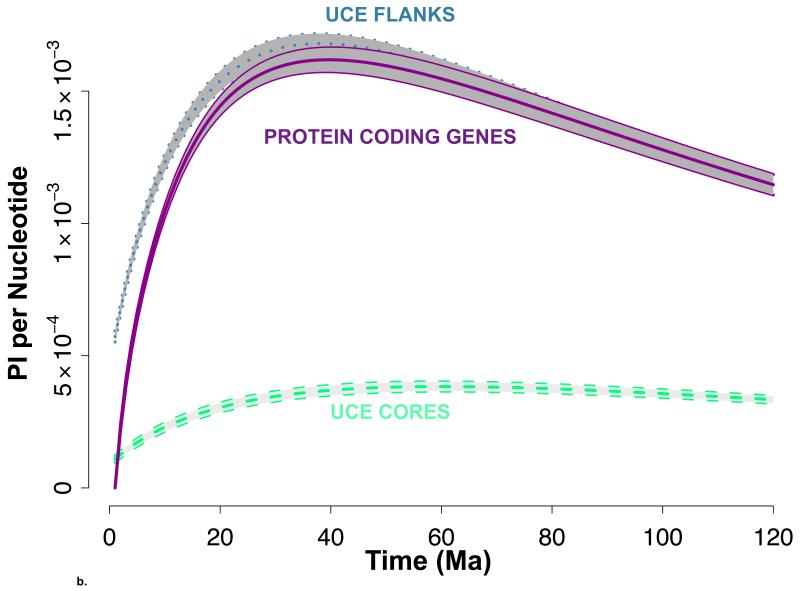
The 95% confidence interval for phylogenetic informativeness (PI) per locus (a) and per nucleotide (b) across time. Flanking regions (dotted, blue), UCE core regions (dashed, green) and protein coding genes (solid, purple) overlay a shaded grey region illustrating the average +/− 2 std. errors. The central line is the average PI across all UCEs or loci for each time point. The estimate for the age of the most recent common ancestor (MRCA) of Tetraodontidae, Lophiformes and Percomorpha is plotted on the x-axis of Figure 2a with grey shading. Chen et al., 20141; Near et al., 20132; Santini et al., 20133; Betancur-R et al.; 20134.
The ability of UCEs to resolve polytomies depends on the time of divergence from the most recent common ancestor (MRCA) of the polytomy, thus we calculated the time in Ma at which PI is maximized. Based on the average and 95% CI, we observed that the UCE flanking region PI reached its maximum at 39 Ma +/− 20 Ma (Figure 2a), which was similar to that of the protein coding genes, suggesting UCE loci should be suitable for resolving the same polytomies as protein coding genes. Similarly, the maximum PI for UCE cores occurred at 61 Ma +/− 20 Ma (Figure 2a), suggesting these data are suitable for resolving polytomies occurring deeper in time.
To illustrate how these maxima correspond to the age of the MRCA of the percomorphs and two key clades within the percomorphs, we included in Figure 2a the estimates of the ages of these clades. We use the results of four previously time calibrated phylogenetic reconstructions. The estimates for the MRCA of the Tetraodontidae span from 18 Ma to 44 Ma (Chen et al., 2014; Santini et al., 2013). The maximum PI for the UCE flanking region and for the protein coding genes fall within this range therefore PIs are still driven far more by signal than noise (Townsend et al. 2007) (Figure 2a). The estimates for the age of the MRCA of Lophiformes span from 50 Ma to 73 Ma (Betancur-R et al., 2013; Chen et al., 2014). At ~60 Ma, the UCE flanking region PI and the protein coding gene PI have decayed to less than 10% from their maxima indicating again that these loci are still within optimal signal for this clade. The estimates for the age of the MRCA for the percomorphs span from 106 Ma to 133 Ma (Betancur-R et al., 2013; Near et al., 2013; Chen et al., 2014). At ~120 Ma, UCE flanking region PI and the protein coding gene PI have decayed less than 33% from their maxima. These comparisons illustrate that UCE flanking regions are appropriate for resolving polytomies with Tetraodontidae, Lophiformes as well as within Percomorpha.
3.3 PI per Nucleotide in Each Data Set
The average and 95% CI for the per nucleotide PI’s of the UCE flanking regions, the UCE core regions and the protein coding genes are shown versus time in Ma in Figure 2b. The UCE flanking regions had PI values that are slightly higher but similar to the protein coding genes. The UCE core regions had the lowest PI at each time point which is likely a consequence of how UCEs are chosen and the different evolutionary pressures on the UCE cores relative to the UCE flanks or the protein coding genes.
3.4 Average PI, Max PI, and Time at Maximum PI for the UCE Core, Flank and Protein Coding Datasets
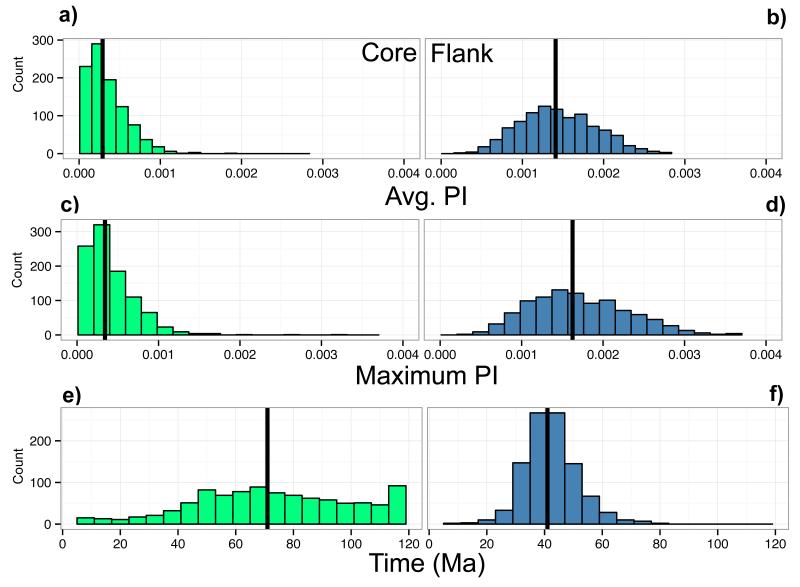
The results shown thus far provide the average UCE behavior for each point in time. When comparing the individual UCEs versus the average behavior across the set, we found that the per nucleotide PI maxima and averages were higher for the flanking regions (mean of max PI = 1.700 × 10⁻³, std. dev. of max PI= 5.955 × 10⁻⁴ and mean of average PI = 1.437 × 10⁻³, std. dev. of average PI = 4.636 × 10⁻⁴) than for its corresponding core regions (mean of max PI = 4.097 × 10⁻⁴, std. dev. of max PI = 3.103 × 10⁻⁴ and mean of average PI = 2.899 × 10⁻⁴, std. dev. of average PI = 2.443 × 10⁻⁴) and were better approximated by normal distributions (Figure 3a-d and Supplemental Table 1).
Figure 3a-f.
UCE core and flank dataset phylogenetic informativeness (PI) distributions. The left column of histograms shows the observed distributions of the core UCE regions. The right column of histograms shows the observed distributions of the flank UCE regions. Average PI per nucleotide for each dataset (a and b); Maximum PI per nucleotide for each dataset (c and d); The time point when PI reaches its maximum for each dataset (e and f). The black line marks the median of each histogram.
For UCE core regions, the median time of maximum PI was 71 Ma (interquartile range for core= 53 Ma, 94 Ma) but the distribution was quite wide with a number of UCE cores reaching its maximum PI at 120 Ma, the oldest time point included in our analysis (Figure 3e). For the UCE flanking regions, the median time of maximum PI was 41 Ma with an interquartile range for the flank of (36 Ma, 47 Ma, Figure 3f). For the protein coding genes, the median time of maximum PI was 32 Ma (Table 1) with an interquartile range of (28.75 Ma, 44.25 Ma).
Table 1.
Summary statistics for average per nucleotide PI, maximum per nucleotide and time at maximum PI for the core, flank and protein coding genes.
| UCE Core Avg. Per nucleotide PI | UCE Flank Avg. Per nucleotide PI | Protein Coding Genes Avg. Per nucleotide PI | |
|---|---|---|---|
| Median | 2.889× 10⁻⁴ | 1.409 × 10⁻³ | 1.08 × 10⁻³ |
| Average | 3.406 × 10⁻⁴ | 1.437 × 10⁻³ | 1.34 × 10⁻³ |
| Std. Deviation | 2.443 × 10⁻⁴ | 4.636 × 10⁻⁴ | 5.8 × 10⁻⁴ |
|
| |||
| UCE Core Max. Per nucleotide PI | UCE Flank Max. Per nucleotide PI | Protein Coding Genes Max. Per nucleotide PI | |
|
| |||
| Median | 3.430 × 10⁻⁴ | 1.625 × 10⁻³ | 1.37 × 10⁻³ |
| Average | 4.097 × 10⁻⁴ | 1.700 × 10⁻³ | 1.61 × 10⁻³ |
| Std. Deviation | 3.103 × 10⁻⁴ | 5.955 × 10⁻⁴ | 6.8 × 10⁻⁴ |
|
| |||
| UCE Core Time At Maximum PI | UCE Flank Time At Maximum PI | Protein Coding Genes Time At Maximum PI | |
|
| |||
| Median | 71 Ma | 41 Ma | 32 Ma |
| Average | 72.71 Ma | 41.84 Ma | 34.9 Ma |
| Std. Deviation | 27.39 Ma | 9.37 Ma | 10.1 Ma |
Note: See Materials and Methods and Figure 3 for details.
3.5 Determinants of PI – Linear Regression Analyses
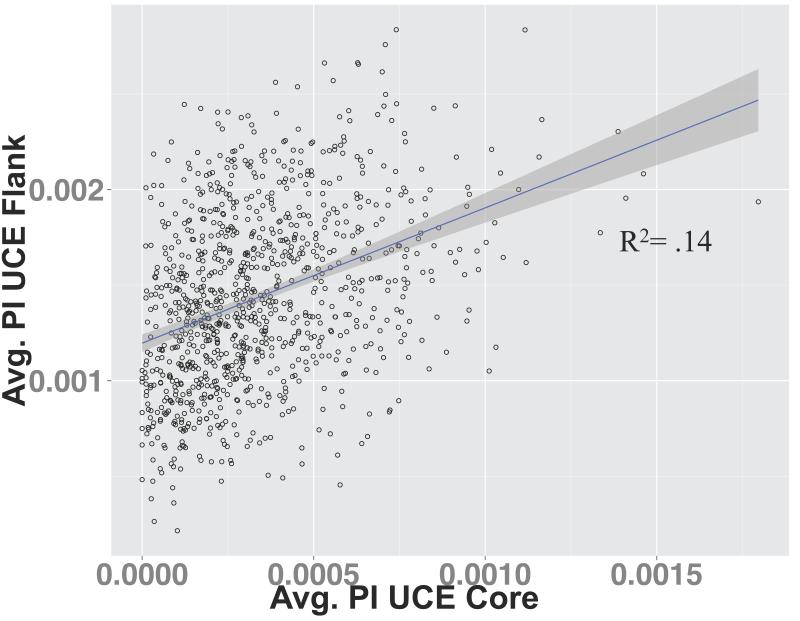
As expected, there was a strong correlation between average per nucleotide PI and the maximum per nucleotide PI for each locus in the UCE core (R2 = 0.91) and UCE flanking regions (R2 = 0.99) (Supplemental Figure 3a-b). We thus only present results for the average per nucleotide PI. We found a significant but weak correlation between average PI per nucleotide for UCE flanking regions and the average PI per nucleotide for the UCE core regions, R2 = 0.14 (Figure 4), indicating that if the UCE had an increased average PI for its core region, they also had an increased PI for its flanking region.
Figure 4.
Average PI per nucleotide for the UCE flanking regions versus average PI per nucleotide for the UCE core regions. Linear regression results: adjusted R2 = 0.14; p-value = <2.2× 10⁻¹⁶; slope = 0.7081; and Y-intercept = 1.196 ×10⁻³.
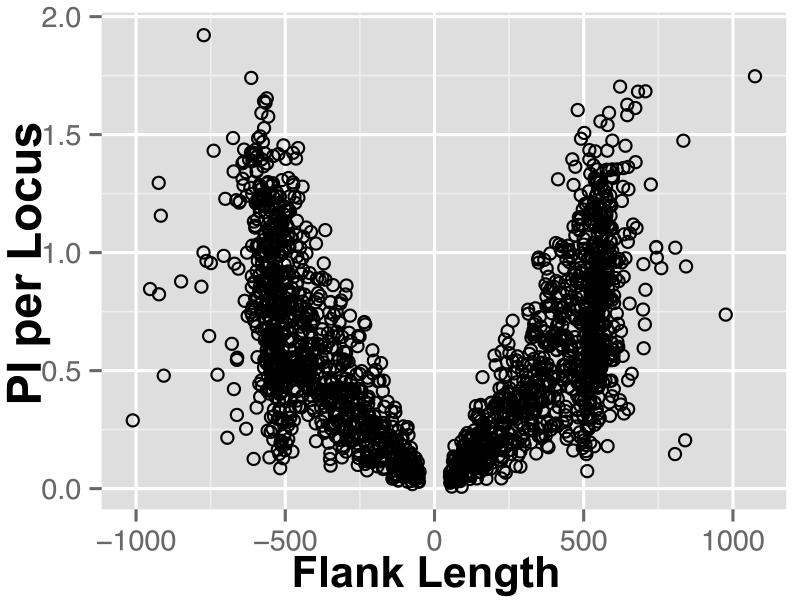
We plotted the average PI per upstream and downstream UCE flanking region against that region’s length (Figure 5). We observed an increasing trend in average PI per region as the flanking region’s length increased, as would be expected as variation has been shown to increase with distance from the core (Faircloth et al. 2012). Further, if we controlled for the average per nucleotide PI of the core, we found that total flank length was a significant predictor of average per nucleotide PI of the flank (p <2.2×10⁻¹⁶, Table 2).
Figure 5.
Average PI for each UCE plotted against upstream and downstream flank length.
Table 2.
Multiple Linear Regression Analysis of PI per nucleotide for the flanking region.
| Coefficients | Estimate | Std. Error | t-value | Pr (>∣t∣) |
|---|---|---|---|---|
| Y-Intercept | 1.042×10⁻³ | 5.178×10⁻⁵ | 20.114 | < 2×10⁻¹⁶ |
| Average PI per nucleotide in the Core Region |
7.322×10⁻¹ | 5.623×10⁻² | 13.022 | < 2×10⁻¹⁶ |
| Total Flank Length | 1.795×10⁻⁷ | 5.361×10⁻⁸ | 3.349 | 8.41×10⁻⁴ |
Note: Residual standard error of 4.28×10⁻⁴ on 985 degrees of freedom. Adjusted R2 of 0.149, F-statistic of 86.23 on 2 and 985 degrees of freedom. P-value <2.2×10⁻¹⁶.
3.6 Verification of the Phylogeny
We recovered the relationships supported in the current literature (Faircloth et al., 2013; Li et al., 2007) with high posterior probabilities using either the protein coding genes or the 988 UCEs (Supplemental Figure 2).
4 Discussion
Molecular marker choice is arguably the most important decision made before one embarks on a phylogenetic analysis. Here we explore 3 datasets: UCE core regions, UCE flanking regions and protein coding gene regions, in order to understand PI patterns. UCE flanking and core regions have higher net PI than protein coding genes (Figure 1). This outcome was expected as there were far more UCEs than protein coding genes analyzed. Our analysis corroborates Faircloth et al. (2012) by finding that the major source of PI for more recent splits is derived from the UCE flanking region and not its core (Faircloth, et al., 2012b). Furthermore as the flanking region length increased the average per locus PI for that region increased (Figure 5). We believe this can be attributed to the fact that longer flanking regions had greater sequence diversity and thus higher PI than shorter regions.
A second important result is that on a per nucleotide scale, the UCE flanking regions have similar PI to protein coding genes (Figure 2b). A priori, we suspected that the protein coding genes would have greater PI than the UCE flanking regions on a per-nucleotide and per-locus level because the protein coding genes we used were carefully selected and validated to be useful in reconstructing the ray-finned fish phylogeny (Li et al., 2007). UCE flanking regions show more variation than the UCE cores and yet are still readily aligned among a set of taxa such as the percomorphs chosen for our analysis. Although we suspect that our results extend beyond these eight taxa, it would be interesting to determine if they hold for a larger set of fishes, birds or mammals.
Despite the low PI of UCE core regions on a per-locus or per nucleotide basis (Figures 2a and 2b), the net PI of the UCE cores exceeds that of the protein coding genes (Figure 1). Although UCEs are highly conserved, they still yield varying levels of PI. The explanation for UCE cores exceeding protein coding genes in net PI is shear loci number. The median time when UCE cores reach its maximum PI is greater than the median time when the UCE flanks reach its maximum PI (Figure 3 and Supplemental Table1), suggesting that UCE cores may be more useful for resolving phylogenetic relationships than previously thought, relationships that are more ancient than the radiation of the percomorphs. Therefore UCE core regions can and should be retained in a phylogenetic reconstruction along with the UCE flanking regions.
Our choice of phylogenetic informativeness as a measure of the suitability of a marker stems from a growing body of publications that demonstrate the comparative quality of PI (Lopez-Giraldez et al., 2013; Schoch et al., 2009; Townsend, 2007; Townsend and Leuenberger, 2011; Townsend et al., 2008). We believe PI holds the key to framing quantitative comparisons of marker types and gives researchers the ability to choose markers based on real data and not just hypothetical assumptions. However PI has garnered criticism in regards to possible biases placed on fast evolving characters in a given sequence or gene and reduced applicability to real datasets with greater than four taxa (Klopfstein et al., 2010). Per Townsend and Leuenberger (2011), we limited our interpretation of PI profiles to details of the phylogeny on which we based our analyses. Detection of the phylogenetic signal, the subsequent loss of that signal and replacement with non-informative character states all depend upon the specific time epoch one is interested in studying.
In summary, our study provides preliminary evidence that the net phylogenetic informativeness of ultraconserved elements, at both flank and core regions, is superior to the phylogenetic informativeness of the set of protein coding genes recommended for resolving polytomies in the percomorphs. The improvement over the protein coding genes in net phylogenetic informativeness is made possible due to the large number of UCEs that can be detected and aligned among these taxa. It is also a novel finding of this study that UCE flanking regions and protein coding genes have similar levels of per nucleotide phylogenetic informativeness. Although a more comprehensive test with more taxa is required to insure that these results are not limited to the specific clades tested here, our results suggest that UCEs are likely to be an effective means for resolving relationships within percomorphs across a range of time scales.
Supplementary Material
Supplemental Figure 3. Linear regression of maximum PI per nucleotide against average PI per nucleotide for the core and flanking regions. a) Core Regions: adjusted R2 = 0.91; slope = 1.212; and Y-intercept = 3.225×10⁻⁶. b) Flanking Regions: adjusted R2 = 0.99; slope = 1.277; and Y-intercept = −1.364×10⁻⁴.
Supplemental Figure 1. In silico time calibrated phylogeny used in TAPIR analysis. Time axis is in millions of years before the present.
Supplemental Figure 2. Phylogenetic reconstruction of the eight percomorph species used in our analysis based on ten protein coding genes from Li et al. (2007) and 988 UCEs. The posterior probabilities for all internal nodes were near 1 (See Supplemental Table 2 for details).
Supplemental Table 1. Accession data for individual gene information (all from Li et al. 2007) downloaded from the ENSEMBL Genome Browser (Hubbard et al., 2007), the UCSC genome browser (Kent et al., 2002) and GenBank (Benson et. al., 2005).
Supplemental Table 2. Branch lengths and the corresponding 95% Bayesian credible intervals (BCI) based on phylogenetic reconstruction using the ten protein coding genes (Li et al., 2007) or Ultra Conserved Elements (UCEs) and the corresponding flanking regions. See Materials and Methods and Supplemental Figure 2 for details.
Highlights.
UCEs outperform gene regions in aggregate as well as at the per locus level.
The majority of the PI of UCEs comes from their flanking regions.
UCE core regions are highly conserved across distant taxa but still carry some PI.
If the UCE core has high PI, then the corresponding flank tends to have high PI.
Acknowledgments
This work was supported by the National Institute of Health-Genomic Analysis Training Program (T32HG002536 to P.S.G.); the U.S. Department of Education Graduate Assistance in Areas of National Need (to P.S.G); the Whitcome Research Fellowship (to J.C.); and the National Science Foundation (DMS-1264153 to J.S.S., DEB 6861953 to M.E.A; DEB 6702648 to M.E.A).
Footnotes
Publisher's Disclaimer: This is a PDF file of an unedited manuscript that has been accepted for publication. As a service to our customers we are providing this early version of the manuscript. The manuscript will undergo copyediting, typesetting, and review of the resulting proof before it is published in its final citable form. Please note that during the production process errors may be discovered which could affect the content, and all legal disclaimers that apply to the journal pertain.
References
- Abascal F, Zardoya R, Telford MJ. TranslatorX: multiple alignment of nucleotide sequences guided by amino acid translations. Nucl. Acids Res. 2010;38:W7–W13. doi: 10.1093/nar/gkq291. [DOI] [PMC free article] [PubMed] [Google Scholar]
- Bejerano G, Pheasant M, Makunin I, Stephen S, Kent WJ, Mattick JS, Haussler D. Ultraconserved elements in the human genome. Science. 2004;304:1321–1325. doi: 10.1126/science.1098119. [DOI] [PubMed] [Google Scholar]
- Benson DA, Karsch-Mizrachi I, Lipman DJ, Ostell J, Wheeler DL. GenBank. Nucl. Acids Res. 2005;33:D34–D38. doi: 10.1093/nar/gki063. [DOI] [PMC free article] [PubMed] [Google Scholar]
- Betancur-R R, Broughton RE, Wiley EO, Carpenter K, Lopez JA, Li C, Holcroft NI, Arcila D, Sanciangco M, Cureton Ii JC, Zhang F, Buser T, Campbell MA, Ballesteros JA, Roa-Varon A, Willis S, Borden WC, Rowley T, Reneau PC, Hough DJ, Lu G, Grande T, Arratia G, Orti G. The tree of life and a new classification of bony fishes. PLoS Curr. ToL. 2013;1 doi: 10.1371/currents.tol.53ba26640df0ccaee75bb165c8c26288. doi:10.1371/currents.tol.53ba26640df0ccaee75bb165c8c26288. [DOI] [PMC free article] [PubMed] [Google Scholar]
- Broughton RE, Betancur-R R, Li C, Arratia G, Ortí G. Multi-locus phylogenetic analysis reveals the pattern and tempo of bony fish evolution. PLoS Curr. ToL. 2013;1 doi: 10.1371/currents.tol.2ca8041495ffafd0c92756e75247483e. doi:10.1371/currents.tol.2ca8041495ffafd0c92756e75247483e. [DOI] [PMC free article] [PubMed] [Google Scholar]
- Crawford NG, Faircloth BC. Cloudforest: code to calculate species trees from large genomic datasets. 2014. doi:10.5281/zenodo.12259.
- Crawford NG, Faircloth BC, McCormack JE, Brumfield RT, Winker K, Glenn TC. More than 1000 ultraconserved elements provide evidence that turtles are the sister group of Archosaurs. Biol. Lett. 2012;8:783–786. doi: 10.1098/rsbl.2012.0331. [DOI] [PMC free article] [PubMed] [Google Scholar]
- Derti A, Roth FP, Church GM, Wu CT. Mammalian ultraconserved elements are strongly depleted among segmental duplications and copy number variants. Nat. Genet. 2006;38:1216–1220. doi: 10.1038/ng1888. [DOI] [PubMed] [Google Scholar]
- Dornburg A, Townsend JP, Friedman M, Near TJ. Phylogenetic informativeness reconciles ray-finned fish molecular divergence times. BMC Evol. Bio. 2014;14:169. doi: 10.1186/s12862-014-0169-0. doi:10.1186/s12862-014-0169-0. [DOI] [PMC free article] [PubMed] [Google Scholar]
- Edgar RC. MUSCLE: multiple sequence alignment with high accuracy and high throughput. Nucl. Acids Res. 2004;32:1792–1797. doi: 10.1093/nar/gkh340. [DOI] [PMC free article] [PubMed] [Google Scholar]
- Faircloth BC, Branstetter MG, White ND, Brady SG. Target enrichment of ultraconserved elements from arthropods provides a genomic perspective on relationships among Hymenoptera. Mol. Ecol. Res. 2014;15:489–501. doi: 10.1111/1755-0998.12328. doi:10.1111/1755-0998.12328. [DOI] [PMC free article] [PubMed] [Google Scholar]
- Faircloth BC, Chang J, Alfaro ME. TAPIR enables high-throughput estimation and comparison of phylogenetic informativeness using locus-specific substitution models. arXiv preprint. 2012a arXiv:12021215 2012, 1215. [Google Scholar]
- Faircloth BC, McCormack JE, Crawford NG, Harvey MG, Brumfield RT, Glenn TC. Ultraconserved elements anchor thousands of genetic markers spanning multiple evolutionary timescales. Syst. Biol. 2012b;61:717–726. doi: 10.1093/sysbio/sys004. [DOI] [PubMed] [Google Scholar]
- Faircloth BC, Sorenson L, Santini F, Alfaro ME. A phylogenomic perspective on the radiation of ray-finned fishes based upon targeted sequencing of ultraconserved elements (UCEs) PLoS One. 2013;8:e65923. doi: 10.1371/journal.pone.0065923. [DOI] [PMC free article] [PubMed] [Google Scholar]
- Harrell FE, Jr., Dupont MC. R package Hmisc. R Foundation for Statistical Computing; Vienna, Austria: 2014. [Google Scholar]
- Harris RS. Computer Science and Engineering. The Pennsylvania State University; PA, USA: 2007. Improved pairwise alignment of genomic DNA. [Google Scholar]
- Hubbard TJ, Aken BL, Beal K, Ballester B, Caccamo M, Chen Y, Clarke L, Coates G, Cunningham F, Cutts T, Down T, Dyer SC, Fitzgerald S, Fernandez-Banet J, Graf S, Haider S, Hammond M, Herrero J, Holland R, Howe K, Howe K, Johnson N, Kahari A, Keefe D, Kokocinski F, Kulesha E, Lawson D, Longden I, Melsopp C, Megy K, Meidl P, Ouverdin B, Parker A, Prlic A, Rice S, Rios D, Schuster M, Sealy I, Severin J, Slater G, Smedley D, Spudich G, Trevanion S, Vilella A, Vogel J, White S, Wood M, Cox T, Curwen V, Durbin R, Fernandez-Suarez XM, Flicek P, Kasprzyk A, Proctor G, Searle S, Smith J, Ureta-Vidal A, Birney E. Ensembl 2007. Nucl. Acids Res. 2007;35:D610–617. doi: 10.1093/nar/gkl996. [DOI] [PMC free article] [PubMed] [Google Scholar]
- Huelsenbeck JP, Ronquist F. MRBAYES: Bayesian inference of phylogeny. Bioinformatics. 2001;17:754–755. doi: 10.1093/bioinformatics/17.8.754. [DOI] [PubMed] [Google Scholar]
- Kent WJ, Sugnet CW, Furey TS, Roskin KM, Pringle TH, Zahler AM, Haussler David. The human genome browser at UCSC. Genome Res. 2002;12:996–1006. doi: 10.1101/gr.229102. [DOI] [PMC free article] [PubMed] [Google Scholar]
- Klopfstein S, Kropf C, Quicke DL. An evaluation of phylogenetic informativeness profiles and the molecular phylogeny of diplazontinae (Hymenoptera, Ichneumonidae) Syst. Biol. 2010;59:226–241. doi: 10.1093/sysbio/syp105. [DOI] [PubMed] [Google Scholar]
- Li B, Dettai A, Cruaud C, Couloux A, Desoutter-Meniger M, Lecointre G. RNF213, a new nuclear marker for acanthomorph phylogeny. Mol. Phylog. Evol. 2009;50:345–363. doi: 10.1016/j.ympev.2008.11.013. [DOI] [PubMed] [Google Scholar]
- Li C, Lu G, Orti G. Optimal data partitioning and a test case for ray-finned fishes (Actinopterygii) based on ten nuclear loci. Syst. Biol. 2008;57:519–539. doi: 10.1080/10635150802206883. [DOI] [PubMed] [Google Scholar]
- Li C, Orti G, Zhang G, Lu G. A practical approach to phylogenomics: the phylogeny of ray-finned fish (Actinopterygii) as a case study. BMC Evol Biol. 2007;7:44. doi: 10.1186/1471-2148-7-44. [DOI] [PMC free article] [PubMed] [Google Scholar]
- Lopez-Giraldez F, Moeller AH, Townsend JP. Evaluating phylogenetic informativeness as a predictor of phylogenetic signal for metazoan, fungal, and mammalian phylogenomic data sets. Biomed Res. Int. 2013;2013:621604. doi: 10.1155/2013/621604. http://dx.doi.org/10.1155/2013/621604. [DOI] [PMC free article] [PubMed] [Google Scholar]
- Lopez-Giraldez F, Townsend JP. PhyDesign: an online application for profiling phylogenetic informativeness. BMC Evol. Biol. 2011;11:152. doi: 10.1186/1471-2148-11-152. [DOI] [PMC free article] [PubMed] [Google Scholar]
- McCormack JE, Faircloth BC, Crawford NG, Gowaty PA, Brumfield RT, Glenn TC. Ultraconserved elements are novel phylogenomic markers that resolve placental mammal phylogeny when combined with species-tree analysis. Genome Res. 2012;22:746–754. doi: 10.1101/gr.125864.111. [DOI] [PMC free article] [PubMed] [Google Scholar]
- McCormack JE, Harvey MG, Faircloth BC, Crawford NG, Glenn TC, Brumfield RT. A phylogeny of birds based on over 1,500 loci collected by target enrichment and high-throughput sequencing. PLoS One. 2013;8:e54848. doi: 10.1371/journal.pone.0054848. [DOI] [PMC free article] [PubMed] [Google Scholar]
- Miller W, Rosenbloom K, Hardison RC, Hou M, Taylor J, Raney B, Burhans R, King DC, Baertsch R, Blankenberg D, Kosakovsky Pond SL, Nekrutenko A, Giardine B, Harris RS, Tyekucheva S, Diekhans M, Pringle TH, Murphy WJ, Lesk A, Weinstock GM, Lindblad-Toh K, Gibbs RA, Lander ES, Siepel A, Haussler D, Kent WJ. 28-Way vertebrate alignment and conservation track in the UCSC genome browser. Genome Res. 2007;17:1797–1808. doi: 10.1101/gr.6761107. [DOI] [PMC free article] [PubMed] [Google Scholar]
- Near TJ, Dornburg A, Eytan RI, Keck BP, Smith WL, Kuhn KL, Moore JA, Price SA, Burbrink FT, Friedman M, Wainwright PC. Phylogeny and tempo of diversification in the superradiation of spiny-rayed fishes. Proc. Natl. Acad. Sci. USA. 2013;110:12738–12743. doi: 10.1073/pnas.1304661110. [DOI] [PMC free article] [PubMed] [Google Scholar]
- Near TJ, Dornburg A, Kuhn KL, Eastman JT, Pennington JN, Patarnello T, Zane L, Fernández DA, Jones CD. Ancient climate change, antifreeze, and the evolutionary diversification of Antarctic fishes. Proc. Natl. Acad. Sci. 2012;109:3434–3439. doi: 10.1073/pnas.1115169109. [DOI] [PMC free article] [PubMed] [Google Scholar]
- Pond SL, Frost SD, Muse SV. HyPhy: hypothesis testing using phylogenies. Bioinformatics. 2005;21:676–679. doi: 10.1093/bioinformatics/bti079. [DOI] [PubMed] [Google Scholar]
- Rambaut A, Suchard MA, Xie D, Drummond AJ. Tracer v.16- MCMC Trace Analysis Tool. 2014 Available from http://beast.bio.ed.ac.uk/Tracer.
- Ronquist F, Huelsenbeck JP. MrBayes 3: Bayesian phylogenetic inference under mixed models. Bioinformatics. 2003;19:1572–1574. doi: 10.1093/bioinformatics/btg180. [DOI] [PubMed] [Google Scholar]
- Ronquist F, Teslenko M, van der Mark P, Ayres DL, Darling A, Höhna S, Larget B, Liu L, Suchard MA, Huelsenbeck JP. MrBayes 3.2: Efficient Bayesian phylogenetic inference and model choice across a large model space. Syst. Biol. 2012;61:539–542. doi: 10.1093/sysbio/sys029. [DOI] [PMC free article] [PubMed] [Google Scholar]
- Santini F, Harmon LJ, Carnevale G, Alfaro ME. Did genome duplication drive the origin of teleosts? A comparative study of diversification in ray-finned fishes. BMC Evol. Biol. 2009;9:194. doi: 10.1186/1471-2148-9-194. [DOI] [PMC free article] [PubMed] [Google Scholar]
- Santini F, Nguyen MTT, Sorenson L, Waltzek TB, Lynch Alfaro JW, Eastman JM, Alfaro ME. Do habitat shifts drive diversification in teleost fishes? An example from the pufferfishes (Tetraodontidae) J. Evol. Biol. 2013;26:1003–1018. doi: 10.1111/jeb.12112. [DOI] [PubMed] [Google Scholar]
- Schoch CL, Sung GH, Lopez-Giraldez F, Townsend JP, Miadlikowska J, Hofstetter V, Robbertse B, Matheny PB, Kauff F, Wang Z, Gueidan C, Andrie RM, Trippe K, Ciufetti LM, Wynns A, Fraker E, Hodkinson BP, Bonito G, Groenewald JZ, Arzanlou M, de Hoog GS, Crous PW, Hewitt D, Pfister DH, Peterson K, Gryzenhout M, Wingfield MJ, Aptroot A, Suh SO, Blackwell M, Hillis DM, Griffith GW, Castlebury LA, Rossman AY, Lumbsch HT, Lucking R, Budel B, Rauhut A, Diederich P, Ertz D, Geiser DM, Hosaka K, Inderbitzin P, Kohlmeyer J, Volkmann-Kohlmeyer B, Mostert L, O’Donnell K, Sipman H, Rogers JD, Shoemaker RA, Sugiyama J, Summerbell RC, Untereiner W, Johnston PR, Stenroos S, Zuccaro A, Dyer PS, Crittenden PD, Cole MS, Hansen K, Trappe JM, Yahr R, Lutzoni F, Spatafora JW. The Ascomycota tree of life: a phylum-wide phylogeny clarifies the origin and evolution of fundamental reproductive and ecological traits. Syst. Biol. 2009;58:224–239. doi: 10.1093/sysbio/syp020. [DOI] [PubMed] [Google Scholar]
- Siepel A, Bejerano G, Pedersen JS, Hinrichs AS, Hou M, Rosenbloom K, Clawson H, Spieth J, Hillier LW, Richards S, Weinstock GM, Wilson RK, Gibbs RA, Kent WJ, Miller W, Haussler D. Evolutionarily conserved elements in vertebrate, insect, worm, and yeast genomes. Genome Res. 2005;15:1034–1050. doi: 10.1101/gr.3715005. [DOI] [PMC free article] [PubMed] [Google Scholar]
- Simons C, Pheasant M, Makunin IV, Mattick JS. Transposon-free regions in mammalian genomes. Genome Res. 2006;16:164–172. doi: 10.1101/gr.4624306. [DOI] [PMC free article] [PubMed] [Google Scholar]
- Smith BT, Harvey MG, Faircloth BC, Glenn TC, Brumfield RT. Target capture and massively parallel sequencing of ultraconserved elements for comparative studies at shallow evolutionary time scales. Syst, Biol. 2014;63:83–95. doi: 10.1093/sysbio/syt061. [DOI] [PubMed] [Google Scholar]
- Smith WL, Craig MT, Quattro JM. Casting the Percomorph Net Widely: The importance of broad taxonomic sampling in the search for the placement of Serranid and Percid fishes. Copeia. 2007;1:35–55. [Google Scholar]
- Stephen S, Pheasant M, Makunin IV, Mattick JS. Large-scale appearance of ultraconserved elements in tetrapod genomes and slowdown of the molecular clock. Mol. Biol. Evol. 2008;25:402–408. doi: 10.1093/molbev/msm268. [DOI] [PubMed] [Google Scholar]
- Sun K, Meiklejohn KA, Faircloth BC, Glenn TC, Braun EL, Kimball RT. The evolution of peafowl and other taxa with ocelli (eyespots): a phylogenomic approach. Proc. R. Soc. B. 2014;281 doi: 10.1098/rspb.2014.0823. doi:10.1098/rspb.2014.0823. [DOI] [PMC free article] [PubMed] [Google Scholar]
- R Core Team . R: A language and environment for statistical computing. R Foundation for Statistical Computing; Vienna, Austria: 2014. http://www.R-project.org/ [Google Scholar]
- Townsend JP. Profiling phylogenetic informativeness. Syst. Biol. 2007;56:222–231. doi: 10.1080/10635150701311362. [DOI] [PubMed] [Google Scholar]
- Townsend JP, Leuenberger C. Taxon sampling and the optimal rates of evolution for phylogenetic inference. Syst. Biol. 2011;60:358–365. doi: 10.1093/sysbio/syq097. [DOI] [PubMed] [Google Scholar]
- Townsend JP, Lopez-Giraldez F, Friedman R. The phylogenetic informativeness of nucleotide and amino acid sequences for reconstructing the vertebrate tree. J Mol Evol. 2008;67:437–447. doi: 10.1007/s00239-008-9142-0. [DOI] [PubMed] [Google Scholar]
- Wainwright PC, Smith WL, Price SA, Tang KL, Sparks JS, Ferry LA, Kuhn KL, Eytan RI, Near TJ. The evolution of pharyngognathy: a phylogenetic and functional appraisal of the pharyngeal jaw key innovation in labroid fishes and beyond. Syst. Biol. 2012;61:1001–1027. doi: 10.1093/sysbio/sys060. [DOI] [PubMed] [Google Scholar]
- Warnes GR, Bolker B, Lumley T. gtools: various R programming tools. (R package version 3.4.1) 2014 http://CRAN.R-project.org/package=gtools.
- Wickham H. ggplot2: elegant graphics for data analysis. Springer; New York: 2009. [Google Scholar]
- Wickham H. The split-Apply-Combine Strategy for Data Analysis. J Stat. Softw. 2011;40:1–29. [Google Scholar]
Associated Data
This section collects any data citations, data availability statements, or supplementary materials included in this article.
Supplementary Materials
Supplemental Figure 3. Linear regression of maximum PI per nucleotide against average PI per nucleotide for the core and flanking regions. a) Core Regions: adjusted R2 = 0.91; slope = 1.212; and Y-intercept = 3.225×10⁻⁶. b) Flanking Regions: adjusted R2 = 0.99; slope = 1.277; and Y-intercept = −1.364×10⁻⁴.
Supplemental Figure 1. In silico time calibrated phylogeny used in TAPIR analysis. Time axis is in millions of years before the present.
Supplemental Figure 2. Phylogenetic reconstruction of the eight percomorph species used in our analysis based on ten protein coding genes from Li et al. (2007) and 988 UCEs. The posterior probabilities for all internal nodes were near 1 (See Supplemental Table 2 for details).
Supplemental Table 1. Accession data for individual gene information (all from Li et al. 2007) downloaded from the ENSEMBL Genome Browser (Hubbard et al., 2007), the UCSC genome browser (Kent et al., 2002) and GenBank (Benson et. al., 2005).
Supplemental Table 2. Branch lengths and the corresponding 95% Bayesian credible intervals (BCI) based on phylogenetic reconstruction using the ten protein coding genes (Li et al., 2007) or Ultra Conserved Elements (UCEs) and the corresponding flanking regions. See Materials and Methods and Supplemental Figure 2 for details.


