

Abstract
Matching the acoustic impedance of high-frequency (≥100 MHz) ultrasound transducers to an aqueous loading medium remains a challenge for fabricating high-frequency transducers. The traditional matching layer design has been problematic to establish high matching performance given requirements on both specific acoustic impedance and precise thickness. Based on both mass-spring scheme and microwave matching network analysis, we interfaced metal-polymer layers for the matching effects. Both methods hold promises for guiding the metal-polymer matching layer design. A 100 MHz LiNbO3 transducer was fabricated to validate the performance of the both matching layer designs. In the pulse-echo experiment, the transducer echo amplitude increased by 84.4% and its −6dB bandwidth increased from 30.2% to 58.3% comparing to the non-matched condition, demonstrating that the matching layer design method is effective for developing high-frequency ultrasonic transducers.
High-frequency (≥100 MHz) ultrasound has numerous applications from high resolution scanning acoustic microscopy1 to cellular stimulation and particle manipulation.2,3 However, fabricating high-frequency transducers with high sensitivity and broad bandwidth remains technically challenging.4,5 To fabricate transducers with high acoustic impedance piezoelectric materials such as lithium niobate (LiNbO3), lead zirconate titanate (PZT), and lead magnesium niobate-lead titanate (PMN-PT), an acoustic impedance matching layer is essential to allow the piezoelectric material-generated acoustic wave to propagate to the medium (typically water) with high sensitivity and broad bandwidth.6
Traditional quarter-wavelength matching mechanism requires specific material impedance and thickness (quarter-wavelength).7–9 Both requirements may be achieved by tuning the acoustic impedance of the matching layer material and lapping it to quarter-wavelength thickness. The acoustic impedance of the matching material is tuned by mixing high impedance particles with low impedance polymer at a certain ratio. At low frequencies, the fabrication inaccuracy is small compared to the ultrasound wavelength, allowing a sufficiently precise lapping procedure for thickness control.
For high-frequency ultrasound transducers, on the contrary, the quarter-wavelength approach becomes technically impractical. It remains difficult to simultaneously achieve both specific acoustic impedance and precise thickness. Controlling the precise thickness during the lapping process is challenging for the matching material prepared by mixing particles and polymers. Furthermore, the mixture properties deviate noticeably from homogenous ones as the wavelength shortens and approaches the particle size for high-frequency ultrasound. Besides, both high scattering inside the material and rough surface of the matching layer reduce the performance. On the other hand, a homogenous material would allow a precise thickness control by coating or deposition process. However, materials with the ideal impedance and suitable for deposition are rare. Therefore, neither of these approaches is suitable in the quarter-wavelength matching layer design for the high frequency ultrasound transducers.
Recently, two independent methods were developed to avoid reliance on specific impedance of the material for matching layers. Both methods will entail two layers with different impedances, and the thickness of the two layers will be tuned to a specific matching effect. The first method is based on the mass-spring approach10–12 that uses the high impedance material as non-deformed mass and the low impedance layer as a spring. High efficiency acoustic wave propagation is achieved by tuning the resonant frequency and equivalent impedance of the mass-spring system. The second method is based on the electromagnetic microwave theory that uses the identical wave propagation equations to consider the individual layers as a section of transmission line to design the impedance matching network.13,14 High transmission efficiency and low reflection coefficient can be achieved by tuning the matching network.
In this study, we implemented both methods to design the impedance matching layers and compared their merits and trade-offs. Parameters of the matching layers were further optimized with Krimholtz–Leedom–Mattaei (KLM) modeling15 and verified by a 100 MHz transducer prototype. Pulse-echo experiment was used to characterize the matching layer performance and to compare between the matched and the non-matched transducers. Referring to the absence of the matching layer, the amplitude of the signal from the matched transducer was improved by 84.4%, and the −6 dB bandwidth ameliorated from 30.2% to 58.3%, indicating the enhanced performance of the matched transducer by the matching methods for high frequency transducers.
The mass-spring method uses the high- and low-impedance layers as a mass and a spring to form a resonator system.7,8 Because of the significant difference in the impedance between the two layers, the high impedance layer is barely deformed in the system compared to the low impedance layer (Figure 1). By defining ρs and ρm as the densities of the spring layer and mass layer materials, respectively; ts and tm as the thicknesses of the spring layer and mass layer, respectively; vs as the speed of sound in the spring layer; and Zl as the load impedance of the medium into which the acoustic wave propagates, the approximate resonance frequency (f) of a two layer mass-spring combination as well as the equivalent impedance at the driven end of spring Z1 (boundary with the piezoelectric layer) can be defined as
| (1) |
| (2) |
FIG. 1.
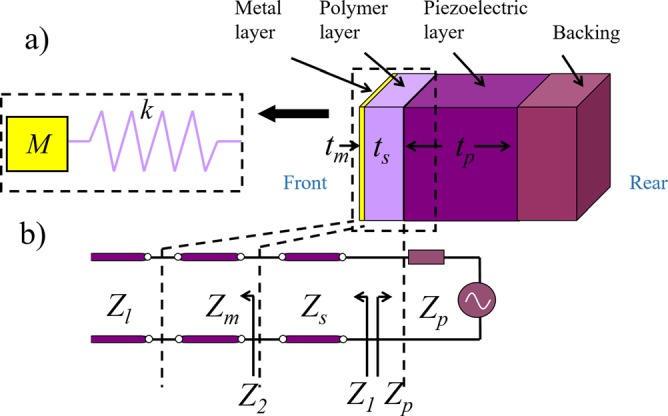
Schematic view of (a) acoustic structure with the equivalent mass-spring model and (b) its equivalent circuits. Parameters t and Z denote the thickness and acoustic impedance of the particular material or port with subscripts p, s, m, and l indicating materials of piezoelectric element, spring layer, mass layer, and load medium, respectively. Subscripts 1 and 2 denote the input/output impedance at the ports shown in the figures.
Hence, the resonant frequency and equivalent impedance Z1 are dependent on the materials and thicknesses of both mass and spring layers. In the matching layer design with specific materials (both piezoelectric material and the passive materials), the thicknesses of the mass and spring layers can be numerically calculated to resonate at center frequency (f) with an equivalent impedance of Z1. A large range of equivalent matching impedance can be achieved with continuous variance.
The microwave method takes the advantage of the universal wave equations and utilizes the microwave network design to match the impedance and to enhance the wave propagation efficiency.13,14 The individual layers in a vibration system are equivalent to a section of transmission line (Figure 1). The acoustic impedance of each layer could be analyzed as an electrical impedance of the transmission line by referring to the wavelength in each system, and the thickness of each layer could be converted to the length of the transmission line. The equivalent impedance at each layer is defined as
| (3) |
| (4) |
where γ is the propagation constant defined as , and α and β are the real and imaginary term of the propagation constant, representing the physical attenuation and phase constants, respectively. In the matching layer design, the attenuation α is low and the thickness t is small. Consequently, the loss is negligible and each hyperbolic tangent reduces to . Similar to the mass-spring method, for a given material, the thicknesses of the matching layers can be calculated to generate a matched Z1. Both the propagation constant γ and the phase constant β are related to the wavelength in the center frequency. For this reason, Z1 is also frequency-dependent as previously reported by the microwave approach for multi-layer vibrations.14
The two methods for the matching layer design entail merits and trade-offs. The mass-spring method is an intrinsic mechanical phenomenon to provide straightforward equivalent impedance. However, this method is based on a lumped element approximation, neglecting the deformation of the mass layer. Its accuracy depends on the assumption that the impedance of the mass layer is significantly higher than that of the spring layer. This model provides guidance on the passive layer design, excluding the properties of the piezoelectric material. On the contrary, the microwave method uses the distributed model as a transmission line for high accuracy. There is no limitation to the number of layers and their impedance. Meanwhile, the Smith chart13,16 illustrates the equivalent impedance and the reflection coefficient, demonstrating the explicit matching effect. The phasor from the origin (center) to a position in the Smith Chart represents the reflection coefficient, length of the phasor indicating the amplitude of the reflection, and the direction indicating the phase. With each layer added in sequence, the loci shift clockwise as a circle with centers on the horizontal middle line () and the position dependent on the impedance of the material (the center of the circle is not the material impedance value on the chart). Meanwhile, the impedance can be directly read from the chart according to the markers (constant resistance or reactance arcs, black curves in Figure 2(c)). As labeled in the chart, the center is the matched point and the edge means 100% reflection. On the curve marked with “Constant R,” together with those (almost) parallel with it, the imaginary value reactance of the impedance changes while the real value resistance keeps constant. Contrarily, on the curves (locally) perpendicular with the “Constant R” curves (marked as “Constant X”), the real value resistance varies while the imaginary value reactance remains constant. As both reflection information and the impedance information are plotted in the same chart, the reflection information can be directly read from the impedance value and vice versa. However, the correlation between a mechanical wave and an electromagnetic wave is subjected to slight mismatch in terms of the anisotropic properties of materials and Poisson's ratio in finite size transducers. Similarly to the mass-spring method, the microwave approach merely analyzes the passive layers, excluding the piezoelectric properties. A summary of the two methods is shown in Table I.
FIG. 2.

(a) Simulation result of the equivalent impedance associated with the thickness of mass and spring layers for 100 MHz transducer using mass-spring. In (a), the values are resonant frequency, which varies in the figure. The black dashed line in spring-mass model indicates the 100 MHz frequency. (b) Equivalent impedance simulation with transmission line theory. In (b), all the values are corresponded to constant frequency at 100 MHz. A black dashed line was plotted at identical thicknesses of gold and parylene with (a) to make comparison with the mass-spring method. (c) Loci of the transducer shown on a Smith chart normalized to the equivalent impedance of 12.13. Loci of design performance calculated from microwave were labeled as “Calc.,” while those optimized by KLM model for fabrication were labeled as “Fabr.” (d) Modeled result with KLM model-based simulation software PIEZOCAD.
TABLE I.
Comparison of two approaches for matching layer design.
| Methods | Pros | Cons |
|---|---|---|
| Mass-spring | • Intrinsically mechanical vibration• Straightforward• Clear physical conception | • Lumped elements (less accuracy)• Large impedance difference needed• No piezoelectricity |
| Microwave | • Distributed calculation• Arbitrary number of layers• Arbitrary impedances of the layers• Clear display in Smith Chart | • Electro-mechanical correlation• No piezoelectricity |
Materials selected for the verification transducer are listed in Table II. LiNbO3 was selected as the piezoelectric material. Gold and parylene were selected for the mass and spring layer, respectively, because of their significant impedance difference and capability for accurate thickness control. The goal of the gold and parylene layers is to make the equivalent impedance at the surface of the piezoelectric layer to be at the designed frequency,6 where Zp is the impedance of the LiNbO3 and Zl is the load impedance (water). In this specific case in association with the selected materials (Table II), an equivalent acoustic impedance is 12.13 MRayl. Both methods estimated that the 12.13 MRayl acoustic impedance could be achieved with an approximate thicknesses of 250 nm and 2.5 μm for the gold and parylene layers, respectively (Figures 2(a) and 2(b)). The equivalent impedance is a complex number, and the phase affects the wave propagation efficiency. For these reasons, the magnitude of the impedance is insufficient to estimate the performance. The complete performance of the matching network with impedance (complex value) and reflection coefficient (complex value) can be visualized in Smith Chart (Figure 2(c), marked as calculation).16 In Smith Chart, the impedance was shifted from the edge to the center, indicating that the impedance was matched by the two layers.
TABLE II.
Parameters of the materials selected for the transducer.
| Material | Function | Velocity (m/s) | Density (kg/m3) | Acoustic impedance (MRayl) |
|---|---|---|---|---|
| LiNbO3 single crystal | Piezoelectric element | 7360 | 4688 | 34.5 |
| Parylene | Matching layer | 2350 | 1100 | 2.58 |
| Gold | Matching layer | 3240 | 19 700 | 63.8 |
| Water | Front load | 1540 | 1000 | 1.54 |
| E-Solder 3022 | Conductive backing | 1850 | 3200 | 5.92 |
| EPO-TEK 301 | Insulating epoxy | 2650 | 1150 | 3.05 |
The calculated results with both approaches demonstrate the impedance tuning capability in good agreement with each other (Figures 2(a) and 2(b)). For the thin gold layer (<100 nm), the parylene layer is unable to sufficiently increase the equivalent impedance. As the thickness of the gold layer increases, the equivalent impedance Z1 is continuously adjustable in a large range as a function of parylene thickness. This continuous impedance variation leads to the capability of impedance matching without relying on the specific impedances of materials. The two independent methods revealed similar results according to the calculation due to the fact that the impedance of the mass and spring layers are significantly different (>30 times difference in this case) for an accurate approximation of the vibration system in the mass-spring model. In addition, the transmission line method is also reliable because the electromagnetic wave and the mechanical wave share identical wave propagation equations.
As shown in Table I, both methods share the similar trade-offs by excluding the piezoelectric properties in the model (Figure 2), which function as a basic guidance on the matching layer design with limited accuracy. In order to optimize the parameters for the high-frequency transducer fabrication, we used the KLM model-based software PIEZOCAD (Sonic Concepts, Woodinville, WA) to simulate the transducer performance. According to the simulation, a relatively high amplitude signal and broad bandwidth (Figure 2(d)) design required a gold layer at the thickness of 200 nm and the parylene at 3 μm. The KLM model took the piezoelectricity into account for optimization, the parameters of which were used for fabrication of transducers. The matching locus is shown in the Smith chart as fabrication parameters (Figure 2(c)).
A single element transducer with 100 MHz center frequency was designed and fabricated to verify the performance of the matching layer design. Given the high frequency (≥100 MHz) and high precision requirement (within 1 μm range), minute discrepancies among transducers could entail a noticeable mismatch to degrade the verification reliability. To minimize the discrepancy, the verification was made on one transducer prior to and after fabricating the matching layers. A 36° rotated Y-cut LiNbO3 (Boston Piezo-optics Bellingham, MA) was first lapped down to 29 μm to make the transducer operating at around 100 MHz. This LiNbO3 wafer was electroded by sputtering a Chrome/gold (50 nm/100 nm) layer at the rear (Figure 1) surface, followed by casting conductive epoxy (E-Solder 3022, Von Roll Isola Inc., New Haven, CT) as backing material. A lathe was used to shape the element into the desired diameter which is 1.8 mm according to the simulation result. Then a lead wire was secured to the backing layer with an additional amount of conductive epoxy, and a brass housing was used as RF shield. The transducer was connected with a SMA connector, and a layer of chrome/gold then was sputtered at the transducer front surface (Figure 1). For the matching layer fabrication, a parylene layer at 3 μm in thickness was vapor-deposited using a PDS 2010 LABCOATER (SCS, Indianapolis, IN), and then gold was sputtered at 0.2 μm in thickness (Figures 3(a), 3(d), and 3(b)).
FIG. 3.

(a) Schematic and (b) photo of the 100 MHz LiNbO3 transducer with matching layers. A comparison is made on the pulse-echo experiment with the transducer (c) before and (d) after the matching layers deposition at the top surface.
The conventional pulse-echo response measurement was carried out in distilled water,17 in which the transducer was connected to a JSR Ultrasonics DPR 500 (Imaginant, Pittsford, NY) pulser/receiver and excited by an electrical impulse at 200 Hz repetition rate and 50 Ω damping. The energy involved was 2.3 μJ and no gain was applied. An X-cut quartz plate was used as a target. In the absence of the matching layer, the amplitude (absolute value of Hilbert transform of the echo) of the echo is 0.528 V and the −6 dB bandwidth is 30.2% (Figure 3(c)). In the presence of the parylene-gold matching layers, the amplitude of the echo increased to 0.973 V and the −6 dB bandwidth increased to 58.3% (Figure 3(d)). Both the sensitivity and bandwidth were significantly enhanced. The center frequency of the transducer with matching layers shifted down slightly, which is reasonable because more layers in the vibration system are associated with longer reverberation time between the system boundaries and consequently lower resonant frequency.
We demonstrate that both the mass-spring and the transmission line methods provide strategies to guide the matching layer design for the high-frequency ultrasonic transducers. These metal-polymer matching layer designs overcame the limitations of the traditional matching methods for developing high frequency applications. Despite the independency of the mass-spring and the transmission line methods, their results are in agreement with each other. The performance of the matching layer was verified by an ultrasonic transducer with 100 MHz center frequency. Depositing the parylene and the gold layers significantly enhanced the performance by 84.4% on the echo amplitude (68.6% enhancement on peak-to-peak amplitude) and increased the −6 dB bandwidth from 30.2% to 58.3%. Thus, the metal-polymer matching layer design provides insights into developing an effective matching strategy for high-frequency transducers.
Acknowledgments
This work was supported by the National Institutes of Health (Grant No. P41-EB002182), Heart, Lung, and Blood Institute (Grant No. 1R01HL118650), Fundamental Research Funds for the Central Universities (Grant No. 2012202020203), and Chinese Scholarship Council.
References
- 1. Khuri-Yakub B. T., Ultrasonics 31, 361 (1993). 10.1016/0041-624X(93)90070-G [DOI] [Google Scholar]
- 2. Lam K. H., Hsu H. S., Li Y., Lee C. Y., Lin A., Zhou Q. F., Kim E. S., and Shung K. K., Biotechnol. Bioeng. 110, 881 (2013). 10.1002/bit.24735 [DOI] [PMC free article] [PubMed] [Google Scholar]
- 3. Lee J. W., Lee C. Y., Kim H. H., Jakob A., Lemor R., Teh S. Y., Lee A., and Shung K. K., Biotechnol. Bioeng. 108, 1643 (2011). 10.1002/bit.23073 [DOI] [PMC free article] [PubMed] [Google Scholar]
- 4. Zhou Q. F., Lau S. T., Wu D. W., and Shung K. K., Prog. Mater. Sci. 56, 139 (2011). 10.1016/j.pmatsci.2010.09.001 [DOI] [PMC free article] [PubMed] [Google Scholar]
- 5. Lockwood G. R., Turnbull D. H., Christopher D. A., and Foster F. S., IEEE Eng. Med. Biol. 15, 60 (1996). 10.1109/51.544513 [DOI] [Google Scholar]
- 6. Desilets C. S., Fraser J. D., and Kino G. S., IEEE Trans. Sonics Ultrason. 25, 115 (1978). 10.1109/T-SU.1978.31001 [DOI] [Google Scholar]
- 7. Hsu H. S., Zheng F., Li Y., Lee C. Y., Zhou Q. F., and Shung K. K., Appl. Phys. Lett. 101, 024105 (2012). 10.1063/1.4736731 [DOI] [PMC free article] [PubMed] [Google Scholar]
- 8. Cannata J. M., Williams J. A., Zhou Q., Ritter T. A., and Shung K. K., IEEE Trans. Ultrason., Ferroelectr., Freq. Control 53, 224 (2006). 10.1109/TUFFC.2006.1588408 [DOI] [PubMed] [Google Scholar]
- 9. Bezanson A., Adamson R., Bance M., and Brown J. A., IEEE Trans. Ultrason., Ferroelectr., Freq. Control 61, 33 (2014). 10.1109/TUFFC.2014.6689774 [DOI] [PubMed] [Google Scholar]
- 10. Toda M. and Thompson M., IEEE Trans. Ultrason., Ferroelectr., Freq. Control 57, 2818 (2010). 10.1109/TUFFC.2010.1755 [DOI] [PubMed] [Google Scholar]
- 11. Toda M. and Thompson M., IEEE Trans. Ultrason., Ferroelectr., Freq. Control 59, 231 (2012). 10.1109/TUFFC.2012.2183 [DOI] [PubMed] [Google Scholar]
- 12. Brown J. A., Sharma S., Leadbetter J., Cochran S., and Adamson R., IEEE Trans. Ultrason., Ferroelectr., Freq. Control 61, 1911 (2014). 10.1109/TUFFC.2014.006480 [DOI] [PubMed] [Google Scholar]
- 13. Steer M. B., Microwave and RF Design: A Systems Approach, 2nd ed. ( SciTech Pub., 2013). [Google Scholar]
- 14. Ma J. G., Steer M. B., and Jiang X. N., Appl. Phys. Lett. 106, 111903 (2015). 10.1063/1.4915100 [DOI] [PMC free article] [PubMed] [Google Scholar]
- 15. Krimholtz R., Leedom D. A., and Matthaei G. L., Electron. Lett. 6(13), 398–399 (1970). 10.1049/el:19700280 [DOI] [Google Scholar]
- 16. Smith P., Electronic Applications of the Smith Chart ( The Institution of Engineering and Technology, 1995). [Google Scholar]
- 17. Cannata J. M., Ritter T. A., Chen W. H., Silverman R. H., and Shung K. K., IEEE Trans. Ultrason., Ferroelectr., Freq. Control 50, 1548 (2003). 10.1109/TUFFC.2003.1251138 [DOI] [PubMed] [Google Scholar]