

Abstract
Background
Genetic diversity is the main source of variability in any crop improvement program. It serves as a reservoir for identifying superior alleles controlling key agronomic and quality traits through allele mining/association mapping. Association mapping based on LD (Linkage dis-equilibrium), non-random associations between causative loci and phenotype in natural population is highly useful in dissecting out genetic basis of complex traits. For any successful association mapping program, understanding the population structure and assessing the kinship relatedness is essential before making correlation between superior alleles and traits. The present study was aimed at evaluating the genetic variation and population structure in a collection of 192 rice germplasm lines including local landraces, improved varieties and exotic lines from diverse origin.
Results
A set of 192 diverse rice germplasm lines were genotyped using 61 genome wide SSR markers to assess the molecular genetic diversity and genetic relatedness. Genotyping of 192 rice lines using 61 SSRs produced a total of 205 alleles with the PIC value of 0.756. Population structure analysis using model based and distance based approaches revealed that the germplasm lines were grouped into two distinct subgroups. AMOVA analysis has explained that 14 % of variation was due to difference between with the remaining 86 % variation may be attributed by difference within groups.
Conclusions
Based on these above analysis viz., population structure and genetic relatedness, a core collection of 150 rice germplasm lines were assembled as an association mapping panel for establishing marker trait associations.
Electronic supplementary material
The online version of this article (doi:10.1186/s12284-015-0062-5) contains supplementary material, which is available to authorized users.
Keywords: Rice, Genetic diversity, Population structure, Polymorphism information content, Molecular variance, Association mapping
Background
Rice, being the staple food crop for more than 50 % of the world population is cultivated in 163 million hectares with the production of 491 million tonnes. About 90 % of the world’s rice is produced in Asia and India contributes 20 % of the world’s production. This record level production and productivity is due to the availability and exploitation of rich genetic diversity existing in rice germplasm of India. For precise genetic manipulation of complex quantitative traits like, yield, tolerance against biotic/abiotic stresses, quality etc., understanding the genetic/molecular basis of target traits needs to be investigated thoroughly.
The genetic basis of important agronomic traits has been unraveled through Quantitative Trait Loci (QTL) mapping either through linkage mapping (bi-parental mapping populations) or through LD mapping (natural populations). Although traditional linkage based QTL-mapping has become an important tool in gene tagging of crops, it has few limitations viz., 1) classical linkage mapping involves very high cost; 2) it has low resolution as it can resolve only a few alleles and 3) it has limitations towards fine mapping of QTLs as it needs BC-NILs. These limitations can be overcome by the LD based approach of “Association Mapping” using the natural populations. Association mapping serves as a tool to mine the elite genes by structuring the natural variation present in a germplasm. It was successfully exploited in various crops such as rice, maize, barley, durum wheat, spring wheat, sorghum, sugarcane, sugarbeet, soybean, grape, forest tree species and forage grasses (Abdurakhmonov and Abdukarimov 2008).
Before performing an association analysis in a population, it is essential to determine the population structure which can reduce type I and II errors in association mapping due to unequal allele frequency distribution between subgroups that causes spurious association between molecular markers and trait of interest (Pritchard et al. 2000). Similar attempts were recently undertaken to define population structure in rice using different germplasm lines and by developing core collection from national collections and international collections (Ebana et al. 2008; Jin et al. 2010; Zhang et al. 2011; Agrama et al. 2010 and Liakat Ali et al. 2011). Simple Sequence repeat (SSR) markers have been commonly used in genetic diversity studies in rice because of high level of polymorphism which helps to establish the relationship among the individuals even with less number of markers (McCouch et al. 1997). For similar studies, SSR markers were used alone by Jin et al. (2010); Hesham et al. (2008); Sow et al. (2014); Das et al. (2013) and Choudhury et al. (2013) or along with SNP markers by Courtois et al. (2012) and Zhao et al. (2011). The objectives of this present study were to evaluate the genetic variation and to examine the population structure of 192 rice germplasm accessions that comprises of local landraces, improved varieties and exotic lines from diverse origin.
Results
Genetic Diversity
All the 192 rice germplasm lines were genotyped using 61 SSR (microsatellite) markers which produced a total of 205 alleles (Additional file 1: Figure S1). Among these 205 alleles, 5 % were considered as rare (showed an allele frequency of < 5 %). The number of alleles per loci varied from 2 to 7 with an average of 3 alleles per locus. The highest number of alleles were detected for the loci RM316 (7) and the lowest was detected for a group of markers viz., RM171, RM284, RM455, RM514, RM277, RM 5795, HvSSR0247, RM 559, RM416 and RM1227. PIC value represents the relative informativeness of each marker and in the present study, the average PIC value was found to be 0.468. The highest genetic diversity is explained by the landraces included in this study with the mean PIC value of 0.416. PIC values ranged between 0.146 for RM17616 to 0.756 for RM316. Heterozygosity was found to be very low which may be due to autogamous nature of rice. Expected heterozygosity or Gene diversity (He) computed according to Nei (1973) varied from 0.16 (RM17616) to 0.75 (RM287) with the average of 0.52 (Table 1).
Table 1.
Details of SSR loci used for genotyping in the 192 rice accessions and their genetic diversity parameters
| S. no | Marker | Chromosome no. | SSR MOTIF | Min molecular weight | Maximum molecular weight | Number of alleles | Gene diversity | Heterozygosity | PIC value |
|---|---|---|---|---|---|---|---|---|---|
| 1 | RM237 | 1 | (CT)18 | 110 | 143 | 4 | 0.61 | 0.89 | 0.545 |
| 2 | RM1 | 1 | (GA)26 | 70 | 105 | 3 | 0.63 | 0.12 | 0.552 |
| 3 | RM5 | 1 | (GA)14 | 105 | 115 | 3 | 0.64 | 0.6 | 0.557 |
| 4 | RM312 | 1 | (ATTT)4(GT)9 | 95 | 105 | 3 | 0.3 | 0.03 | 0.281 |
| 5 | RM283 | 1 | (GA)18 | 149 | 155 | 3 | 0.42 | 0.02 | 0.377 |
| 6 | RM452 | 2 | (GTC)9 | 195 | 245 | 3 | 0.54 | 0.83 | 0.448 |
| 7 | HvSSR0247 | 2 | 395 | 400 | 2 | 0.5 | 0.18 | 0.373 | |
| 8 | RM555 | 2 | (AG)11 | 135 | 145 | 3 | 0.59 | 0.04 | 0.517 |
| 9 | RM211 | 2 | (TC)3A(TC)18 | 140 | 160 | 3 | 0.52 | 0.08 | 0.463 |
| 10 | RM324 | 2 | (CAT)21 | 135 | 180 | 5 | 0.74 | 0.06 | 0.695 |
| 11 | RM514 | 3 | (AC)12 | 245 | 252 | 2 | 0.19 | 0 | 0.171 |
| 12 | RM55 | 3 | (GA)17 | 220 | 225 | 3 | 0.44 | 0.07 | 0.4 |
| 13 | RM231 | 3 | (CT)16 | 170 | 200 | 3 | 0.59 | 0.12 | 0.511 |
| 14 | RM416 | 3 | (GA)9 | 110 | 115 | 2 | 0.42 | 0.01 | 0.335 |
| 15 | RM442 | 3 | (AAG)10 | 260 | 275 | 3 | 0.5 | 0.03 | 0.448 |
| 16 | RM 16643 | 4 | (GGGA)5 | 165 | 200 | 5 | 0.73 | 0.05 | 0.685 |
| 17 | RM 559 | 4 | (AACA)6 | 160 | 165 | 2 | 0.39 | 0.01 | 0.311 |
| 18 | RM17377 | 4 | (AG)25 | 140 | 175 | 4 | 0.67 | 0.04 | 0.625 |
| 19 | RM7585 | 4 | (TCTT)6 | 140 | 160 | 4 | 0.46 | 0.02 | 0.422 |
| 20 | RM17616 | 4 | (TC)14 | 165 | 180 | 3 | 0.16 | 0 | 0.146 |
| 21 | RM413 | 5 | (AG)11 | 75 | 100 | 4 | 0.59 | 0.25 | 0.548 |
| 22 | RM178 | 5 | (GA)5(AG)8 | 110 | 115 | 3 | 0.39 | 0.04 | 0.35 |
| 23 | RM 161 | 5 | (AG)20 | 160 | 180 | 3 | 0.29 | 0.04 | 0.258 |
| 24 | RM7293 | 5 | (ATGT)6 | 140 | 150 | 3 | 0.64 | 0.1 | 0.558 |
| 25 | RM1024 | 5 | (AC)13 | 125 | 140 | 3 | 0.32 | 0.02 | 0.298 |
| 26 | RM 162 | 6 | (AC)20 | 220 | 240 | 3 | 0.37 | 0.03 | 0.34 |
| 27 | RM7434 | 6 | (GTAT)10 | 120 | 145 | 5 | 0.66 | 0.19 | 0.614 |
| 28 | RM19620 | 6 | (GTG)7 | 160 | 177 | 3 | 0.21 | 0.03 | 0.204 |
| 29 | RM5963 | 6 | (CAG)9 | 160 | 175 | 3 | 0.48 | 0.15 | 0.38 |
| 30 | RM11 | 7 | (GA)17 | 120 | 150 | 4 | 0.71 | 0.72 | 0.661 |
| 31 | RM118 | 7 | (GA)8 | 155 | 185 | 4 | 0.62 | 0.77 | 0.543 |
| 32 | RM125 | 7 | (GCT)8 | 105 | 130 | 4 | 0.61 | 0.89 | 0.544 |
| 33 | RM455 | 7 | (TTCT)5 | 130 | 135 | 2 | 0.24 | 0.02 | 0.208 |
| 34 | HvSSR0740 | 7 | 340 | 400 | 4 | 0.7 | 0.21 | 0.65 | |
| 35 | RM44 | 8 | (GA)16 | 95 | 107 | 4 | 0.62 | 0.77 | 0.559 |
| 36 | RM433 | 8 | (AG)13 | 235 | 270 | 3 | 0.55 | 0.81 | 0.446 |
| 37 | RM447 | 8 | (CTT)8 | 105 | 120 | 4 | 0.64 | 0.16 | 0.572 |
| 38 | RM284 | 8 | (GA)8 | 140 | 145 | 2 | 0.21 | 0.02 | 0.189 |
| 39 | RM408 | 8 | (CT)13 | 120 | 125 | 3 | 0.52 | 0.01 | 0.465 |
| 40 | RM25 | 8 | (GA)18 | 120 | 140 | 4 | 0.73 | 0.37 | 0.679 |
| 41 | RM256 | 8 | (CT)21 | 125 | 140 | 4 | 0.73 | 0 | 0.681 |
| 42 | RM105 | 9 | (CCT)6 | 100 | 140 | 3 | 0.41 | 0.48 | 0.37 |
| 43 | RM107 | 9 | (GA)7 | 280 | 300 | 3 | 0.48 | 0 | 0.425 |
| 44 | RM 215 | 9 | (CT)16 | 140 | 150 | 3 | 0.6 | 0.01 | 0.528 |
| 45 | RM 316 | 9 | (GT)8-(TG)9(TTTG)4(TG)4 | 160 | 235 | 7 | 0.79 | 0.75 | 0.756 |
| 46 | RM205 | 9 | (CT)25 | 110 | 140 | 4 | 0.72 | 0 | 0.665 |
| 47 | RM171 | 10 | (GATG)5 | 320 | 330 | 2 | 0.24 | 0.02 | 0.211 |
| 48 | RM271 | 10 | (GA)15 | 90 | 99 | 3 | 0.66 | 0.19 | 0.588 |
| 49 | RM590 | 10 | (TCT)10 | 120 | 140 | 4 | 0.57 | 0.04 | 0.516 |
| 50 | RM474 | 10 | (AT)13 | 240 | 280 | 3 | 0.61 | 0 | 0.537 |
| 51 | RM222 | 10 | (CT)18 | 200 | 220 | 3 | 0.63 | 0.02 | 0.557 |
| 52 | RM144 | 11 | (ATT)11 | 160 | 240 | 5 | 0.69 | 0.18 | 0.644 |
| 53 | RM287 | 11 | (GA)21 | 95 | 110 | 5 | 0.75 | 0.2 | 0.706 |
| 54 | RM 536 | 11 | (CT)16 | 240 | 270 | 5 | 0.74 | 0.06 | 0.701 |
| 55 | RM224 | 11 | (AAG)8(AG)13 | 120 | 155 | 5 | 0.65 | 0.07 | 0.617 |
| 56 | RM206 | 11 | (CT)21 | 130 | 145 | 4 | 0.34 | 0 | 0.319 |
| 57 | RM277 | 12 | (GA)11 | 115 | 120 | 2 | 0.45 | 0.08 | 0.35 |
| 58 | RM 5795 | 12 | (AGC)8 | 140 | 145 | 2 | 0.5 | 0.03 | 0.374 |
| 59 | RM1227 | 12 | (AG)15 | 160 | 180 | 2 | 0.31 | 0.02 | 0.262 |
| 60 | RM20A | 12 | (ATT)14 | 220 | 240 | 3 | 0.54 | 0 | 0.476 |
| 61 | RM2197 | 12 | (AT)23 | 135 | 140 | 2 | 0.44 | 0 | 0.341 |
| Average | 3 | 0.52 | 0.18 | 0.468 |
STRUCTURE Analysis
Population structure of the 192 germplasm lines was analysed by Bayesian based approach. The estimated membership fractions of 192 accessions for different values of k ranged between 2 and 5 (Fig. 1). The log likelihood revealed by structure showed the optimum value as 2 (K = 2). Similarly the maximum of adhoc measure ΔK was found to be K = 2 (Fig. 2), which indicated that the entire population can be grouped into two subgroups (SG1 and SG2). Based on the membership fractions, the accessions with the probability of ≥ 80 % were assigned to corresponding subgroups with others categorized as admixture (Fig. 3).
Fig. 1.
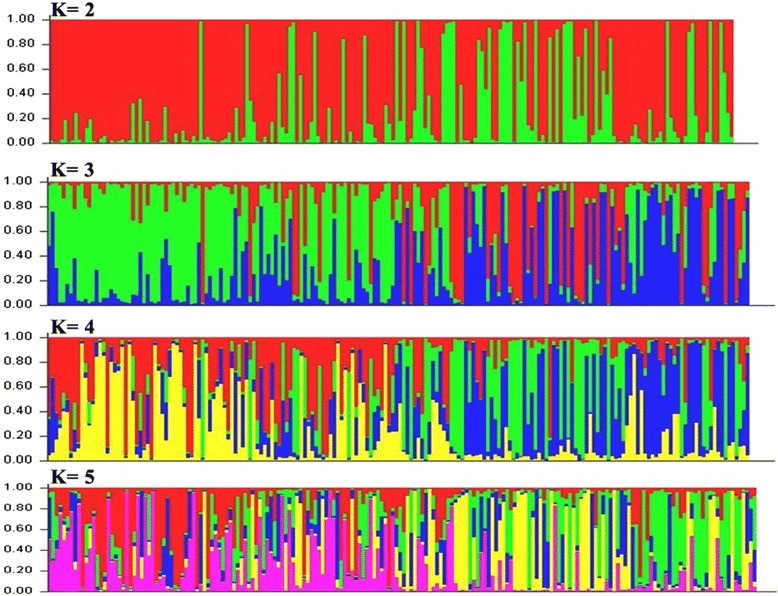
Pattern of variation of 192 accessions based on 61 SSR markers. The K values are based on the run with highest likelihood. Bar length represent the membership probability of accessions belonging to different subgroups
Fig. 2.
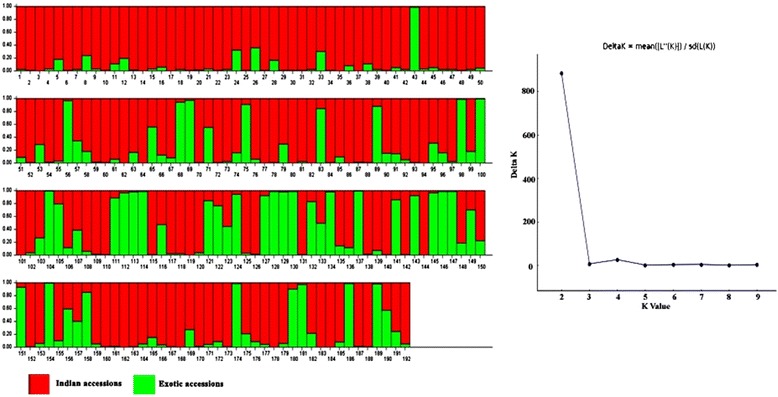
Population structure of 192 accessions based on 61 SSR markers (K = 2) and Graph of estimated membership fraction for K = 2. The maximum of adhoc measure ΔK determined by structure harvester was found to be K = 2, which indicated that the entire population can be grouped into two subgroups (SG1 and SG2)
Fig. 3.
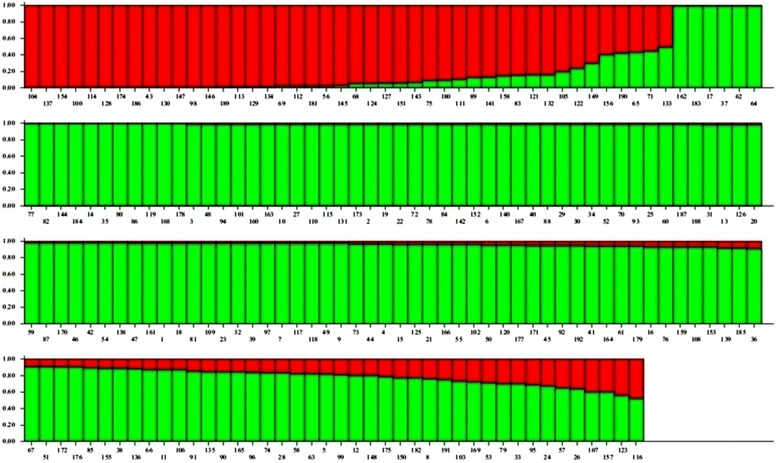
Population structure of 192 accessions arranged based on inferred ancestry. Based on the membership fractions, the accessions with the probability of ≥ 80 % were assigned to corresponding subgroups with others categorized as admixture
SG1 consisted of 134 accessions with most of the landraces and varieties of Indian origin and SG2 consisted of 38 accessions which composed of non Indian accessions. Twenty accessions were retained to be admixture. The subgroup SG1 was dominated by indica subtype whereas the subgroup SG2 consisted mostly of japonica group. When the number of subgroups increased from two to five, the accessions in both the subgroups were classified into sub-sub groups (Table 2). As SG1 consisted of 134 accessions mostly of Indian origin, an independent STRUCTURE analysis was performed for this subgroup. ΔK showed its maximum value for K =3 which indicated that SG1 could be further classified into three sub-sub groups (Fig. 4). The differentiation in origin and seasonal differentiation of rice varieties contributed for this clustering.
Table 2.
Population structure group of accessions based on Inferred ancestry values
| G. no. | Genotypes | Inferred ancestry | Structure group | Subtype | |
|---|---|---|---|---|---|
| Q1 | Q2 | ||||
| RG1 | Mapillai samba | 0.977 | 0.023 | SG1 | Indica |
| RG2 | CK 275 | 0.991 | 0.009 | SG1 | Indica |
| RG3 | Senkar | 0.992 | 0.008 | SG1 | Indica |
| RG4 | Murugankar | 0.964 | 0.036 | SG1 | Indica |
| RG5 | CHIR 6 | 0.811 | 0.189 | SG1 | Indica |
| RG6 | CHIR 5 | 0.989 | 0.011 | SG1 | Indica |
| RG7 | Kudai vazhai | 0.975 | 0.025 | SG1 | Indica |
| RG8 | CHIR 8 | 0.759 | 0.241 | SG1 | Indica |
| RG9 | Kuruvai kalanjiyam | 0.971 | 0.029 | SG1 | Indica |
| RG10 | Nava konmani | 0.99 | 0.01 | SG1 | Indica |
| RG11 | CHIR 10 | 0.869 | 0.131 | SG1 | Indica |
| RG12 | Vellai chithiraikar | 0.802 | 0.198 | SG1 | Indica |
| RG13 | CHIR 2 | 0.983 | 0.017 | SG1 | Indica |
| RG14 | Jothi | 0.992 | 0.008 | SG1 | indica |
| RG15 | Palkachaka | 0.962 | 0.038 | SG1 | indica |
| RG16 | Thooyala | 0.934 | 0.066 | SG1 | indica |
| RG17 | Chivapu chithiraikar | 0.994 | 0.006 | SG1 | indica |
| RG18 | CHIR 11 | 0.976 | 0.024 | SG1 | indica |
| RG19 | Koolavalai | 0.99 | 0.01 | SG1 | indica |
| RG20 | Kalvalai | 0.982 | 0.018 | SG1 | indica |
| RG21 | Mohini samba | 0.963 | 0.037 | SG1 | indica |
| RG22 | IR 36 | 0.989 | 0.011 | SG1 | indica |
| RG23 | Koombalai | 0.975 | 0.025 | SG1 | indica |
| RG24 | Tadukan | 0.674 | 0.326 | AD | indica |
| RG25 | Sorna kuruvai | 0.986 | 0.014 | SG1 | indica |
| RG26 | Rascadam | 0.637 | 0.363 | AD | indica |
| RG27 | Muzhi karuppan | 0.991 | 0.009 | SG1 | indica |
| RG28 | Kaatukuthalam | 0.828 | 0.172 | SG1 | indica |
| RG29 | Vellaikattai | 0.987 | 0.013 | SG1 | indica |
| RG30 | Poongar | 0.987 | 0.013 | SG1 | indica |
| RG31 | Chinthamani | 0.985 | 0.015 | SG1 | indica |
| RG32 | Thogai samba | 0.975 | 0.025 | SG1 | indica |
| RG33 | Malayalathan samba | 0.701 | 0.299 | AD | indica |
| RG34 | RPHP 125 | 0.986 | 0.014 | SG1 | indica |
| RG35 | CK 143 | 0.993 | 0.007 | SG1 | indica |
| RG36 | Kattikar | 0.913 | 0.087 | SG1 | indica |
| RG37 | Shenmolagai | 0.994 | 0.006 | SG1 | indica |
| RG38 | Velli samba | 0.887 | 0.113 | SG1 | indica |
| RG39 | Kaatu ponni | 0.975 | 0.025 | SG1 | indica |
| RG40 | kakarathan | 0.989 | 0.011 | SG1 | indica |
| RG41 | Godavari samba | 0.941 | 0.059 | SG1 | indica |
| RG42 | Earapalli samba | 0.978 | 0.022 | SG1 | indica |
| RG43 | RPHP 129 | 0.01 | 0.99 | SG2 | indica |
| RG44 | Mangam samba | 0.968 | 0.032 | SG1 | indica |
| RG45 | RPHP 105 | 0.943 | 0.057 | SG1 | indica |
| RG46 | IG 4(EC 729639- 121695) | 0.977 | 0.023 | SG1 | indica |
| RG47 | Machakantha | 0.976 | 0.024 | SG1 | indica |
| RG48 | Kalarkar | 0.992 | 0.008 | SG1 | indica |
| RG49 | Valanchennai | 0.972 | 0.028 | SG1 | indica |
| RG50 | Sornavari | 0.957 | 0.043 | SG1 | indica |
| RG51 | RPHP 134 | 0.909 | 0.091 | SG1 | indica |
| RG52 | ARB 58 | 0.987 | 0.013 | SG1 | indica |
| RG53 | IR 68144-2B-2-2-3-1-127 | 0.708 | 0.292 | AD | indica |
| RG54 | PTB 19 | 0.981 | 0.019 | SG1 | indica |
| RG55 | IG 67(EC 729050- 120988) | 0.957 | 0.043 | SG1 | indica |
| RG56 | RPHP 59 | 0.031 | 0.969 | SG2 | Aromatic |
| RG57 | RPHP 103 | 0.656 | 0.344 | AD | Aromatic |
| RG58 | Kodaikuluthan | 0.828 | 0.172 | SG1 | indica |
| RG59 | RPHP 68 | 0.981 | 0.019 | SG1 | indica |
| RG60 | Rama kuruvaikar | 0.985 | 0.015 | SG1 | indica |
| RG61 | Kallundai | 0.939 | 0.061 | SG1 | indica |
| RG62 | Purple puttu | 0.994 | 0.006 | SG1 | indica |
| RG63 | IG 71(EC 728651- 117588) | 0.823 | 0.177 | SG1 | aus |
| RG64 | Ottadaiyan | 0.994 | 0.006 | SG1 | indica |
| RG65 | IG 56(EC 728700- 117658 | 0.435 | 0.565 | AD | Aromatic |
| RG66 | Jeevan samba | 0.876 | 0.124 | SG1 | indica |
| RG67 | RPHP 106 | 0.915 | 0.085 | SG1 | indica |
| RG68 | IG 63(EC 728711- 117674) | 0.049 | 0.951 | SG2 | Tropical Japonica |
| RG69 | RPHP 48 | 0.025 | 0.975 | SG2 | Aromatic |
| RG70 | Karthi samba | 0.987 | 0.013 | SG1 | indica |
| RG71 | IG 27(IC 0590934- 121255) | 0.444 | 0.556 | AD | indica |
| RG72 | Aarkadu kichili | 0.99 | 0.01 | SG1 | indica |
| RG73 | Kunthali | 0.969 | 0.031 | SG1 | indica |
| RG74 | ARB 65 | 0.83 | 0.17 | SG1 | indica |
| RG75 | IG 21(EC 729334- 121355) | 0.091 | 0.909 | SG2 | japonica |
| RG76 | Matta kuruvai | 0.934 | 0.066 | SG1 | indica |
| RG77 | Karuthakar | 0.994 | 0.006 | SG1 | indica |
| RG78 | RPHP 165 | 0.99 | 0.01 | SG1 | indica |
| RG79 | Manavari | 0.704 | 0.296 | AD | indica |
| RG80 | IG 66(EC 729047- 120985) | 0.992 | 0.008 | SG1 | indica |
| RG81 | CB-07-701-252 | 0.977 | 0.023 | SG1 | indica |
| RG82 | Thooyamalli | 0.994 | 0.006 | SG1 | indica |
| RG83 | RPHP 93 | 0.153 | 0.847 | SG2 | indica |
| RG84 | Velsamba | 0.99 | 0.01 | SG1 | indica |
| RG85 | RPHP 104 | 0.898 | 0.102 | SG1 | indica |
| RG86 | RPHP 102 | 0.993 | 0.007 | SG1 | indica |
| RG87 | IG 40(EC 728740- 117705) | 0.98 | 0.02 | SG1 | indica |
| RG88 | Saranga | 0.988 | 0.012 | SG1 | indica |
| RG89 | IR 83294-66-2-2-3-2 | 0.125 | 0.875 | SG2 | japonica |
| RG90 | IG 61(EC 728731- 117696) | 0.843 | 0.157 | SG1 | indica |
| RG91 | IG 23(EC 729391- 121419) | 0.852 | 0.148 | SG1 | Aus |
| RG92 | IG 49(EC 729102- 121052) | 0.945 | 0.055 | SG1 | indica |
| RG93 | uppumolagai | 0.987 | 0.013 | SG1 | indica |
| RG94 | Karthigai samba | 0.993 | 0.007 | SG1 | indica |
| RG95 | Jeeraga samba | 0.685 | 0.315 | SG1 | indica |
| RG96 | RP-BIO-226 | 0.833 | 0.167 | SG1 | indica |
| RG97 | Varigarudan samba | 0.975 | 0.025 | SG1 | indica |
| RG98 | IG 5(EC 729642- 121698) | 0.012 | 0.988 | SG2 | japonica |
| RG99 | IG 31(EC 728844- 117829) | 0.813 | 0.187 | SG1 | indica |
| RG100 | IG 7(EC 729598- 121648) | 0.008 | 0.992 | SG2 | japonica |
| RG101 | RPHP 52 | 0.991 | 0.009 | SG1 | indica |
| RG102 | Varakkal | 0.958 | 0.042 | SG1 | indica |
| RG103 | Mattaikar | 0.732 | 0.268 | AD | indica |
| RG104 | IG 53(EC 728752- 117719) | 0.005 | 0.995 | SG2 | Temperate japonica |
| RG105 | IG 6(EC 729592- 121642) | 0.204 | 0.796 | SG2 | Temperate japonica |
| RG106 | Katta samba | 0.872 | 0.128 | SG1 | indica |
| RG107 | RH2-SM-1-2-1 | 0.606 | 0.394 | AD | indica |
| RG108 | Red sirumani | 0.93 | 0.07 | SG1 | indica |
| RG109 | Vadivel | 0.977 | 0.023 | SG1 | indica |
| RG110 | Norungan | 0.991 | 0.009 | SG1 | indica |
| RG111 | IG 20(EC 729293- 121310) | 0.113 | 0.887 | SG2 | indica |
| RG112 | IG 35(EC 728858- 117843) | 0.027 | 0.973 | SG2 | japonica |
| RG113 | IG 45(EC 728768- 117736) | 0.017 | 0.983 | SG2 | japonica |
| RG114 | RPHP 159 | 0.008 | 0.992 | SG2 | aromatic rice |
| RG115 | IG 43(EC 728788- 117759) | 0.992 | 0.008 | SG1 | indica |
| RG116 | RPHP 27 | 0.52 | 0.48 | AD | Tropical Japonica |
| RG117 | IG 65(EC 729024- 120958) | 0.974 | 0.026 | SG1 | indica |
| RG118 | Ponmani samba | 0.973 | 0.027 | SG1 | indica |
| RG119 | Ganthasala | 0.993 | 0.007 | SG1 | indica |
| RG120 | Thattan samba | 0.949 | 0.051 | SG1 | indica |
| RG121 | IG 74(EC 728622- 117517) | 0.16 | 0.84 | SG2 | japonica |
| RG122 | Kaliyan samba | 0.245 | 0.755 | AD | indica |
| RG123 | IG 2(EC 729808-121874) | 0.56 | 0.44 | AD | japonica |
| RG124 | IG 29(EC 728925- 117920) | 0.059 | 0.941 | SG2 | Tropical Japonica |
| RG125 | RPHP 55 | 0.963 | 0.037 | SG1 | indica |
| RG126 | Kallimadayan | 0.984 | 0.016 | SG1 | indica |
| RG127 | IG 10(EC 729686- 121743) | 0.066 | 0.934 | SG2 | aromatic |
| RG128 | IG 75(EC 728587- 117420) | 0.008 | 0.992 | SG2 | japonica |
| RG129 | IG 38(EC 728742 - 117707) | 0.02 | 0.98 | SG2 | Tropical japonica |
| RG130 | IG 39(EC 728779- 117750) | 0.012 | 0.988 | SG2 | indica |
| RG131 | RPHP 90 | 0.991 | 0.009 | SG1 | indica |
| RG132 | IG 33(EC 728938- 117935) | 0.162 | 0.838 | SG2 | Tropical Japonica |
| RG133 | IG 42(EC 728798- 117774) | 0.495 | 0.505 | AD | indica |
| RG134 | IG 9(EC 729682- 121739) | 0.019 | 0.981 | SG2 | indica |
| RG135 | RPHP 161 | 0.849 | 0.151 | SG1 | indica |
| RG136 | IG 8(EC 729601- 121651) | 0.883 | 0.117 | SG1 | indica |
| RG137 | IG 37(EC 728715- 117678) | 0.005 | 0.995 | SG2 | Tropical Japonica |
| RG138 | Sigappu kuruvikar | 0.979 | 0.021 | SG1 | indica |
| RG139 | RPHP 138 | 0.917 | 0.083 | SG1 | indica |
| RG140 | Raja mannar | 0.989 | 0.011 | SG1 | indica |
| RG141 | IG 44(EC 728762- 117729) | 0.134 | 0.866 | SG2 | indica |
| RG142 | Sasyasree | 0.989 | 0.011 | SG1 | indica |
| RG143 | IG 46(IC 471826- 117647) | 0.073 | 0.927 | SG2 | indica |
| RG144 | Chetty samba | 0.993 | 0.007 | SG1 | indica |
| RG145 | IG 60(EC 728730- 117695) | 0.033 | 0.967 | SG2 | indica |
| RG146 | IR 75862-206 | 0.013 | 0.987 | SG2 | Tropical Japonica |
| RG147 | IG 58(EC 728725- 117689) | 0.011 | 0.989 | SG2 | japonica |
| RG148 | Chinna aduku nel | 0.798 | 0.202 | SG1 | indica |
| RG149 | RH2-SM-2-23 | 0.296 | 0.704 | AD | indica |
| RG150 | IG 14(IC 517381- 121422) | 0.775 | 0.225 | AD | indica |
| RG151 | IG 32(EC 728838- 117823) | 0.065 | 0.935 | SG2 | japonica |
| RG152 | RPHP 47 | 0.989 | 0.011 | SG1 | indica |
| RG153 | Sembilipiriyan | 0.933 | 0.067 | SG1 | indica |
| RG154 | IG 48(EC 729203- 121195) | 0.006 | 0.994 | SG2 | indica |
| RG155 | Sona mahsuri | 0.889 | 0.111 | SG1 | indica |
| RG156 | IG 12(EC 729626- 121681) | 0.405 | 0.595 | AD | indica |
| RG157 | Karungan | 0.602 | 0.398 | AD | indica |
| RG158 | IG 13(EC 729640- 121696) | 0.143 | 0.857 | SG2 | indica |
| RG159 | Sembala | 0.934 | 0.066 | SG1 | indica |
| RG160 | IG 72(EC 728650- 117587) | 0.992 | 0.008 | SG1 | indica |
| RG161 | Panamarasamba | 0.978 | 0.022 | SG1 | indica |
| RG162 | IR 64 | 0.995 | 0.005 | SG1 | indica |
| RG163 | Mikuruvai | 0.992 | 0.008 | SG1 | indica |
| RG164 | Thillainayagam | 0.939 | 0.061 | SG1 | indica |
| RG165 | ARB 64 | 0.843 | 0.157 | SG1 | indica |
| RG166 | RPHP 140 | 0.959 | 0.041 | SG1 | indica |
| RG167 | IG 70(EC 729045- 120983) | 0.989 | 0.011 | SG1 | indica |
| RG168 | Haladichudi | 0.993 | 0.007 | SG1 | indica |
| RG169 | IG 24(EC 728751- 117718) | 0.725 | 0.275 | AD | Aus |
| RG170 | RPHP 42 | 0.981 | 0.019 | SG1 | indica |
| RG171 | RPHP 44 | 0.951 | 0.049 | SG1 | indica |
| RG172 | IG 25(EC 729728- 121785) | 0.903 | 0.097 | SG1 | Tropical Japonica |
| RG173 | IG 73(EC 728627- 117527) | 0.991 | 0.009 | SG1 | indica |
| RG174 | IG 51(EC 728772- 117742) | 0.008 | 0.992 | SG2 | Tropical Japonica |
| RG175 | Vellai kudaivazhai | 0.786 | 0.214 | SG1 | indica |
| RG176 | Kodai | 0.906 | 0.094 | SG1 | indica |
| RG177 | Kallundaikar | 0.951 | 0.049 | SG1 | indica |
| RG178 | IG 17(EC 728900- 117889) | 0.993 | 0.007 | SG1 | indica |
| RG179 | Avasara samba | 0.939 | 0.061 | SG1 | indica |
| RG180 | IG 59(EC 728729- 117694) | 0.093 | 0.907 | SG2 | Tropical Japonica |
| RG181 | IG 52(EC 728756- 117723) | 0.026 | 0.974 | SG2 | Tropical Japonica |
| RG182 | ARB 59 | 0.779 | 0.221 | SG1 | indica |
| RG183 | RPHP 163 | 0.995 | 0.005 | SG1 | indica |
| RG184 | IG 18(EC 728892- 117880) | 0.994 | 0.006 | SG1 | indica |
| RG185 | RPHP 36 | 0.915 | 0.085 | SG1 | indica |
| RG186 | IG 28(EC 728920- 117914) | 0.009 | 0.991 | SG2 | Tropical Japonica |
| RG187 | Vadakathi samba | 0.986 | 0.014 | SG1 | indica |
| RG188 | RPHP 80 | 0.986 | 0.014 | SG1 | indica |
| RG189 | IG 41(EC 728800- 117776) | 0.016 | 0.984 | SG2 | Tropical japonica |
| RG190 | IG 26(IC 0590943- 121899) | 0.422 | 0.578 | SG2 | aromatic |
| RG191 | IG 15(EC 728910- 117901) | 0.755 | 0.245 | AD | indica |
| RG192 | Nootri pathu | 0.943 | 0.057 | SG1 | indica |
Fig. 4.
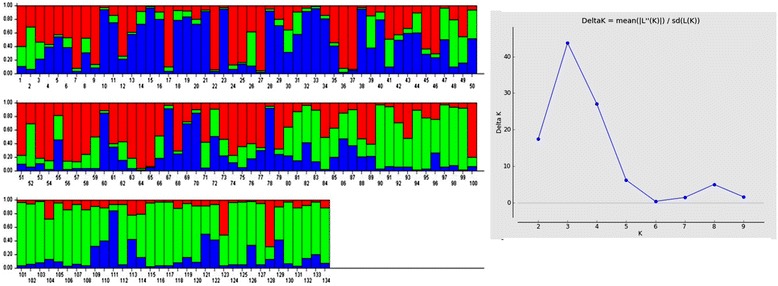
Population structure of 134 accessions in sub group-1 and membership probability of assigning genotypes of sub group-1 (K = 3)
Clustering analysis based on Unweighted Pair Group Method with Arithmetic Mean (UPGMA) method using DARwin separated the accessions into two main groups which showed similar results as STRUCTURE analysis. The group I in UPGMA tree consists of both indigenous and agronomically improved varieties whereas the other group consists of exotic accessions. In UPGMA tree, the accessions within group 1 and 2 clustered into smaller sub groups based on their origin and types. Most of the landraces and varieties have been clustered in upper branches of the tree whereas the exotic accessions have been clustered in lower branches of the tree (Fig 5). Hence the clustering analysis by two classification methods revealed high level of similarity in clustering the genotypes. PCoA was used to characterize the subgroups of the germplasm set. A two- dimensional scatter plot involving all 192 accessions has shown that the first two PCA axes accounted for 12.6 and 4.9 % of the genetic variation among populations (Fig 6).
Fig. 5.
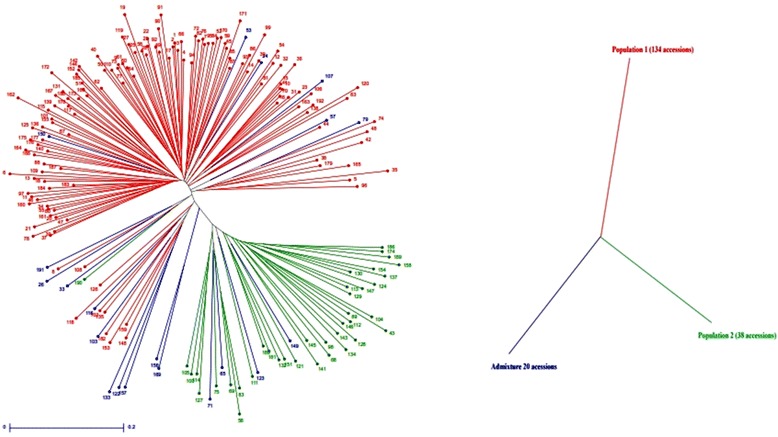
Unrooted neighbour joining tree of 192 rice varieties. The landraces and varieties used in the study has clustered in the upper branches of the tree whereas the exotic accessions has positioned in the lower branches of the tree
Fig. 6.
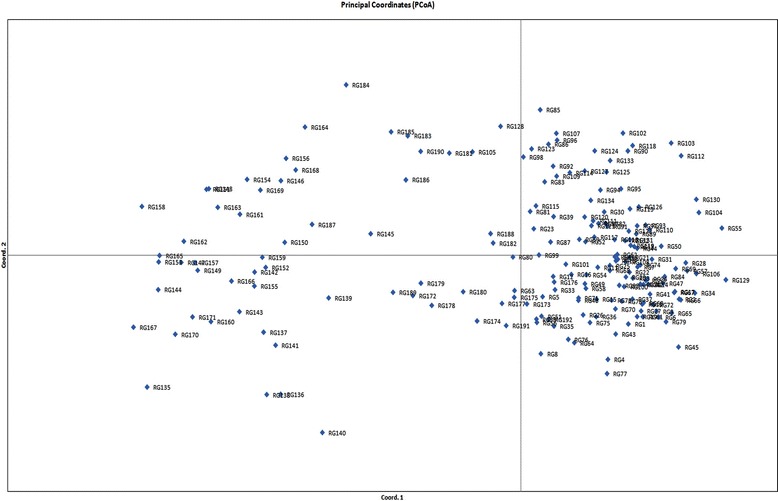
Principal Coordinates of 192 accessions based on 61 SSR loci. Coord 1 and Coord 2 represent first and second coordinates, respectively. The two PCA axes accounted for 12.6 and 4.9 % of the genetic variation among populations
Genetic Variance Analysis
The hierarchial distribution of molecular variance by AMOVA and pair-wise analysis revealed highly significant genetic differentiation among the groups. It revealed that 14 % of the total variation was between the groups, while 86 % was among individuals within groups (Tables 3 and 4). Calculation of Wright’s F statistic at all SSR loci revealed that FIS was 0.50 and FIT was 0.56. Determination of FST for the polymorphic loci across all accessions has shown FST as 0.14 which implies high genetic variation (Table 4). The pairwise FST estimate among sub-groups has indicated that the two groups are significantly different from each other (Table 3).
Table 3.
AMOVA between groups and Pair wise comparison using Fst values (GenAlEx)
| Source | df | SS | MS | Est. var. | Percent |
|---|---|---|---|---|---|
| Among the population | 2 | 971.922 | 485.961 | 9.631 | 14 % |
| Within Pops | 189 | 10961.256 | 57.996 | 57.996 | 86 % |
| Total | 191 | 11933.177 | 67.627 | 100 % | |
| Pairwise population Fst values | |||||
| SG2 | AD | ||||
| SG1 | 0.128 | 0.040 | |||
| SG2 | 0.061 | ||||
Table 4.
AMOVA between groups and accessions and Fixation indices (Arlequin software)
| Source of variation | d.f. | Sum of squares | Variance components | Percentage of variation |
|---|---|---|---|---|
| Among Populations | 2 | 200.013 | 1.01840 Va | 13.82 |
| Among individuals within Populations | 189 | 1794.771 | 3.14391 Vb | 42.65 |
| Within Individuals | 192 | 616 | 3.20833 Vc | 43.53 |
| 383 | 2610.784 | 7.37064 | ||
| Fixation Indices | ||||
| FIS | 0.49493 | |||
| FST | 0.13817 | |||
| FIT | 0.56471 | |||
Discussion
Genetic diversity is the key determinant of germplasm utilization in crop improvement. Population with high level of genetic variation is the valuable resource for broadening the genetic base in any breeding program. The panel of 192 accessions in this study with landraces, varieties as well as breeding lines has different salient agronomic traits. Few landraces included in this study i.e., Mappillai samba (Krishnanunni et al. 2015), Jyothi, Njavara (Deepa et al. 2008), Kavuni (Valarmathi et al. 2015) derived breeding line has therapeutic properties. Many lines included in this study are drought tolerant (Nootripathu, Norungan, Vellaikudaivazhai, kallundaikar, kodai, kalinga 3, Kinandang patong, azucena, mattaikar, IR65907-116-1, karuthakar, mattakuruvai, manavari, kallundai, kodaikulathan, kattikar, poongar, thogai samba, vellaikattai, kattukuthalam, kalvalai, chivapu chithiraikar, vellai chithiraikar, kudaivazhai and murugankar). Few lines have significant level of micronutrients in it (Nachimuthu et al. 2014). This panel has its importance because of its major component as traditional landraces with valuable agronomic traits that are cultivated in the small pockets of Tamil Nadu, India.
Molecular markers help us to understand the level of genetic diversity that exists among traditional races, varieties and exotic accessions which can be exploited in rice breeding programs. The genetic architecture of diverse germplasm lines can be precisely estimated by assessing the STRUCTURE of the population using molecular markers viz., SSRs or SNPs etc., (Horst and Wenzel 2007; Powell et al. 1996; Varshney et al. 2007). In this study, the genetic diversity among the accessions was evaluated by model based clustering and distance based clustering approach using the SSR genotypic data.
Regarding genetic divergence of the population consisting of local landraces, exotic cultivars and breeding lines, 61 polymorphic markers have detected a total of 205 alleles across 192 individuals. The number of alleles varied from 2 to 7 per locus and the average was 3 alleles per locus. Several previous reports have indicated the number of alleles per locus, polymorphic information content and gene diversity of 4.8–14.0, 0.63–0.70 and 6.2–6.8 respectively (Garris et al. 2005; Ram et al. 2007). In the current study, the average number of alleles (3 alleles/locus) is slightly lesser than the average number of alleles (3.88 alleles/ locus) reported by Zhang et al. (2011) in rice core collection with 150 rice varieties from south Asia and Brazil and Jin et al. (2010) who has reported the average alleles per locus as 3.9 in 416 rice accessions collected from China. Using three sets of germplasm lines (Thai (47), IRRI germplasm (53) amd other Oryza species (5)), Chakhonkaen et al. (2012) has reported 127 alleles for all loci, with a mean of 6.68 alleles per locus, and a mean Polymorphic Information Content (PIC) of 0.440 by screening with 19 InDel markers.
Chen et al. (2011) has reported the average gene diversity of 0.358 and polymorphic information content of 0.285 from 300 rice accessions from different rice growing areas of the world with 372 SNP markers. The gene diversity detected in this study (0.52) is comparable to overall gene diversity of rice core collection (0.544) from China, North Korea, Japan, Philippines, Brazil, Celebes, Java, Oceanina and Vietnam (Zhang et al. 2011) and it is higher than US accession panel with average gene diversity of 0.43 (Agrama and Eizenga 2008) and Chinese rice accession panel by Jin et al. (2010) with the average gene diversity of 0.47. The gene diversity reported in our study is lesser than gene diversity (0.68) reported by (Liakat Ali et al. 2011). Most of the diversity panel with global accessions has the gene diversity of 0.5 to 0.7 (Garris et al. 2005; Liakat Ali et al. 2011; Ni et al. 2002). These results on global accessions help to infer that this diversity panel of 192 germplasm lines represents a large proportion of the genetic diversity that exists in major rice growing Asian continent.
The PIC value was 0.468 which varied from 0.146 for RM17616 with only 2 two alleles to 0.756 for RM316 that allowed the amplification of 7 alleles. The PIC value was found to be 0.418 for SG1 which had the majority of indica accessions. The subgroup SG2 dominated by japonica accessions had the PIC value of 0.414. Hence, both the subgroups contribute in a major way for population diversity. As this population encompass different rice materials i.e., landraces, varieties and breeding lines, the molecular diversity is contributed majorly by landraces. These values are similar to those found by Courtois et al. (2012) who reported the PIC value from 0.16 to 0.78 with the average of 0.49 in European rice germplasm collection and in Chinese rice collection of 416 accessions by Jin et al. (2010), who has given similar PIC value of 0.4214. It is also consistent with PIC value (0.48) attained by Zhang et al. (2011). In this study, significant amount of rare alleles was identified which indicates that these rare alleles contribute well to the overall genetic diversity of the population.
Model based approach by STRUCTURE is implemented frequently for studying population structure by various researchers (Agrama et al. 2007, Agrama and Eizenga 2008; Garris et al. 2005; Zhang et al. 2007, 2011; Jin et al. 2010; Liakat Ali et al. 2011, Chakhonkaen et al. 2012 Courtois et al. 2012, Das et al. 2013). Courtois et al. (2012) has successfully detected two subgroups in their study population and assigned rice varieties into two groups with few admixture lines. Jin et al. (2010) has identified seven sub populations among 416 rice accessions from China. Das et al. (2013) has grouped a collection of 91 accessions of rice landraces from eastern and north eastern India into four groups.
Assigning of genotypes to the subgroups based on ancestry threshold vary between different research groups. Zhao et al. (2010) and Courtois et al. (2012) used an ancestry threshold of 80 % to identify accessions belonging to a specific subpopulation. Liakat Ali et al. (2011) has steup the threshold as 60 % and identified 33 accessions as admixtures as the threshold of 80 % consider more genotypes as admixtures. In the current study, a stringent threshold of 80 % ancestry value leaves only 20 genotypes as admixtures.
Population structure analysis in different rice diversity panel has indicated the existence of two to eight sub population in rice (Zhang et al. 2007, Zhang et al. 2009, Zhang et al. 2011, Garris et al. 2005, Agrama et al. 2007, Liakat Ali et al. 2011, Chakhonkaen et al. 2012 and Das et al. 2013). In the current rice diversity panel of 192 accessions based on the criterion of maximum membership probabilities, 134 accessions were assigned to SG1 which is dominated by indica subtype with most of the landraces and varieties of Indian origin and SG2 consisted of 38 accessions which composed mostly of japonica accessions of exotic origin. Similar population structure of two subgroups was observed in previous research by Zhang et al. (2009) in a collection of 3024 rice landraces in China. Zhang et al. (2011) has reported two distinct subgroups in a rice core collection. Courtois et al. (2012) has successfully classified two subgroups as japonica and non japonica accessions in European core collection of rice. The results indicated that two subgroups are due to the different adaptation behavior of accessions to different ecological environment as indica and japonica accessions has independent evolution frame and the origin of Indian rice accessions from indica cultivars. Hence the major criterion for population structure in this panel is indica – japonica subtype. This study includes large number of traditional landraces and varieties from Indian Subcontinent and few exotic accessions randomly selected from IRRI worldwide collection. It clarifies the relationship between Indian germplasm and exotic accessions which indicates that germplasm lines varies based on its ecology and also shows higher level of genetic diversity exists within this population.
Further structure analysis of SG1 that consisted of 134 lines indicated that it can be further subdivided in to three sub sub-groups. The three sub sub-groups classification has the factor of ecosystem and seasonal variation as the major factors for population structure. This results is in accordance with the inference that indica group has higher genetic diversity than japonica accessions which was given by various researchers (Gao et al. 2005; Lu et al. 2005; Lapitan et al. 2007; Caicedo et al. 2007; Liakat Ali et al. 2011; Garris et al. 2005; Qi et al. 2006; Qi et al. 2009); as this subgroup has indica accessions. Liakat Ali et al. (2011) has substantiated this statement with the reason of the indica subpopulation occupying the largest rice growing region which has a varied environments, ecological conditions and soil type.
The result of model based analysis is in accordance with the clustering pattern of Neighbour joining tree and Principal Coordinate Analysis. The first two principal coordinates explained 12.6 and 4.8 % of the molecular variance. Similar pattern of molecular variance explanation was observed by Zhang et al. (2011) for two population subgroups.
Calculation of Wright’s F Statistic at all loci revealed the deviation from Hardy- Weinberg law for molecular variation within the population. The result of Fst indicates higher divergence existing between subgroups of the population. Higher FIT, which is measured at subgroup level in whole population, has indicated lack of equilibrium across the groups and lack of heterozygosity most likely due to the inbreeding nature of rice.
The present study revealed that several unexploited landraces of Tamil Nadu, India which is widely cultivated by the farmers in different parts of the state. Ecological and evolutionary history contributes for the genetic diversity maintained in a population. The varieties with diverse ecosystems and wide eco-geographical conditions contribute for the genetic diversity among rice varieties in this population.
For establishing a core collection for association studies, two step approach followed by Breseghello and Sorrells (2006) and Courtois et al. (2012) was used. This approach involves the determination of population structure and then sampling can be done based on the relatedness of the accessions in the population. Those accessions that show high magnitude of genetic relatedness can be eliminated to develop core collection with diverse representatives. Based on this idea, out of 192 accessions, 150 (Table 5) were selected to form association mapping panel which can be utilized either by genome wide or candidate gene specific association mapping for linking the genotypic and phenotypic variation.
Table 5.
Genotypes selected for association mapping panel
| G. no | Genotypes | G. no | Genotypes | G. no | Genotypes | G. no | Genotypes | G. no | Genotypes | G. no | Genotypes |
|---|---|---|---|---|---|---|---|---|---|---|---|
| RG1 | Mapillai samba | RG58 | Kodaikuluthan | RG113 | IG 45(EC 728768- 117736) | RG154 | IG 48(EC 729203- 121195) | RG39 | Kaatu ponni | RG95 | Jeeraga samba |
| RG2 | CK 275 | RG59 | RPHP 68 | RG114 | RPHP 159 | RG156 | IG 12(EC 729626- 121681) | RG41 | Godavari samba | RG96 | RP-BIO-226 |
| RG3 | Senkar | RG60 | Rama kuruvaikar | RG115 | IG 43(EC 728788- 117759) | RG157 | Karungan | RG42 | Earapalli samba | RG98 | IG 5(EC 729642- 121698) |
| RG4 | Murugankar | RG62 | Purple puttu | RG116 | RPHP 27 | RG158 | IG 13(EC 729640- 121696) | RG43 | RPHP 129 | RG99 | IG 31(EC 728844- 117829) |
| RG5 | CHIR 6 | RG63 | IG 71(EC 728651- 117588) | RG117 | IG 65(EC 729024- 120958) | RG159 | Sembala | RG44 | Mangam samba | RG100 | IG 7(EC 729598- 121648) |
| RG6 | CHIR 5 | RG65 | IG 56(EC 728700- 117658 | RG118 | Ponmani samba | RG160 | IG 72(EC 728650- 117587) | RG45 | RPHP 105 | RG101 | RPHP 52 |
| RG7 | Kudai vazhai | RG66 | Jeevan samba | RG120 | Thattan samba | RG161 | Panamarasamba | RG46 | IG 4(EC 729639- 121695) | RG102 | Varakkal |
| RG8 | CHIR 8 | RG67 | RPHP 106 | RG121 | IG 74(EC 728622- 117517) | RG162 | IR 64 | RG48 | Kalarkar | RG103 | Mattaikar |
| RG9 | Kuruvai kalanjiyam | RG68 | IG 63(EC 728711- 117674) | RG122 | Kaliyan samba | RG163 | Mikuruvai | RG50 | Sornavari | RG104 | IG 53(EC 728752- 117719) |
| RG12 | Vellai chithiraikar | RG69 | RPHP 48 | RG123 | IG 2(EC 729808-121874) | RG164 | Thillainayagam | RG51 | RPHP 134 | RG105 | IG 6(EC 729592- 121642) |
| RG14 | Jothi | RG70 | Karthi samba | RG124 | IG 29(EC 728925- 117920) | RG165 | ARB 64 | RG52 | ARB 58 | RG106 | Katta samba |
| RG15 | Palkachaka | RG71 | IG 27(IC 0590934- 121255) | RG126 | Kallimadayan | RG166 | RPHP 140 | RG53 | IR 68144-2B-2-2-3-1-127 | RG107 | RH2-SM-1-2-1 |
| RG17 | Chivapu chithiraikar | RG72 | Aarkadu kichili | RG127 | IG 10(EC 729686- 121743) | RG168 | Haladichudi | RG54 | PTB 19 | RG108 | Red sirumani |
| RG18 | CHIR 11 | RG74 | ARB 65 | RG128 | IG 75(EC 728587- 117420) | RG169 | IG 24(EC 728751- 117718) | RG55 | IG 67(EC 729050- 120988) | RG109 | Vadivel |
| RG20 | Kalvalai | RG76 | Matta kuruvai | RG129 | IG 38(EC 728742 - 117707) | RG170 | RPHP 42 | RG56 | RPHP 59 | RG110 | Norungan |
| RG22 | IR 36 | RG77 | Karuthakar | RG130 | IG 39(EC 728779- 117750) | RG172 | IG 25(EC 729728- 121785) | RG57 | RPHP 103 | RG112 | IG 35(EC 728858- 117843) |
| RG25 | Sorna kuruvai | RG80 | IG 66(EC 729047- 120985) | RG131 | RPHP 90 | RG173 | IG 73(EC 728627- 117527) | RG143 | IG 46(IC 471826- 117647) | RG184 | IG 18(EC 728892- 117880) |
| RG26 | Rascadam | RG81 | CB-07-701-252 | RG132 | IG 33(EC 728938- 117935) | RG174 | IG 51(EC 728772- 117742) | RG145 | IG 60(EC 728730- 117695) | RG185 | RPHP 36 |
| RG31 | Chinthamani | RG82 | Thooyamalli | RG133 | IG 42(EC 728798- 117774) | RG175 | Vellai kudaivazhai | RG146 | IR 75862-206 | RG186 | IG 28(EC 728920- 117914) |
| RG32 | Thogai samba | RG83 | RPHP 93 | RG134 | IG 9(EC 729682- 121739) | RG176 | Kodai | RG147 | IG 58(EC 728725- 117689) | RG187 | Vadakathi samba |
| RG33 | Malayalathan samba | RG85 | RPHP 104 | RG135 | RPHP 161 | RG178 | IG 17(EC 728900- 117889) | RG148 | Chinna aduku nel | RG188 | RPHP 80 |
| RG34 | RPHP 125 | RG86 | RPHP 102 | RG136 | IG 8(EC 729601- 121651) | RG180 | IG 59(EC 728729- 117694) | RG149 | RH2-SM-2-23 | RG189 | IG 41(EC 728800- 117776) |
| RG35 | CK 143 | RG89 | IR 83294-66-2-2-3-2 | RG137 | IG 37(EC 728715- 117678) | RG181 | IG 52(EC 728756- 117723) | RG150 | IG 14(IC 517381- 121422) | RG190 | IG 26(IC 0590943- 121899) |
| RG36 | Kattikar | RG91 | IG 23(EC 729391- 121419) | RG141 | IG 44(EC 728762- 117729) | RG182 | ARB 59 | RG151 | IG 32(EC 728838- 117823) | RG191 | IG 15(EC 728910- 117901) |
| RG37 | Shenmolagai | RG92 | IG 49(EC 729102- 121052) | RG142 | Sasyasree | RG183 | RPHP 163 | RG152 | RPHP 47 | RG192 | Nootri pathu |
Conclusion
This study analyze the pattern of divergence exists in a population of 192 rice accessions that constitute our rice diversity panel for association mapping. Based on various statistical methods, we identified two sub groups within 192 rice accessions selected for establishing association mapping panel. The average number of alleles per locus and gene diversity has indicated the existence of broad genetic base in this collection. The result of structure analysis is in accordance with clustering method of neighbor joining tree and principal coordinate analysis. Thus, the results of this study which indicates the genetic diversity of the accessions can be utilized to predict approaches such as association analysis, classical mapping population development; parental line selection in breeding programs and hybrid development for exploiting the natural genetic variation exists in this population.
Methods
Plant Material
A collection consisting of 192 rice accessions was used in this study, which consist of land races and varieties collected from nine different states of India as well as from Argentina, Bangladesh, Brazil, Bulgaria, China, Colombia, Indonesia, Philippines, Taiwan, Uruguay, Venezuela and United States (Table 6).
Table 6.
Germplasm accessions used in the study
| G. no. | Genotype | Parentage | Origin | Type – traditional/Improved | Subtype | Ecosystem IR = irrigated, RL = rainfed lowland; UP = upland | Maturity class: E = early, M = medium, L = late; | Donors/Original providing country |
|---|---|---|---|---|---|---|---|---|
| RG1 | Mapillai samba | Landrace | Tamil Nadu, India | T | indica | IR | L | India |
| RG2 | CK 275 | CO50 X KAVUNI | Tamil Nadu, India | I | indica | IR | L | India |
| RG3 | Senkar | Landrace | Tamil Nadu, India | T | indica | IR | M | India |
| RG4 | Murugankar | Landrace | Tamil Nadu, India | T | indica | UP | L | India |
| RG5 | CHIR 6 | Improved chinsurah | West Bengal | I | indica | IR | E | India |
| RG6 | CHIR 5 | Improved chinsurah | West Bengal | I | indica | IR | E | India |
| RG7 | Kudai vazhai | Landrace | Tamil Nadu, India | T | indica | UP | E | India |
| RG8 | CHIR 8 | Improved chinsurah | West Bengal | I | indica | IR | E | India |
| RG9 | Kuruvai kalanjiyam | Landrace | Tamil Nadu, India | T | indica | IR | E | India |
| RG10 | Nava konmani | Landrace | Tamil Nadu, India | T | indica | RL | M | India |
| RG11 | CHIR 10 | Improved chinsurah | West Bengal | I | indica | IR | M | India |
| RG12 | Vellai chithiraikar | Landrace | Tamil Nadu, India | T | indica | RL | E | India |
| RG13 | CHIR 2 | Improved chinsurah | West Bengal | I | indica | IR | M | India |
| RG14 | Jyothi | Variety | Kerala, India | T | indica | IR | E | India |
| RG15 | Palkachaka | Landrace | Tamil Nadu, India | T | indica | IR | M | India |
| RG16 | Thooyala | Landrace | Tamil Nadu, India | T | indica | IR | E | India |
| RG17 | Chivapu chithiraikar | Landrace | Tamil Nadu, India | T | indica | RL | E | India |
| RG18 | CHIR 11 | Improved chinsurah | West Bengal | I | indica | IR | M | India |
| RG19 | Koolavalai | Landrace | Tamil Nadu, India | T | indica | RL | M | India |
| RG20 | Kalvalai | Landrace | Tamil Nadu, India | T | indica | RL | E | India |
| RG21 | Mohini samba | Landrace | Tamil Nadu, India | T | indica | IR | M | India |
| RG22 | IR 36 | IR 1561 X IR 24 X Oryza nivara x CR 94 | IRRI, Philippines | I | indica | IR | E | Philippines |
| RG23 | Koombalai | Landrace | Tamil Nadu, India | T | indica | IR | M | India |
| RG24 | Tadukan | Landrace | Philippines | T | indica | UP | M | Philippines |
| RG25 | Sorna kuruvai | Landrace | Tamil Nadu, India | T | indica | IR | M | India |
| RG26 | Rascadam | Landrace | Tamil Nadu, India | T | indica | IR | M | India |
| RG27 | Muzhi karuppan | Landrace | Tamil Nadu, India | T | indica | IR | E | India |
| RG28 | Kaatukuthalam | Landrace | Tamil Nadu, India | T | indica | RL | M | India |
| RG29 | Vellaikattai | Landrace | Tamil Nadu, India | T | indica | RL | M | India |
| RG30 | Poongar | Landrace | Tamil Nadu, India | T | indica | RL | L | India |
| RG31 | Chinthamani | Landrace | Tamil Nadu, India | T | indica | RL | M | India |
| RG32 | Thogai samba | Landrace | Tamil Nadu, India | T | indica | RL | M | India |
| RG33 | Malayalathan samba | Landrace | Tamil Nadu, India | T | indica | IR | E | India |
| RG34 | RPHP125 | NDR 2026 (RICHA) | UTTAR PRADHESH | I | indica | IR | E | India |
| RG35 | CK 143 | CO50 X KAVUNI | Tamil Nadu, India | I | indica | IR | L | India |
| RG36 | Kattikar | Landrace | Tamil Nadu, India | T | indica | RL | M | India |
| RG37 | Shenmolagai | Landrace | Tamil Nadu, India | T | indica | IR | M | India |
| RG38 | Velli samba | Landrace | Tamil Nadu, India | T | indica | IR | M | India |
| RG39 | Kaatu ponni | Landrace | Tamil Nadu, India | T | indica | IR | M | India |
| RG40 | kakarathan | Landrace | Tamil Nadu, India | T | indica | IR | M | India |
| RG41 | Godavari samba | Landrace | Tamil Nadu, India | T | indica | IR | M | India |
| RG42 | Earapalli samba | Landrace | Tamil Nadu, India | T | indica | IR | M | India |
| RG43 | RPHP 129 | Kamad | JAMMU & KASHMIR | T | indica | Scented | E | India |
| RG44 | Mangam samba | Landrace | Tamil Nadu, India | T | indica | IR | M | India |
| RG45 | RPHP 105 | Moirang phou | MANIPUR | T | indica | IR | E | India |
| RG46 | IG 4(EC 729639- 121695) | TD2: :IRGC 9148-1 | IRRI, Philippines | I | indica | IR | M | Philippines |
| RG47 | Machakantha | Landrace | Orissa, India | T | indica | scented | E | India |
| RG48 | Kalarkar | Landrace | Tamil Nadu, India | T | indica | RL | E | India |
| RG49 | Valanchennai | Landrace | Tamil Nadu, India | T | indica | RL | E | India |
| RG50 | Sornavari | Landrace | Tamil Nadu, India | T | indica | RL | E | India |
| RG51 | RPHP 134 | NJAVARA | Kerala | T | indica | RL | E | India |
| RG52 | ARB 58 | Variety | Karnataka | I | indica | IR | E | India |
| RG53 | IR 68144-2B-2-2-3-1-127 | IR 72 X ZAWA BONDAY | IRRI, Philippines | I | indica | E | Philippines | |
| RG54 | PTB 19 | Variety | Kerala, India | I | indica | IR | M | India |
| RG55 | IG 67(EC 729050- 120988) | IR 77384-12-35-3-12-l-B::IRGC 117299-1 | IRRI, Philippines | I | indica | IR | E | Philippines |
| RG56 | RPHP 59 | Taroari Basmati/karnal local | HARYANA | T | Aromatic | scented | L | India |
| RG57 | RPHP 103 | Pant sugandh dhan -17 | UTTARKHAND | I | Aromatic | scented | L | India |
| RG58 | Kodaikuluthan | Landrace | Tamil Nadu, India | T | indica | RL | E | India |
| RG59 | RPHP 68 | Subhdra | Orissa, India | I | indica | RL | E | India |
| RG60 | Rama kuruvaikar | Landrace | Tamil Nadu, India | T | indica | IR | E | India |
| RG61 | Kallundai | Landrace | Tamil Nadu, India | T | indica | RL | E | India |
| RG62 | Purple puttu | Landrace | Tamil Nadu, India | T | indica | IR | E | India |
| RG63 | IG 71(EC 728651- 117588) | TEPI BORO::IRGC 27519-1 | IRRI, Philippines | I | aus | IR | E | Philippines |
| RG64 | Ottadaiyan | Landrace | Tamil Nadu, India | T | indica | RL | M | India |
| RG65 | IG 56(EC 728700- 117658 | BICO BRANCO | Brazil | T | Aromatic | UP | E | Philippines |
| RG66 | Jeevan samba | Landrace | Tamil Nadu, India | T | indica | IR | M | India |
| RG67 | RPHP 106 | akut phou | MANIPUR | I | indica | IR | M | India |
| RG68 | IG 63(EC 728711- 117674) | CAAWA/FORTUNA | IRRI, Philippines | I | Tropical Japonica | IR | M | Philippines |
| RG69 | RPHP 48 | Bindli | UTTARKHAND | T | Aromatic | Scented | L | India |
| RG70 | Karthi samba | Landrace | Tamil Nadu, India | T | indica | IR | M | India |
| RG71 | IG 27(IC 0590934- 121255) | ARC 11345::IRGC 21336-1 | IRRI, Philippines | I | indica | IR | M | Philippines |
| RG72 | Aarkadu kichili | Landrace | Tamil Nadu, India | T | indica | IR | M | India |
| RG73 | Kunthali | Landrace | Tamil Nadu, India | T | indica | IR | E | India |
| RG74 | ARB 65 | Variety | Karnataka | I | indica | IR | E | India |
| RG75 | IG 21(EC 729334- 121355) | HONGJEONG::IRGC 73052-1 | IRRI, Philippines | I | japonica | IR | E | Philippines |
| RG76 | Matta kuruvai | Landrace | Tamil Nadu, India | T | indica | IR | E | India |
| RG77 | Karuthakar | Landrace | Tamil Nadu, India | T | indica | RL | E | India |
| RG78 | RPHP 165 | Tilak kachari | West Bengal | T | indica | IR | E | India |
| RG79 | Manavari | Landrace | Tamil Nadu, India | T | indica | U | E | India |
| RG80 | IG 66(EC 729047- 120985) | IR 71137-243-2-2-3-3::IRGC 99696-1 | IRRI, Philippines | I | indica | IR | E | Philippines |
| RG81 | CB-07-701-252 | White ponni X Rasi | Tamil Nadu, India | I | indica | IR | E | India |
| RG82 | Thooyamalli | Landrace | Tamil Nadu, India | T | indica | IR | M | India |
| RG83 | RPHP 93 | Type-3 (Dehradooni Basmati) | UTTARKHAND | I | indica | Scented | M | India |
| RG84 | Velsamba | Landrace | Tamil Nadu, India | T | indica | IR | M | India |
| RG85 | RPHP 104 | Kasturi (IET 8580) | UTTARKHAND | I | indica | IR | M | India |
| RG86 | RPHP 102 | Kanchana | Kerala, India | I | indica | Semi Deep Water | L | India |
| RG87 | IG 40(EC 728740- 117705) | DEE GEO WOO GEN | TAIWAN | T | Indica | IR | M | Philippines |
| RG88 | Saranga | Landrace | Tamil Nadu, India | T | indica | IR | E | India |
| RG89 | IR 83294-66-2-2-3-2 | DAESANBYEO X IR65564-44-5-1 | IRRI, Philippines | I | japonica | RL | M | Philippines |
| RG90 | IG 61(EC 728731- 117696) | CRIOLLO LA FRIA | Venezuela | I | Indica | IR | E | Philippines |
| RG91 | IG 23(EC 729391- 121419) | MAHA PANNITHI::IRGC 51021-1 | IRRI, Philippines | I | Aus | IR | M | Philippines |
| RG92 | IG 49(EC 729102- 121052) | MENAKELY ::IRGC 69963-1 | Madagascar | I | Indica | RL | M | Philippines |
| RG93 | Uppumolagai | Landrace | Tamil Nadu, India | T | Indica | IR | M | India |
| RG94 | Karthigai samba | Landrace | Tamil Nadu, India | T | Indica | RL | M | India |
| RG95 | Jeeraga samba | Landrace | Tamil Nadu, India | T | Indica | IR | M | India |
| RG96 | RP-BIO-226 | IMPROVED SAMBHA MAHSURI | ANDHRA PRADESH | I | Indica | IR | M | India |
| RG97 | Varigarudan samba | Landrace | Tamil Nadu, India | T | Indica | IR | M | India |
| RG98 | IG 5(EC 729642- 121698) | IR 65907-116-1-B::C1 | IRRI, Philippines | I | japonica | UP | E | Philippines |
| RG99 | IG 31(EC 728844- 117829) | ORYZICA LLANOS 5 | Colombia | T | Indica | IR | M | Philippines |
| RG100 | IG 7(EC 729598- 121648) | VARY MAINTY::IRGC 69910-1 | Madagascar | I | japonica | IR | M | Philippines |
| RG101 | RPHP 52 | SEBATI | Orissa, India | I | Indica | IR | M | India |
| RG102 | Varakkal | Landrace | Tamil Nadu, India | T | Indica | UP | E | India |
| RG103 | Mattaikar | Landrace | Tamil Nadu, India | T | Indica | RL | L | India |
| RG104 | IG 53(EC 728752- 117719) | CAROLINA RINALDO BARSANI | URUGUAY | I | Temperate japonica | IR | E | Philippines |
| RG105 | IG 6(EC 729592- 121642) | SOM CAU 70 A::IRGC 8227-1 | Vietnam | I | Temperate japonica | IR | E | Philippines |
| RG106 | Katta samba | Landrace | Tamil Nadu, India | T | Indica | RL | L | India |
| RG107 | RH2-SM-1-2-1 | SWARNA X MOROBERAKAN | Tamil Nadu, India | I | Indica | IR | E | India |
| RG108 | Red sirumani | Landrace | Tamil Nadu, India | T | Indica | RL | E | India |
| RG109 | Vadivel | Landrace | Tamil Nadu, India | T | Indica | IR | M | India |
| RG110 | Norungan | Landrace | Tamil Nadu, India | T | Indica | RL | E | India |
| RG111 | IG 20(EC 729293- 121310) | CHIGYUNGDO::IRGC 55466-1 | South Korea | I | Indica | UP | E | Philippines |
| RG112 | IG 35(EC 728858- 117843) | PATE BLANC MN 1 | Cote D’Ivoire | I | japonica | UP | M | Philippines |
| RG113 | IG 45(EC 728768- 117736) | FORTUNA | Puerto Rico | T | japonica | IR | M | Philippines |
| RG114 | RPHP 159 | Radhuni Pagal | BANGLADESH | I | aromatic rice | Scented | L | India |
| RG115 | IG 43(EC 728788- 117759) | IR-44595 | IRRI, Philippines | I | indica | IR | E | Philippines |
| RG116 | RPHP 27 | Azucena | IRRI, Philippines | T | Tropical Japonica | RL | E | India |
| RG117 | IG 65(EC 729024- 120958) | GODA HEENATI::IRGC 31393-1 | SRILANKA | I | indica | IR | E | Philippines |
| RG118 | Ponmani samba | Landrace | Tamil Nadu, India | T | indica | IR | M | India |
| RG119 | Ganthasala | Landrace | Tamil Nadu, India | T | indica | IR | M | India |
| RG120 | Thattan samba | Landrace | Tamil Nadu, India | T | indica | IR | E | India |
| RG121 | IG 74(EC 728622- 117517) | KINANDANG PATONG::IRGC 23364-1 | IRRI, Philippines | I | japonica | RL | M | Philippines |
| RG122 | Kaliyan samba | Landrace | Tamil Nadu, India | T | indica | IR | M | India |
| RG123 | IG 2(EC 729808-121874) | BLUEBONNET 50::IRGC 1811-1 | IRRI, Philippines | I | japonica | UP | M | Philippines |
| RG124 | IG 29(EC 728925- 117920) | TOX 782-20-1 | NIGERIA | T | Tropical Japonica | IR | E | Philippines |
| RG125 | RPHP 55 | Kalinga -3 | Orissa | I | indica | RL | E | India |
| RG126 | Kallimadayan | Landrace | Tamil Nadu, India | T | indica | RL | E | India |
| RG127 | IG 10(EC 729686- 121743) | HASAN SERAI | IRRI, Philippines | I | aromatic | IR | E | Philippines |
| RG128 | IG 75(EC 728587- 117420) | AEDAL::IRGC 55441-1 | Korea | T | japonica | IR | E | Philippines |
| RG129 | IG 38(EC 728742 - 117707) | DELREX | UNITED STATES | Tropical japonica | IR | M | Philippines | |
| RG130 | IG 39(EC 728779- 117750) | HONDURAS | HONDURAS | indica | IR | M | Philippines | |
| RG131 | RPHP 90 | 182(M) | Andhra Pradesh | I | indica | IR | E | India |
| RG132 | IG 33(EC 728938- 117935) | WC 3397 | JAMAICA | Tropical Japonica | IR | E | Philippines | |
| RG133 | IG 42(EC 728798- 117774) | KALUBALA VEE | SRILANKA | T | indica | IR | E | Philippines |
| RG134 | IG 9(EC 729682- 121739) | GEMJYA JYANAM::IRGC 32411-C1 | IRRI, Philippines | I | indica | IR | E | Philippines |
| RG135 | RPHP 161 | Champa Khushi | Vietnam | T | indica | UP | E | India |
| RG136 | IG 8(EC 729601- 121651) | XI YOU ZHAN::IRGC 78574-1 | China | I | indica | IR | E | Philippines |
| RG137 | IG 37(EC 728715- 117678) | CENIT | ARGENTINA | T | Tropical Japonica | IR | L | Philippines |
| RG138 | Sigappu kuruvikar | Landrace | Tamil Nadu, India | T | indica | RL | E | India |
| RG139 | RPHP 138 | EDAVANKUDI POKKALI | Kerala, India | T | indica | Deep water | L | India |
| RG140 | Raja mannar | Landrace | Tamil Nadu, India | T | indica | IR | M | India |
| RG141 | IG 44(EC 728762- 117729) | EDITH | UNITED STATES | T | indica | IR | E | Philippines |
| RG142 | Sasyasree | TKM 6 x IR 8 | West Bengal | I | indica | IR | E | India |
| RG143 | IG 46(IC 471826- 117647) | BABER | INDIA | I | indica | IR | E | India |
| RG144 | Chetty samba | Landrace | Tamil Nadu, India | T | indica | IR | E | India |
| RG145 | IG 60(EC 728730- 117695) | CREOLE | Belize | T | indica | IR | M | Philippines |
| RG146 | IR 75862-206 | IR 75083 X IR 65600 -81-5-3-2 | IRRI, Philippines | I | Tropical Japonica | IR | M | Philippines |
| RG147 | IG 58(EC 728725- 117689) | CI 11011 | UNITED STATES | japonica | IR | M | Philippines | |
| RG148 | Chinna aduku nel | Landrace | Tamil Nadu, India | T | indica | IR | L | India |
| RG149 | RH2-SM-2-23 | SWARNA X MOROBERAKAN | Tamil Nadu, India | I | indica | IR | M | India |
| RG150 | IG 14(IC 517381- 121422) | MALACHAN::IRGC 54748-1 | India | I | indica | UP | E | Philippines |
| RG151 | IG 32(EC 728838- 117823) | NOVA | United States | I | japonica | IR | M | Philippines |
| RG152 | RPHP 47 | Pathara (CO-18 x Hema) | India | I | indica | IR | E | India |
| RG153 | Sembilipiriyan | Landrace | Tamil Nadu, India | T | indica | RL | M | India |
| RG154 | IG 48(EC 729203- 121195) | DINOLORES::IRGC 67431-1 | IRRI, Philippines | I | indica | UP | M | Philippines |
| RG155 | Sona mahsuri | Landrace | Tamil Nadu, India | T | indica | IR | E | India |
| RG156 | IG 12(EC 729626- 121681) | SHESTAK::IRGC 32351-1 | Iran | I | indica | IR | E | Philippines |
| RG157 | Karungan | Landrace | Tamil Nadu, India | T | indica | IR | E | India |
| RG158 | IG 13(EC 729640- 121696) | CURINCA::C1 | BRAZIL | I | indica | IR | E | Philippines |
| RG159 | Sembala | Landrace | Tamil Nadu, India | T | indica | IR | L | India |
| RG160 | IG 72(EC 728650- 117587) | TD 25::IRGC 9146-1 | Thailand | I | indica | IR | M | Philippines |
| RG161 | Panamarasamba | Landrace | Tamil Nadu, India | T | indica | IR | M | India |
| RG162 | IR 64 | IR-5857-33-2-1 x IR-2061-465-1-5-5 | IRRI, Philippines | I | indica | IR | E | Philippines |
| RG163 | Mikuruvai | Landrace | Tamil Nadu, India | T | indica | RL | E | India |
| RG164 | Thillainayagam | Landrace | Tamil Nadu, India | T | indica | IR | M | India |
| RG165 | ARB 64 | Variety | Karnataka | I | indica | IR | E | India |
| RG166 | RPHP 140 | VYTILLA ANAKOPON | Kerala | T | indica | IR | E | India |
| RG167 | IG 70(EC 729045- 120983) | IR43::IRGC 117005-1 | IRRI, Philippines | I | indica | IR | M | Philippines |
| RG168 | Haladichudi | Landrace | Orissa, India | T | indica | IR | E | India |
| RG169 | IG 24(EC 728751- 117718) | DNJ 140 | BANGLADESH | I | Aus | IR | E | Philippines |
| RG170 | RPHP 42 | Salimar Rice -1 | JAMMU & KASHMIR | I | indica | IR | M | India |
| RG171 | RPHP 44 | BR- 2655 | KARNATAKA | I | indica | IR | L | India |
| RG172 | IG 25(EC 729728- 121785) | LOHAMBITRO 224::GERVEX 5144-C1 | Madagascar | I | Tropical Japonica | IR | E | Philippines |
| RG173 | IG 73(EC 728627- 117527) | MAKALIOKA 34::IRGC 6087-1 | IRRI, Philippines | I | indica | IR | E | Philippines |
| RG174 | IG 51(EC 728772- 117742) | GOGO LEMPUK | Indonesia | Tropical Japonica | IR | M | Philippines | |
| RG175 | Vellai kudaivazhai | Landrace | Tamil Nadu, India | T | indica | RL | M | India |
| RG176 | Kodai | Landrace | Tamil Nadu, India | T | indica | RL | E | India |
| RG177 | Kallundaikar | Landrace | Tamil Nadu, India | T | indica | UP | M | India |
| RG178 | IG 17(EC 728900- 117889) | SIGADIS | INDONESIA | T | indica | RL | L | Philippines |
| RG179 | Avasara samba | Landrace | Tamil Nadu, India | T | indica | IR | E | India |
| RG180 | IG 59(EC 728729- 117694) | COPPOCINA | BULGARIA | I | Tropical Japonica | IR | M | Philippines |
| RG181 | IG 52(EC 728756- 117723) | DOURADO AGULHA | BRAZIL | I | Tropical Japonica | IR | M | Philippines |
| RG182 | ARB 59 | Variety | Karnataka | I | indica | IR | E | India |
| RG183 | RPHP 163 | Seeta sail | West Bengal | T | indica | Scented | M | India |
| RG184 | IG 18(EC 728892- 117880) | SERATOES HARI | INDONESIA | T | indica | IR | E | Philippines |
| RG185 | RPHP 36 | TKM-9 | Tamil Nadu, India | I | indica | IR | E | India |
| RG186 | IG 28(EC 728920- 117914) | TIA BURA | INDONESIA | T | Tropical Japonica | IR | M | Philippines |
| RG187 | Vadakathi samba | Landrace | Tamil Nadu, India | T | indica | IR | M | India |
| RG188 | RPHP 80 | 24(K) | Andhra Pradesh | I | indica | IR | E | India |
| RG189 | IG 41(EC 728800- 117776) | KANIRANGA | Indonesia | T | Tropical japonica | IR | M | Philippines |
| RG190 | IG 26(IC 0590943- 121899) | BASMATI 370::IRGC 3750-1 | IRRI, Philippines | I | aromatic | IR | E | Philippines |
| RG191 | IG 15(EC 728910- 117901) | SZE GUEN ZIM | CHINA | I | indica | IR | E | Philippines |
| RG192 | Nootri pathu | Landrace | Tamil Nadu, India | T | indica | RL | L | India |
IRRI lines - The number after hyphen inside brackets represent IRGC number
Microsatellite Genotyping
DNA Isolation and PCR Amplification
DNA was extracted from leaf tissue by grinding with liquid nitrogen using CTAB method (Saghai-Maroof et al. 1984.). It was diluted to a final concentration of 30 ng μl−1 for enabling polymerase chain reactions. DNA amplification parameters such as specificity, efficiency and fidelity are strongly influenced by the components of the PCR reaction and by thermal cycling conditions (Caetano-Anolles and Brant 1991). Therefore, the careful optimization of reaction components and conditions will ultimately result in more reproducible and efficient amplification. The concentrations of primers, template DNA, Master Mix, and annealing temperature was optimized on eight diverse accessions for 156 SSR markers distributed on the 12 chromosomes by modified Taguchi method (Cobb and CIarkson 1994). Microsatellite primer sequences, annealing temperature and chromosomal locations are obtained from GRAMENE database (http://archive.gramene.org/markers/microsat/). Sixty one SSR primer pairs which produce polymorphic allele amplification were chosen to genotype the entire set of germplasm collection.
The volume of the PCR reaction system was 10 μl. The PCR reaction mixture of 10 μl had 0.4 mM dNTPs, 4 mM of MgCl2, 150 mM of Tris–HCl, 10 pmoles of forward and reverse primer and 0.05 U Taq polymerase with 30 ng of DNA. Polymerase chain reaction was performed in BIORAD THERMAL CYCLER using the following program: 94 °C for 2 min, 35 cycles of 94 °C for 45 sec, 50–60 °C for 1 min, 72 °C for 2 min with a final extension of 72 °C for ten min.
Polyacrylamide Gel Electrophoresis
Amplified products were size separated in native polyacrylamide gel electrophoresis using 6 % (w/v) polyacrylamide gel according to Sambrook et al. (2001) in vertical electrophoresis tank with 1X TBE at 150 V. The gel size was determined using standard molecular weight size markers after the bands were detected by silver staining.
Allele Scoring
The bands were visualized in a cluster of two to six in the stained gels for most of the markers. Based on the expected product size given in the GRAMENE website (Additional file 2: Table S1), the size of the most intensely amplified bands around the expected product size for each microsatellite marker was identified using standard molecular weight size markers (20 bp DNA ladder, GeNeI Company). Then the stained gel was dried and documented using light box. Allele score was given based on the presence of a particular size allele in each of the germplasm. The presence was denoted as 1 and absence of an allele as 0 and it was rechecked manually (Additional file 3: Table S2).
Data Analysis
A 1/0 matrix was constructed based on the presence and absence of alleles for the set of 61 markers. This SSR genotype data was analyzed for genetic diversity and population structure.
Genetic Diversity
For a set of accessions, genetic diversity parameters such as number of alleles per locus, allele frequency, heterozygosity and polymorphic information index (PIC) was estimated using the program POWERMARKER Ver3.25 (Liu and Muse 2005). Allele frequency represents the frequency of particular allele for each marker. Heterozygosity is the proportion of heterozygous individuals in the population. Polymorphic information content that represent the amount of polymorphism within a population was estimated based on Botstein et al. (1980).
To assess genetic structure, model based approach and distance based approach were used. Model based approach was utilized with Structure ver 2.3.4 software (Pritchard et al. 2000). The actual number of subpopulation which is denoted by K was identified by this method. For that, the project was run with the following parameter set: the possibility of admixture and allele frequency correlated. Run length was given as 150,000 burning period length followed by 150,000 Markov Chain Monte Carlo (MCMC) replication. Each k value was run for 10 times with k value varying from 1 to 10. The optimum k value was determined by plotting the mean estimate of the log posterior probability of the data (L (K) against the given K value. True number of subpopulation was identified using the maximal value of L (K). An adhoc quantity ΔK proposed by (Evanno et al. 2005) based on second order rate of change of the likelihood function with respect to K estimated using Structure Harvester (Earl 2012) has also shown a clear peak at the optimal K value.
Distance based approach which is based on calculating pair wise distance matrix was computed by calculating a dissimilarity matrix using a shared allele index with DARwin software (Perrier and Jacquemoud-Collet 2006). An unweighted neighbor joining tree was constructed using the calculated dissimilarity index. The genetic distance between accessions was estimated using NEI coefficient (Nei 1972) with bootstrap procedure of resampling (1000) across markers and individuals from allele frequencies. To determine the association among the accessions, unweighted pair group method with arithmetic mean (UPGMA) tree was also drawn using Powermarker and viewed in MEGA 6.0 software (Tamura et al. 2013).
The presence of molecular variance within and between hierarchical population structure estimated by Structure was assessed via Analysis of molecular variance (AMOVA) by Arlequin (Excoffier et al. 2005). F statistics which include FIT, deviations from Hardy- Weinberg expectation across the whole population, FIS deviation from Hardy- Weinberg expectation within a population and FST, correlation of alleles between subpopulation was calculated using AMOVA approach in Arlequin. AMOVA and Principal Coordinate analysis of the germplasm set was performed based on Nei (Nei 1973) distance matrix using GenAlEx 6.5 (Peakall and Smouse 2012).
Acknowledgement
This work was supported by a grant from Department of Biotechnology, Government of India under Rice biofortification with enhanced iron and zinc in high yielding non basmati cultivars through marker assisted breeding and transgenic approaches- Phase II (E28SO) scheme. I thank Dr. Yasodha from Institute of Forest Genetics and Tree Breeding, Coimbatore for helping in the analysis.
Additional files
Allelic pattern of different SSR markers used in this study. (JPG 1.03 MB)
Expected product size obtained from Gramene and observed product size for the SSR markers used in this study. (XLS 170 kb)
Allele matrix of 192 accessions x 61 SSRs. (XLSX 10 kb)
Footnotes
Competing interests
The authors declare that they have no competing interests.
Authors’ contributions
RoS, VVN, RS and SKK prepared the samples. VVN carried out the genotyping, data analysis and drafted the manuscript. BAP, GP, KG participated in genotyping and data preparation. RoS designed the experiment and revised the manuscript. SD, RS, RM, SM participated in study design and revised the manuscript. All authors read and approve the final manuscript.
Contributor Information
Vishnu Varthini Nachimuthu, Email: popvarun@gmail.com.
Raveendran Muthurajan, Email: raveendrantnau@gmail.com.
Sudhakar Duraialaguraja, Email: dsudhakar@hotmail.com.
Rajeswari Sivakami, Email: rajisundar93@gmail.com.
Balaji Aravindhan Pandian, Email: aaron.agri@gmail.com.
Govinthraj Ponniah, Email: sanjay.626@gmail.com.
Karthika Gunasekaran, Email: karthi.tnau07@gmail.com.
Manonmani Swaminathan, Email: swamimano@yahoo.co.in.
Suji K K, Email: krishika_suji@yahoo.co.in.
Robin Sabariappan, Email: robin.tnau@gmail.com.
References
- Abdurakhmonov IY, Abdukarimov A. Application of association mapping to understanding the genetic diversity of plant germplasm resources. Int J Plant Genomics. 2008;2008:574927. doi: 10.1155/2008/574927. [DOI] [PMC free article] [PubMed] [Google Scholar]
- Agrama H, Eizenga G. Molecular diversity and genome-wide linkage disequilibrium patterns in a worldwide collection of Oryza sativa and its wild relatives. Euphytica. 2008;160(3):339–355. doi: 10.1007/s10681-007-9535-y. [DOI] [Google Scholar]
- Agrama H, Eizenga G, Yan W. Association mapping of yield and its components in rice cultivars. Mol Breed. 2007;19(4):341–356. doi: 10.1007/s11032-006-9066-6. [DOI] [Google Scholar]
- Agrama HA, Yan W, Jia M, Fjellstrom R, McClung AM. Genetic structure associated with diversity and geographic distribution in the USDA rice world collection. Nat Sci. 2010;2(04):247. [Google Scholar]
- Botstein D, White RL, Skolnick M, Davis RW. Construction of a genetic linkage map in man using restriction fragment length polymorphisms. Am J Hum Genet. 1980;32(3):314. [PMC free article] [PubMed] [Google Scholar]
- Breseghello F, Sorrells ME. Association mapping of kernel size and milling quality in wheat (Triticum aestivum L.) cultivars. Genetics. 2006;172(2):1165–1177. doi: 10.1534/genetics.105.044586. [DOI] [PMC free article] [PubMed] [Google Scholar]
- Caetano-Anolles G, Brant B. DNA amplification fingerprinting using very short arbitrary oligonucleotide primers. Nat Biotechnol. 1991;9(6):553–557. doi: 10.1038/nbt0691-553. [DOI] [PubMed] [Google Scholar]
- Caicedo AL, Williamson SH, Hernandez RD, Boyko A, Fledel-Alon A, York TL, Polato NR, Olsen KM, Nielsen R, McCouch SR. Genome-wide patterns of nucleotide polymorphism in domesticated rice. PLoS Genet. 2007;3(9):e163. doi: 10.1371/journal.pgen.0030163. [DOI] [PMC free article] [PubMed] [Google Scholar]
- Chakhonkaen S, Pitnjam K, Saisuk W, Ukoskit K, Muangprom A. Genetic structure of Thai rice and rice accessions obtained from the international rice research institute. Rice. 2012;5(1):19. doi: 10.1186/1939-8433-5-19. [DOI] [PMC free article] [PubMed] [Google Scholar]
- Chen H, He H, Zou Y, Chen W, Yu R, Liu X, Yang Y, Gao Y-M, Xu J-L, Fan L-M. Development and application of a set of breeder-friendly SNP markers for genetic analyses and molecular breeding of rice (Oryza sativa L.) Theor Appl Genet. 2011;123(6):869–879. doi: 10.1007/s00122-011-1633-5. [DOI] [PubMed] [Google Scholar]
- Choudhury B, Khan ML, Dayanandan S. Genetic structure and diversity of indigenous rice (Oryza sativa) varieties in the Eastern Himalayan region of Northeast India. Springer Plus. 2013;2(1):228. doi: 10.1186/2193-1801-2-228. [DOI] [PMC free article] [PubMed] [Google Scholar]
- Cobb BD, CIarkson JM. A simple procedure for optimising the polymerase chain reaction (PCR) using modified Taguchi methods. Nucleic Acids Res. 1994;22(18):3801–3805. doi: 10.1093/nar/22.18.3801. [DOI] [PMC free article] [PubMed] [Google Scholar]
- Courtois B, Frouin J, Greco R, Bruschi G, Droc G, Hamelin C, Ruiz M, Clément G, Evrard J-C, van Coppenole S. Genetic diversity and population structure in a European collection of rice. Crop Sci. 2012;52(4):1663–1675. doi: 10.2135/cropsci2011.11.0588. [DOI] [Google Scholar]
- Das B, Sengupta S, Parida SK, Roy B, Ghosh M, Prasad M, Ghose TK. Genetic diversity and population structure of rice landraces from Eastern and North Eastern States of India. BMC Genet. 2013;14(1):71. doi: 10.1186/1471-2156-14-71. [DOI] [PMC free article] [PubMed] [Google Scholar]
- Deepa G, Singh V, Naidu KA. Nutrient composition and physicochemical properties of Indian medicinal rice–Njavara. Food Chem. 2008;106(1):165–171. doi: 10.1016/j.foodchem.2007.05.062. [DOI] [Google Scholar]
- Earl DA. STRUCTURE HARVESTER: a website and program for visualizing STRUCTURE output and implementing the evanno method. Conserv Genet Resour. 2012;4(2):359–361. doi: 10.1007/s12686-011-9548-7. [DOI] [Google Scholar]
- Ebana K, Kojima Y, Fukuoka S, Nagamine T, Kawase M. Development of mini core collection of Japanese rice landrace. Breed Sci. 2008;58(3):281–291. doi: 10.1270/jsbbs.58.281. [DOI] [Google Scholar]
- Evanno G, Regnaut S, Goudet J. Detecting the number of clusters of individuals using the software STRUCTURE: a simulation study. Mol Ecol. 2005;14(8):2611–2620. doi: 10.1111/j.1365-294X.2005.02553.x. [DOI] [PubMed] [Google Scholar]
- Excoffier L, Laval G, Schneider S. Arlequin (version 3.0): an integrated software package for population genetics data analysis. Evol Bioinformatics Online. 2005;1:47. [PMC free article] [PubMed] [Google Scholar]
- Gao L-Z, Zhang C-H, Chang L-P, Jia J-Z, Qiu Z-E, Dong Y-S. Microsatellite diversity within Oryza sativa with emphasis on indica–japonica divergence. Genet Res. 2005;85(01):1–14. doi: 10.1017/S0016672304007293. [DOI] [PubMed] [Google Scholar]
- Garris AJ, Tai TH, Coburn J, Kresovich S, McCOUCH S. Genetic structure and diversity in Oryza sativa L. Genetics. 2005;169(3):1631–1638. doi: 10.1534/genetics.104.035642. [DOI] [PMC free article] [PubMed] [Google Scholar]
- Hesham AA, Yan W, Fjellstrom R, Jia M, McClung A. The 2008 joint annual meeting. 2008. Genetic diversity and relationships assessed by SSRs in the USDA World-Wide Rice Germplasm Collection. [Google Scholar]
- Horst L, Wenzel G. Molecular marker systems in plant breeding and crop improvement. Berlin: Springer; 2007. [Google Scholar]
- Jin L, Lu Y, Xiao P, Sun M, Corke H, Bao J. Genetic diversity and population structure of a diverse set of rice germplasm for association mapping. Theor Appl Genet. 2010;121(3):475–487. doi: 10.1007/s00122-010-1324-7. [DOI] [PubMed] [Google Scholar]
- Krishnanunni K, Senthilvel P, Ramaiah S, Anbarasu A (2015) Study of chemical composition and volatile compounds along with in-vitro assay of antioxidant activity of two medicinal rice varieties: Karungkuravai and Mappilai samba. Journal of Food Science and Technology 52 (5):2572-2584. doi:10.1007/s13197-014-1292-z [DOI] [PMC free article] [PubMed]
- Lapitan VC, Brar DS, Abe T, Redoña ED. Assessment of genetic diversity of Philippine rice cultivars carrying good quality traits using SSR markers. Breed Sci. 2007;57(4):263–270. doi: 10.1270/jsbbs.57.263. [DOI] [Google Scholar]
- Liakat Ali M, McClung AM, Jia MH, Kimball JA, McCouch SR, Georgia CE. A rice diversity panel evaluated for genetic and agro-morphological diversity between subpopulations and its geographic distribution. Crop Sci. 2011;51(5):2021–2035. doi: 10.2135/cropsci2010.11.0641. [DOI] [Google Scholar]
- Liu K, Muse SV. PowerMarker: an integrated analysis environment for genetic marker analysis. Bioinformatics. 2005;21(9):2128–2129. doi: 10.1093/bioinformatics/bti282. [DOI] [PubMed] [Google Scholar]
- Lu H, Redus MA, Coburn JR, Rutger JN, McCOUCH SR, Tai TH. Population structure and breeding patterns of 145 US rice cultivars based on SSR marker analysis. Crop Sci. 2005;45(1):66–76. doi: 10.2135/cropsci2005.0066. [DOI] [Google Scholar]
- McCouch SR, Chen X, Panaud O, Temnykh S, Xu Y, Cho YG, Huang N, Ishii T, Blair M. Microsatellite marker development, mapping and applications in rice genetics and breeding. Plant Mol Biol. 1997;35(1-2):89–99. doi: 10.1023/A:1005711431474. [DOI] [PubMed] [Google Scholar]
- Nachimuthu VV, Robin S, Sudhakar D, Rajeswari S, Raveendran M, Subramanian K, Tannidi S, Pandian BA. Genotypic variation for micronutrient content in traditional and improved rice lines and its role in biofortification programme. Indian J Sci Technol. 2014;7(9):1414–1425. [Google Scholar]
- Nei M. Genetic distance between populations. Am Nat. 1972;106:283–292. doi: 10.1086/282771. [DOI] [Google Scholar]
- Nei M. Analysis of gene diversity in subdivided populations. Proc Natl Acad Sci. 1973;70(12):3321–3323. doi: 10.1073/pnas.70.12.3321. [DOI] [PMC free article] [PubMed] [Google Scholar]
- Ni J, Colowit PM, Mackill DJ. Evaluation of genetic diversity in rice subspecies using microsatellite markers. Crop Sci. 2002;42(2):601–607. doi: 10.2135/cropsci2002.0601. [DOI] [Google Scholar]
- Peakall R, Smouse PE. GenAlEx 6.5: genetic analysis in excel. Population genetic software for teaching and research—an update. Bioinformatics. 2012;28(19):2537–2539. doi: 10.1093/bioinformatics/bts460. [DOI] [PMC free article] [PubMed] [Google Scholar]
- Perrier X, Jacquemoud-Collet J . DARwin software. 2006. [Google Scholar]
- Powell W, Morgante M, Andre C, Hanafey M, Vogel J, Tingey S, Rafalski A. The comparison of RFLP, RAPD, AFLP and SSR (microsatellite) markers for germplasm analysis. Mol Breed. 1996;2(3):225–238. doi: 10.1007/BF00564200. [DOI] [Google Scholar]
- Pritchard JK, Stephens M, Donnelly P. Inference of population structure using multilocus genotype data. Genetics. 2000;155(2):945–959. doi: 10.1093/genetics/155.2.945. [DOI] [PMC free article] [PubMed] [Google Scholar]
- Qi Y, Zhang D, Zhang H, Wang M, Sun J, Wei X, Qiu Z, Tang S, Cao Y, Wang X. Genetic diversity of rice cultivars (Oryza sativa L.) in China and the temporal trends in recent fifty years. Chinese Sci Bull. 2006;51(6):681–688. doi: 10.1007/s11434-006-0681-8. [DOI] [Google Scholar]
- Qi Y, Zhang H, Zhang D, Wang M, Sun J, Ding L, Wang F, Li Z. Assessing indica japonica differentiation of improved rice varieties using microsatellite markers. J Genet Genomics. 2009;36(5):305–312. doi: 10.1016/S1673-8527(08)60119-8. [DOI] [PubMed] [Google Scholar]
- Ram SG, Thiruvengadam V, Vinod KK. Genetic diversity among cultivars, landraces and wild relatives of rice as revealed by microsatellite markers. J Appl Genet. 2007;48(4):337–345. doi: 10.1007/BF03195230. [DOI] [PubMed] [Google Scholar]
- Saghai-Maroof MA, Soliman KM, Jorgensen AR, Allard RW. Ribosomal DNA spacer length polymorphisms in barley: Mendelian inheritance, chromosomal location and population dynamics. Proc Natl Acad Sci U S A. 1984;81:8014–8018. doi: 10.1073/pnas.81.24.8014. [DOI] [PMC free article] [PubMed] [Google Scholar]
- Sambrook J, Russell DW, Russell DW. Molecular cloning: a laboratory manual (3-volume set) Cold Spring Harbor, New York: Cold spring harbor laboratory press; 2001. [Google Scholar]
- Sow M, Ndjiondjop M-N, Sido A, Mariac C, Laing M, Bezançon G. Genetic diversity, population structure and differentiation of rice species from Niger and their potential for rice genetic resources conservation and enhancement. Genet Resour Crop Evol. 2014;61(1):199–213. doi: 10.1007/s10722-013-0026-9. [DOI] [Google Scholar]
- Tamura K, Stecher G, Peterson D, Filipski A, Kumar S. MEGA6: molecular evolutionary genetics analysis version 6.0. Mol Biol Evol. 2013;30(12):2725–2729. doi: 10.1093/molbev/mst197. [DOI] [PMC free article] [PubMed] [Google Scholar]
- Thornsberry JM, Goodman MM, Doebley J, Kresovich S, Nielsen D, Buckler ES. Dwarf8 polymorphisms associate with variation in flowering time. Nat Genet. 2001;28(3):286–289. doi: 10.1038/90135. [DOI] [PubMed] [Google Scholar]
- Valarmathi R, Raveendran M, Robin S, Senthil N (2015) Unraveling the nutritional and therapeutic properties of ‘Kavuni’ a traditional rice variety of Tamil Nadu. Journal of Plant Biochemistry and Biotechnology 24 (3):305-315. doi:10.1007/s13562-014-0274-6
- Varshney RK, Chabane K, Hendre PS, Aggarwal RK, Graner A. Comparative assessment of EST-SSR, EST-SNP and AFLP markers for evaluation of genetic diversity and conservation of genetic resources using wild, cultivated and elite barleys. Plant Sci. 2007;173(6):638–649. doi: 10.1016/j.plantsci.2007.08.010. [DOI] [Google Scholar]
- Zhang D, Zhang H, Wei X, Qi Y, Wang M, Sun J, Ding L, Tang S, Cao Y, Wang X. Genetic structure and diversity of Oryza sativa L. in Guizhou, China. Chinese Sci Bull. 2007;52(3):343–351. doi: 10.1007/s11434-007-0063-x. [DOI] [Google Scholar]
- Zhang D, Zhang H, Wang M, Sun J, Qi Y, Wang F, Wei X, Han L, Wang X, Li Z. Genetic structure and differentiation of Oryza sativa L. in China revealed by microsatellites. Theor Appl Genet. 2009;119(6):1105–1117. doi: 10.1007/s00122-009-1112-4. [DOI] [PubMed] [Google Scholar]
- Zhang P, Li J, Li X, Liu X, Zhao X, Lu Y. Population structure and genetic diversity in a rice core collection (Oryza sativa L.) investigated with SSR markers. PLoS One. 2011;6(12):e27565. doi: 10.1371/journal.pone.0027565. [DOI] [PMC free article] [PubMed] [Google Scholar]
- Zhao K, Tung C-W, Eizenga GC, Wright MH, Ali ML, Price AH, Norton GJ, Islam MR, Reynolds A, Mezey J. Genome-wide association mapping reveals a rich genetic architecture of complex traits in Oryza sativa. Nat Commun. 2011;2:467. doi: 10.1038/ncomms1467. [DOI] [PMC free article] [PubMed] [Google Scholar]
- Zhao K, Wright M, Kimball J, Eizenga G, McClung A, Kovach M, Tyagi W, Ali ML, Tung C-W, Reynolds A (2010) Genomic diversity and introgression in O. sativa reveal the impact of domestication and breeding on the rice genome. PloS one 5(5):e10780 [DOI] [PMC free article] [PubMed]