

Abstract
Liver disease (LD), defined as ≥2-fold elevation of aspartate aminotransferase (AST) or alanine aminotransferase (ALT), was examined in a longitudinal study of systemic lupus erythematosus (SLE) patients. Among 435 patients, 90 (20.7%) had LD with a greater prevalence in males (15/39; 38.5%) than females (75/396; 18.9%; p = 0.01). SLE disease activity index (SLEDAI) was greater in LD patients (7.8 ± 0.7) relative to those without (5.8 ± 0.3; p = 0.0025). Anti-smooth muscle antibodies, anti-DNA antibodies, hypocomplementemia, proteinuria, leucopenia, thrombocytopenia, and anti-phospholipid syndrome were increased in LD. An absence of LD was noted in patients receiving rapamycin relative to azathioprine, cyclosporine A, or cyclophosphamide. An absence of LD was also noted in patients treated with N-acetylcysteine. LFTs were normalized and SLEDAI was diminished with increased prednisone use in 76/90 LD patients over 12.1 ± 2.6 months. Thus, LD is attributed to autoimmunity and disease activity, it responds to prednisone, and it is potentially preventable by rapamycin or N-acetylcysteine treatment.
Keywords: Liver disease, Autoimmunity, Lupus, Disease activity, Treatment
1. Introduction
Systemic lupus erythematosus (SLE) is a chronic autoimmune disease that causes inflammation in multiple organ systems with diverse clinical manifestations [1]. It has been reported that patients with SLE have a 9.3% to 59.7% chance of developing abnormal liver function tests (LFT) during follow-up periods of multiple years [2–5]. Two commonly measured LFTs are aspartate transaminase (AST) and alanine transaminase (ALT). These transaminases participate in amino acid metabolism and are normally found at low levels in plasma serum. However, upon hepatocyte damage, these liver enzymes are released, and abnormal levels can be detected in the circulation [6]. In addition to indicating liver damage, the ratio of AST to ALT can help differentiate the etiology [7].
Management of SLE patients with persistent AST and ALT elevations is challenging. Physicians may be confronted with long-lasting abnormal liver enzymes, which cannot be explained by any obvious causes after excluding viral hepatitis, alcohol toxicity, and potentially harmful drugs. Discerning the cause of liver dysfunction and the safety of immunosuppressant treatments are difficult in these patients. Although the association between SLE and liver disease has been observed on multiple occasions, the relationship of liver disease to co-morbidities and drugs has not been well established. Our study has been initiated to determine the causes of liver disease with a focus on the contributions of SLE disease activity and medication use. This initiative was prompted by the common dilemma that the clinician face in daily practice with respect to handling of liver enzyme elevations. Recent studies set the threshold for drug-induced liver injury at a 2-fold elevation of ALT or AST, depending on the patient population involved [8,9]. In immunocompromised patients, such as those infected by human immunodeficiency virus (HIV) or hepatitis C virus (HCV), the threshold of liver injury was set at a 2-fold elevation of ALT or AST [8,9]. Therefore, we have undertaken a longitudinal study of ALT and AST elevations in SLE patients by excluding subjects with alcohol abuse, hepatitis and human immunodeficiency virus infection, or thyroid disease, all of which can cause liver disease independent of SLE [10–12]. None of these confounding factors have been previously excluded in previous studies of LFT elevation with respect to disease activity and medication use in patients with SLE. The results of this conservatively defined longitudinal study of 435 SLE patients indicate that LD, which is delineated as a ≥2-fold elevation of ALT or AST, may represent a manifestation of lupus disease activity and respond to continued immunosuppression and introduction of prednisone rather than caused by drug toxicity.
2. Methods
2.1. Human subjects
Patients who satisfied the American College of Rheumatology criteria for a definitive diagnosis of SLE [13,14] among those seen and treated at SUNY Upstate Medical University Hospital from October of 1999 to December of 2011 were included in this study. The clinical protocol was approved by the Institutional Review Board. All patients of our lupus cohort are screened for antibodies to hepatitis A, B, or C virus. Patients with evidence of hepatitis A, B, or C virus infection, human immunodeficiency virus (HIV) infection, IgM-positive recent parvovirus B19 infection, and those with a history of alcohol abuse have been excluded. Alcohol abuse diagnosis was made using the Diagnostic and Statistical Manual of Mental Disorders, Fifth Edition (DSM-5) and definition of a problematic pattern of alcohol consumption [15]. Allowable alcohol consumption was considered as an average of one drink per day. One drink was defined as 12 oz of beer, 4 oz of wine, or 1 oz of liquor which do not elicit AST or ALT elevation [16]. To rule out non-hepatic disease as a cause of abnormal liver function tests, SLE patients who possessed elevated creatine phosphokinase (CPK) and thyroid-stimulating hormone (TSH) laboratory values were also excluded from analysis. We defined liver disease (LD) as a 2-fold or greater elevation of serum AST or ALT above the upper limit of the normal range. Patients with a greater than normal, but less than 2-fold elevation in AST or ALT were defined to have intermediate liver disease (iLD). The remaining patients who never had an elevated LFT value were classified as normal. As markers of autoimmune hepatitis (AIH) and primary biliary cirrhosis, anti-smooth muscle antibody (SMA) and anti-mitochondrial antibody (AMA) were assessed. Patient demographics, such as gender, age at the time of LD, ethnicity, and body mass index (BMI) were noted. We analyzed the prevalence of liver disease with respect to diabetes. 27 patients had diabetes, 5 of them type 1. 18 patients were treated with insulin, while 9 patients were only treated with oral anti-diabetic medications, 6 with metformin, 2 with glipizide, 2 with glyburide, and 2 with sitagliptin. The medications taken by SLE patients with LD were recorded for the day when the patient exhibited a 2-fold elevation of liver enzymes and for the next follow-up date when the patient’s LFT have normalized. In addition, we reviewed liver imaging studies and liver biopsies when available.
2.2. Routine laboratory tests
AST (normal range: males, <37 U/L; females, <31 U/L), ALT (normal range: males < 41 U/L; females < 31 U/L), CPK (normal range: males, 20–200 U/L; females, 20–180 U/L), TSH (normal range: 0.270–4.200 μIU/mL), C3 (normal range: 90–180 mg/dL), and C4 (normal range: 10–40 mg/dL) were measured on a Roche/Hitachi Modular Analyzer (Roche Diagnostics, Indianapolis, IN). Platelets (normal range: 150–400 K/μL) and WBC (normal range: 4.0–10.0 K/μL) were counted on a Beckman–Coulter LH 750 Hematology Analyzer (Brea, CA). Lupus anticoagulants were assessed by Staclot LA (delta < 10 s), Staclot® dRVV (<1.2 normalized ratio) manufactured by Stago Diagnostics (Parsippany, NJ, USA). Platelet neutralization assay has been developed in house (delta < 1 s) using a STA-R Evolution instrument by Diagnostica Stago Diagnostics. Cardiolipin and β2-glycoprotein 1 (β2-GP1) antibodies were measured by Quest Diagnostics (Madison, NJ). Antinuclear antibody (ANA; normal range > 1:50 dilution) was detected in the HEp-2 Test System by Zeus Scientific (Raritan, NJ). The immunofluorescent ANA test was used for diagnosis of all patients [17]. Anti-mitochondrial antibody (AMA; normal range > 1:50 dilution) and anti-smooth muscle antibody (SMA; normal range > 1:50 dilution) were measured using NOVA Lite® ANA Plus Mouse Kidney & Stomach assay manufactured by Inova Diagnostics (San Diego, CA). Hepatitis viral antibody tests were performed on an ARCHITECT i1000SR Immunoassay Analyzer manufactured by Abbott Diagnostics (Abbott Park, IL).
2.3. Biomarkers of lupus disease activity
As markers of active SLE, the presence of proteinuria, glomerulonephritis, anti-double stranded DNA antibodies (anti-DNA), hypocomplementemia, leukopenia, thrombocytopenia, and antiphospholipid antibodies (APLA), lupus anticoagulant, and antiphospholipid syndrome (APS) was recorded. APS was confirmed by a clinical thrombotic event and positive tests for cardiolipin or β2-GP1 antibodies or lupus anticoagulant that was persistent for ≥12 weeks [18]. SLE disease activity was assessed by using systemic lupus erythematosus disease activity index (SLEDAI) [19]. Patients that were positive for proteinuria had urine protein levels greater than 0.5 g/day [19]. Hypocomplementemia was classified as low C3 or low C4. Patients with leukopenia or thrombocytopenia had white blood cell (WBC) counts less than 4000/L and platelet counts less than 100,000/L, respectively.
2.4. Statistical analyses
Statistical assays were performed with two-tailed χ2-test, Fisher’s exact test, and correlation analysis using the GraphPad Prism Version 5 software (San Diego, CA). A two-tailed p value <0.05 was considered significant.
3. Results
3.1. Prevalence of LD is increased in male SLE patients
20.7% (90/435) of SLE patients met our criteria of LD, 29.0% (126/435) had iLD, and 50.3% (219/435) had normal AST and ALT (Table 1). Assessment of demographic differences included ethnicity, age, and gender. Among these parameters, ethnicity did not influence the prevalence of LD or iLD in SLE (Table 1). Out of 435 SLE patients, 39 were male and 396 were female. Thus, 38.5% of male patients had LD, while only 18.9% of female patients had LD relative to subjects with normal LFTs (χ2 p = 0.01; Table 1). The prevalence of LD was also increased in males relative to subjects with iLD (χ2 p = 0.02; Table 1). Age was not significantly different between the three cohorts of LD, iLD, and normal LFTs. However, when comparing patients based on gender and age it revealed that subjects with iLD (45.2 ± 1.1 years) were slightly older than those with LD among females (41.1 ± 1.8 years; p = 0.045; Table 2). The average AST/ALT ratio was 1.21 ± 0.04 in all patients, and it was not affected by age, ethnicity, or gender (Table 2). Body mass index (BMI) was not significantly different between patients with LD, iLD, and normal LFTs (Table 2). No significant differences in BMI were noted either when male and female patients were separately analyzed (Table 2). As shown in Table S1, concurrent diabetes did not influence the prevalence of liver disease.
Table 1.
Prevalence of liver disease (LD), intermediate liver disease (iLD) and normal liver function (N) in 435 SLE patients. p values reflect two-tailed χ2 test. p values <0.05 are in italics.
| Patients | Normal | % | iLD | % | LD | % | p | Total | |||
|---|---|---|---|---|---|---|---|---|---|---|---|
|
| |||||||||||
| N vs. iLD | N vs. LD | N vs. iLD + LD | iLD vs. LD | ||||||||
| All | 219 | 50.3 | 126 | 29.0 | 90 | 20.7 | 435 | ||||
| Male | 16 | 41.0 | 8 | 20.5 | 15 | 38.5 | 0.74 | 0.01 | 0.22 | 0.02 | 39 |
| Female | 203 | 51.3 | 118 | 29.8 | 75 | 18.9 | 396 | ||||
| Caucasian | 166 | 52.5 | 84 | 26.6 | 66 | 20.8 | 0.13 | 0.87 | 0.24 | 0.32 | 316 |
| African American | 41 | 45.6 | 32 | 35.5 | 17 | 18.9 | 90 | ||||
| Native American | 1 | 50.0 | 1 | 50 | 0 | 0 | 2 | ||||
| Asian | 4 | 28.6 | 5 | 35.7 | 5 | 35.7 | 14 | ||||
| Hispanic | 7 | 53.8 | 4 | 30.8 | 2 | 15.4 | 13 | ||||
Table 2.
Analysis of body mass index (BMI), age, AST/ALT ratio relative to LD in SLE. p values reflect two-tailed χ2 test. p values <0.05 are in italics.
| Mean | Normal | iLD | pN vs. iLD | LD | pN vs. LD | piLD vs. LD | Overall |
|---|---|---|---|---|---|---|---|
| BMI | |||||||
| All patients | 29.9 ± 0.5 | 31.1 ± 0.7 | 0.20 | 30.4 ± 1.0 | 0.4 | 0.5 | 30.2 ± 0.5 |
| Males | 32.3 ± 2.0 | 27.9 ± 2.8 | 0.5 | 32.4 ± 2.2 | 1.0 | 0.5 | 31.3 ± 1.2 |
| Females | 29.4 ± 0.5 | 31.3 ± 0.7 | 0.10 | 30.2 ± 0.9 | 0.8 | 0.4 | 30.2 ± 0.4 |
| pMales vs. Females | p = 0.4 | p = 0.6 | p = 0.5 | p = 0.6 | |||
| Age | |||||||
| All patients | 44.7 ± 1.0 | 45.1 ± 1.1 | 0.78 | 41.4 ± 1.7 | 0.09 | 0.052 | 45.4 ± 0.7 |
| Males | 41.4 ± 3.9 | 44.3 ± 4.8 | 0.66 | 42.9 ± 4.2 | 0.80 | 0.84 | 42.6 ± 2.4 |
| Females | 45.0 ± 1.1 | 45.2 ± 1.1 | 0.88 | 41.1 ± 1.8 | 0.07 | 0.045 | 44.3 ± 0.7 |
| pMales vs. Females | p = 0.38 | p = 0.84 | p = 0.69 | p = 0.49 | |||
| AST/ALT | |||||||
| All patients | 1.18 ± 0.03 | 1.23 ± 0.12 | 0.58 | 1.26 ± 0.11 | 0.32 | 0.89 | 1.21 ± 0.04 |
| Males | 1.14 ± 0.08 | 1.04 ± 0.39 | 0.55 | 1.28 ± 0.20 | 0.50 | 0.44 | 1.17 ± 0.05 |
| Females | 1.18 ± 0.03 | 1.25 ± 0.13 | 0.54 | 1.26 ± 0.20 | 0.41 | 0.97 | 1.21 ± 0.05 |
| pMales vs. Females | p = 0.69 | p = 0.69 | p = 0.93 | p = 0.79 |
3.2. LD is associated with lupus disease activity characterized by increased SLEDAI, anti-DNA and hypocomplementemia
The greatest differences in biomarkers of lupus disease activity were observed when the LD cohort was compared to lupus patients with normal LFTs. SLEDAI was greater in LD patients (7.8 ± 0.7) relative to those with normal LFT (5.8 ± 0.3; p = 0.0025; Fig. 1A). SLEDAI of iLD patients (6.452 ± 0.4827) was not significantly different from those with normal LFT (p = 0.251) or LD (p = 0.0938). Even after excluding anti-DNA and complement values, the SLEDAI scores remained elevated in LD patients (7.1 ± 0.7) relative to those with normal LFT (5.5 ± 0.3; p = 0.0210; Fig. 1B). SLEDAI of iLD patients (6.1 ± 0.5) was not significantly different from those with normal LFT (p = 0.2688) or LD (p = 0.2571). When clinical and laboratory components of SLEDAI were separately analyzed, proteinuria (p = 0.007), leukopenia (p = 0.0200), and thrombocytopenia (p = 0.0003) as well as anti-DNA antibodies (p = 0.0050) and hypocomplementemia (p = 0.0200) were all increased in SLE patients with LD (Table 3). The prevalence of SMA was also increased in LD patients (p = 0.03). When compared to iLD, LD patients still demonstrated a few significant differences, showing higher prevalence of leukopenia (p = 0.0100) and thrombocytopenia (p = 0.0470). When iLD and LD patients were grouped together as a single cohort, SMA (p = 0.0200), proteinuria (p = 0.03), anti-DNA antibodies (p = 0.0480), and thrombocytopenia were all increased in patients with abnormal LFT (p = 0.0070; Table 3). Traditional markers of lupus disease activity, anti-DNA and hypocomplementemia, were not associated significantly with iLD alone (Table 3).
Fig. 1.
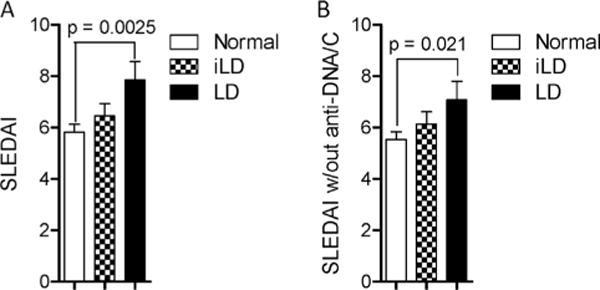
LD is associated with increased disease activity in SLE. A) Assessment of disease activity by SLEDAI in 90 patients with LD defined as ≥2-fold elevation of AST or ALT, 126 patients with iLD defined as <2-fold elevation of AST or ALT, and 219 patients with normal LFTs. B) Modified SLEDAI scores in patients with LD, iLD, and normal LFTs after excluding anti-DNA and complement values. Data represent mean ± SEM. p values indicate comparison with two-tailed unpaired t-test.
Table 3.
Associated of clinical and laboratory factors with LD in SLE. p values reflect two-tailed χ2 test. p values < 0.05 are in italics.
| Normal (N) | iLD | LD | pN vs. iLD | pN vs. iLD + LD | piLD vs. LD | pN vs. LD | |
|---|---|---|---|---|---|---|---|
| SMA (+) | 10 (13.0%) | 11 (26.8%) | 13 (29.5%) | 0.06 | 0.02 | 0.78 | 0.03 |
| SMA (−) | 67 (87.0%) | 30 (73.2%) | 31 (70.5%) | ||||
| AMA (+) | 4 (5.1%) | 3 (7.3%) | 1 (2.3%) | 0.62 | 0.92 | 0.28 | 0.47 |
| AMA (−) | 75 (94.9%) | 38 (92.7%) | 42 (97.7%) | ||||
| Proteinuria (+) | 20 (9.2%) | 16 (12.8%) | 18 (20.5%) | 0.30 | 0.03 | 0.13 | 0.007 |
| Proteinuria (−) | 197 (90.8%) | 109 (87.2%) | 70 (79.5%) | ||||
| Anti-DNA (+) | 20 (11.9%) | 13 (14.9%) | 17 (27.4%) | 0.49 | 0.048 | 0.06 | 0.005 |
| Anti-DNA (−) | 148 (88.1%) | 74 (85.1%) | 45 (72.6%) | ||||
| Hypocomplementemia | 43 (25.9%) | 27 (28.7%) | 28 (41.8%) | 0.62 | 0.10 | 0.08 | 0.02 |
| Normal Complement | 123 (74.1%) | 67 (71.3%) | 39 (58.2%) | ||||
| WBC <4000 K/ul | 6 (2.8%) | 2 (1.6%) | 8 (8.9%) | 0.49 | 0.30 | 0.01 | 0.02 |
| WBC > 4000/ul | 211 (97.2%) | 124 (99.2%) | 82 (91.1%) | ||||
| Platelet <100,000/ul | 6 (2.8%) | 7 (5.6%) | 12 (13.3%) | 0.17 | 0.007 | 0.047 | 0.0003 |
| Platelet >100,000/ul | 211 (97.2%) | 119 (94.4%) | 78 (86.7%) | ||||
| APS (+) | 28 (14.0%) | 20 (17.0%) | 25 (30.0%) | 0.52 | 0.038 | 0.039 | 0.0025 |
| APS (−) | 171 (86.0%) | 98 (83.0%) | 58 (70.0%) |
Not only was the prevalence of SLE disease activity markers increased in LD patients, but AST and ALT were also significantly correlated with the lupus biomarkers (Fig. 2). AST levels were positively correlated with anti-DNA titers (r = 0.34, p < 0.0001, Fig. 2A). Along this line, LD patients also had higher anti-DNA antibody titers (LD: 114.8 U/ml ± 32.8; normal: 55.7 U/ml ± 11.8; p = 0.03; Fig. 2B). C3 values negatively correlated with both AST and ALT (Fig. 2C). Additionally, C3 was significantly lower in LD than iLD subjects (LD: 106.8 mg/dL ± 5.3; iLD: 119.4 mg/dL ± 3.7; p = 0.044; Fig. 2D). When the different SLE biomarkers were compared to one another, C3 and C4 were negatively correlated with anti-DNA antibody titers (Fig. S1: C3: r = −0.17, p = 0.004; C4: r = −0.13, p = 0.03). As expected, the prevalence of proteinuria (N0.5 g/day) was significantly higher in anti-DNA-positive patients (p = 0.0030; Table S2). APS was more common in patients with LD relative to those with iLD (p = 0.0390) or normal LFT (p = 0.0025; Table 3).
Fig. 2.
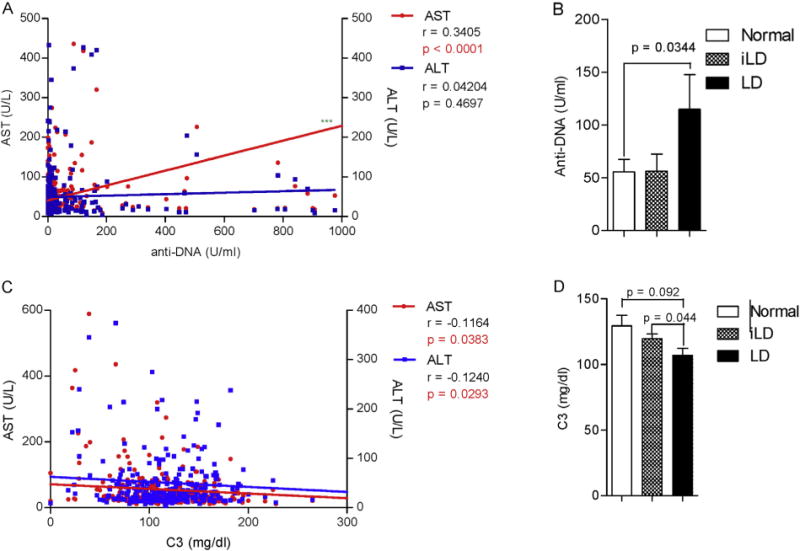
Increased production of anti-DNA autoantibodies and hypocomplementemia in lupus patients with LD. A) Correlation of AST but not ALT with anti-DNA. B) Increased anti-DNA production in SLE patients with LD. C) Correlation of C3 with AST and ALT. D) C3 hypocomplementemia in SLE patients with LD. Pearson r values and corresponding two-tailed p values are indicated for correlation dot plots. Data represent mean ± SEM in bar charts; p values indicate comparison with two-tailed unpaired t-test.
3.3. LD was correlated with use of azathioprine, cyclophosphamide, cyclosporin A and prednisone treatment
Use of azathioprine (AZA; p = 0.0460), prednisone (PRED; p = 0.0002), cyclophosphamide (CTX; p = 0.0300), and cyclosporine A (CsA; p = 0.0261) was all increased in patients with LD (Table 4). In comparison to subjects with normal LFT, those with iLD or LD showed a greater use of azathioprine (AZA; p = 0.0200) and prednisone (p = 0.0020). Use of mycophenolic mofetil (MMF; p = 0.0300), prednisone (p = 0.03), and CsA (p = 0.0020) was also increased in LD subjects relative to those with iLD. Use of rapamycin (Rapa) was not different between patients with LD, iLD, or normal LFT. However, when these traditional immunosuppressant medications were compared between patients with normal LFT and LD, an absence of LD was noted in patients receiving Rapa relative to AZA (two-tailed Fisher’s exact test p = 0.0237), CsA (two-tailed p = 0.0060), and CTX (two-tailed p = 0.0047; Table S3). An absence of LD was also noted in patients treated with NAC relative to CsA (two-tailed p = 0.0164) and CTX (two-tailed p = 0.0143; Table S3). These findings suggest that Rapa and NAC may prevent LD in SLE. However, due to the small numbers of patients treated with Rapa and NAC, these results should be viewed with caution and considered tentative only, which require confirmatory follow-up studies. NSAID use was reduced in patients with LD in comparison to those without (p = 0.02; Table 4).
Table 4.
Relationship of medication use to LD in SLE. p values reflect two-tailed χ2 test. p values <0.05 are in italics.
| Normal (N) | iLD | LD | pN vs. iLD | pN vs. iLD + LD | piLD vs. LD | pN vs. LD | |
|---|---|---|---|---|---|---|---|
| HCQ (+) | 109 (50.0%) | 56 (44.8%) | 37 (41.1%) | 0.35 | 0.16 | 0.59 | 0.16 |
| HCQ (−) | 109 (50.0%) | 69 (55.2%) | 53 (58.9%) | ||||
| MMF (+) | 21 (9.6%) | 8 (6.4%) | 15 (16.65%) | 0.42 | 0.75 | 0.023 | 0.08 |
| MMF (−) | 197 (90.4%) | 117 (93.6%) | 74 (83.3%) | ||||
| MPA (+) | 9 (4.1%) | 8 (6.4%) | 3 (3.3%) | 0.35 | 0.62 | 0.31 | 0.74 |
| MPA (−) | 209 (95.9%) | 117 (93.6%) | 87 (96.7%) | ||||
| AZA (+) | 6 (2.8%) | 9 (7.2%) | 7 (7.8%) | 0.053 | 0.02 | 0.87 | 0.046 |
| AZA (−) | 212 (97.2%) | 116 (92.8%) | 83 (92.2%) | ||||
| PRED (+) | 52 (23.9%) | 39 (31.2%) | 41 (45.6%) | 0.14 | 0.002 | 0.03 | 0.0002 |
| PRED (−) | 166 (76.1%) | 86 (68.8%) | 49 (54.4%) | ||||
| MTX (+) | 12 (5.5%) | 13 (10.4%) | 5 (5.6%) | 0.09 | 0.23 | 0.21 | 0.99 |
| MTX (−) | 206 (94.5%) | 112 (89.6%) | 85 (94.4%) | ||||
| CTX (+) | 0 (0.0%) | 1 (0.8%) | 2 (2.2%) | 0.19 | 0.08 | 0.38 | 0.03 |
| CTX (−) | 218 (100%) | 124 (99.2%) | 88 (97.8%) | ||||
| CsA (+) | 1 (0.5%) | 0 (0%) | 4 (4.4%) | 1.00 | 0.213 | 0.0287 | 0.0269 |
| CsA (−) | 217 (99.5%) | 125 (100%) | 86 (95.6%) | ||||
| Rapa (+) | 6 (2.8%) | 4 (3.3%) | 0 (0%) | 1.00 | 0.75 | 0.141 | 0.1858 |
| Rapa (−) | 212 (97.2%) | 121 (96.7%) | 90 (100%) | ||||
| NAC (+) | 4 (1.8%) | 2 (1.6%) | 0 (0%) | 0.87 | 0.64 | 0.76 | 0.65 |
| NAC (−) | 214 (98.2%) | 123 (98.4%) | 90 (100%) | ||||
| Rituximab (+) | 1 (0.5%) | 1 (0.8%) | 0 (0%) | 0.69 | 0.99 | 0.40 | 0.52 |
| Rituximab (−) | 217 (99.5%) | 124 (99.2%) | 90 (100%) | ||||
| Anti-TNF (+) | 0 (0%) | 1 (0.8%) | 1 (1.1%) | 0.19 | 0.15 | 0.81 | 0.12 |
| Anti-TNF (−) | 218 (100%) | 124 (99.2%) | 89 (98.9%) | ||||
| NSAIDs (+) | 86 (39.4%) | 44 (35.2%) | 23 (25.6%) | 0.435 | 0.07 | 0.13 | 0.02 |
| NSAIDs (−) | 132 (50.6%) | 81 (64.8%) | 67 (74.4%) |
Abbreviations: AZA, azathioprine; CsA, cyclosporine A; CTX, cyclophosphamide; HCQ, hydroxychloroquine, MMF, mycophenolate mofetil; MPA, mycophenolic acid; NAC, N-acetylcysteine; NSAID, non-steroidal anti-inflammatory drug; PRED, prednisone; Rapa, rapamycin/sirolimus; Anti-TNF, tumor necrosis factor blocker.
3.4. Resolution of LD is associated with increased prednisone use and diminished SLEDAI
To evaluate the potential mechanisms of LD, patients were followed longitudinally until LFTs normalized. Upon follow-up, LFTs normalized in 76 of 90 (84.4%) LD patients (two tailed Fisher’s exact test p < 0.0001). The normalization required 12.1 ± 2.6 months. At the peak of LD, SLEDAI correlated with AST (Pearson’s r = 0.4796; p < 0.0001) and, to a lesser extent, with ALT (Pearson’s r = 0.2680; p = 0.0283; Fig. 3A). Upon normalization of LFTs, SLEDAI scores were reduced from 8.8 ± 0.9 to 5.2 ± 0.9 (p = 0.001; Fig. 3B). SLEDAI scores without anti-DNA or hypocomplementemia were also reduced from 7.6 ± 1.0 to 4.4 ± 0.9 (p = 0.032; Fig. 3C). Although hypocomplementemia was not significantly affected (data not shown), anti-DNA titers were also reduced with normalization of LFT (two-tailed p = 0.079; Fig. 3D).
Fig. 3.
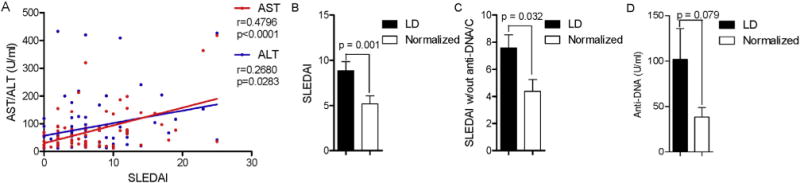
Reduction of SLEDAI with reversal of LD in patients with SLE. A) Correlation of SLEDAI with AST and ALT in lupus patients with LD. Pearson r values and corresponding two-tailed p values are indicated. B) Assessment of disease activity by SLEDAI in LD patients with normalized LFT. C) Modified SLEDAI scores with exclusion of anti-DNA and complement values in patients with LD upon normalization of LFTs. D) Diminished anti-DNA antibody production in LD patients upon normalization of LFTs. Data represent mean ± SEM. p values indicate comparison with two-tailed paired t-test.
Given that LD was associated with increased disease activity and a greater need for immunosuppressants, we examined medication use at study visits preceding and following ≥2-fold elevation of AST or ALT. Normalization of LFTs was not associated with introduction or discontinuation of immunosuppressive medications. Among LD patients, 7/7 remained on AZA, 1 additional patient received CTX, and 2 additional patients were given CsA when LFTs normalized. The only statistically significant difference between LD patients and their normalized states was an increase in prednisone use (Table 5). Thus, a greater proportion of LD patients was taking prednisone in their normalized state (p = 0.043; Table 5). Given that this study was not an interventional clinical trial, no formal pill counts of medications were conducted. Therefore, cumulative prednisone doses could not be reliably determined. Reversal of liver disease was associated with introduction of rapamycin in two patients and NAC in one patient, however, these differences was not significant (Table 5). 7/14 patients whose ≥2-fold elevated LFTs failed to normalize had imaging studies. 2 patients had abdominal computer to-mogram (CT) study that revealed liver metastasis secondary to lung cancer, 1 patient had sonogram indicating steatosis of the liver, while the remaining subjects had normal imaging studies.
Table 5.
Medication changes with normalization of LD in SLE. p values reflect two-tailed χ2 test. p values <0.05 are in italics.
| Patient count | LD | Normalized | p |
|---|---|---|---|
| Hydroxychloroquine (+) | 37 | 32 | 0.90 |
| Hydroxychloroquine (−) | 53 | 44 | |
| Mycophenolic mofetil (+) | 14 | 12 | 0.97 |
| Mycophenolic mofetil (−) | 76 | 64 | |
| Mycophenolic acid (+) | 3 | 2 | 0.79 |
| Mycophenolic acid (−) | 87 | 74 | |
| Azathioprine (+) | 7 | 7 | 0.74 |
| Azathioprine (−) | 83 | 69 | |
| Prednisone (+) | 41 | 47 | 0.043 |
| Prednisone (−) | 49 | 29 | |
| Methotrexate (+) | 5 | 3 | 0.63 |
| Methotrexate (−) | 85 | 73 | |
| Cyclophosphamide (+) | 2 | 3 | 0.52 |
| Cyclophosphamide (−) | 88 | 73 | |
| Cyclosporine (+) | 4 | 6 | 0.75 |
| Cyclosporine (−) | 85 | 83 | |
| Rapamycin (+) | 0 | 2 | 0.155 |
| Rapamycin (−) | 90 | 88 | |
| N-acetylcysteine (+) | 0 | 1 | 1.00 |
| N-acetylcysteine (−) | 90 | 89 | |
| Rituximab (+) | 0 | 0 | NA |
| Rituximab (−) | 90 | 76 | |
| Anti-TNF (+) | 1 | 0 | 0.36 |
| Anti-TNF (−) | 89 | 76 | |
| NSAIDs (+) | 23 | 12 | 0.12 |
| NSAIDs (−) | 67 | 64 |
3.5. Histological evidence of inflammation in the liver of patients with SLE
Liver biopsy was performed in four SLE patients with LD. In two of the patients, only mild lymphocytic infiltrations were noted (data not shown). In one of these two patients, LFTs normalized in 6 months with administration of HCQ alone. In a second patient with patchy lymphoid infiltrates, LFTs normalized in 13 months with administration of HCQ and MMF. In a third patient with a >2-fold elevation of AST at 85, an ALT at 65, an increased SMA titer at 1:1250, and an elevated anti-DNA at 157 (normal: ≤99 U/mL), liver biopsy revealed chronic portal inflammation with infiltrating eosinophils, lymphocytes and plasma cells as well as macro and microvesicular steatosis (Fig. S2). LFTs normalized with administration of HCQ and MMF. Liver histology in a fourth patient demonstrated extensive inflammation with lymphocytic, plasma cell and eosinophilic infiltration both in hematoxylin and eosin and trichrome stained sections (Figs. S3A–C). Reticulin staining showed that tissue architecture was disrupted in areas of lymphocyte invasion (Fig. S3D). Mitotic figures and apoptotic hepatocytes were detected (Figs. S3E and F). Lastly, bile duct proliferation was observed in areas of lymphocytic infiltration (Figs. S3G and H). These findings were consistent with aggressive autoimmune hepatitis [20,21]. The liver pathology occurred with elevation of AST at 1438 U/L (normal: ≤35 U/L) and active SLE, as evidenced by malar rash, arthritis, elevated anti-DNA of 1308 U/ml (normal: ≤99 U/ml) and SMA at 1:1250. High-dose prednisone of 60 mg/day, azathioprine (100 mg/day), mycophenolate mofetil (1.5 g/day), and hydroxychloroquine (400 mg/day) were all used in this patient over more than 2 years without any benefit. However, after 6 months of rapamycin treatment (2 mg/day), the LFTs began to normalize, as demonstrated by an AST value of 32 U/L and ALT value of 47 U/L, and prednisone could be tapered to 10 mg/day.
4. Discussion
The liver is often overlooked as a target organ in SLE, and its pathologies are usually considered rare [22] and secondary to toxicity of therapies [5,23] or, less commonly, to disease activity of SLE [3,4]. Significant liver disease is generally regarded as unusual in SLE and not a major cause of mortality [24] despite the fact that elevated liver enzymes are frequently encountered [3]. After exclusion of infectious and metabolic causes, such as thyroid disease, 49.7% of our SLE cohort had iLD with one elevated transaminase and 20.7% of SLE patients had LD with a 2-fold elevation of AST or ALT. The AST/ALT ratio of LD patients was not significantly different from that in patients with normal LFTs (LD: 1.26 ± 0.11; normal: 1.18 ± 0.03; p = 0.32), but it did confirm that our study successfully excluded patients with alcoholic hepatitis, which would have exhibited AST/ALT ratio >2.0 [6,7]. Our results suggest that LD is a consequence of SLE, as LFTs strongly correlated with biomarkers of disease activity, and the normalization of LFTs in 76/91 patients occurred with maintenance of immunosuppressant regimens and additional treatment with prednisone. Therefore, abnormal LFTs alone should not be a justification to withhold immunosuppressive treatment, especially when SLE is active. Our findings concur with a smaller retrospective study from Italy [25], which also suggested that LD respond to prednisone in patients with SLE. Nevertheless, it’s important to state that these associations of improved LFT with diminished disease activity upon prednisone use do not necessarily prove causality.
AST but not ALT remarkably correlated with elevated anti-DNA in this study. Anti-DNA has been previously associated with chronic liver diseases [26]. Elevated AST relative to ALT has been associated with alcoholic hepatitis as well as progression of chronic viral hepatitis to cirrhosis [8,27]. Recently, we noted an elevation of AST but not ALT in liver disease caused by predisposition to oxidative stress-induced necrotic cell death in transaldolase deficiency [28]. Necrotic cell death is overall increased in SLE patients due to oxidative stress-induced mTOR-dependent expansion of CD3+CD4−CD8− double-negative (DN) T cells [29,30]. These T cells also play critical roles in pathogenesis of SLE patients [31]. Importantly, DN T cells are expanded in the liver of lupus-prone mice [32,33]. In turn, mTOR blockade with rapamycin [29, 34] or NAC reduces the expansion of DN T cells and production of anti-DNA [35]. Given that reactive oxygen intermediates propagate via high diffusible aldehydes through the bloodstream in SLE [36], they may also underlie the disease-activity related elevation of AST rather than ALT in SLE. Oxidative stress in the liver causes the elevation of AST over ALT [28]. Thus, increased AST may be related to oxidative stress-driven autoantigenesis in SLE [36]. This includes the oxidative modification of DNA that is detectable in circulating immune complexes of patients with SLE [37]. Thus, oxidized DNA released from the injured liver may serve as a danger signal and trigger of anti-DNA in SLE [38]. In turn, the increased production of leptin, which may originate from stellate cells in the liver [39], contributes to T-cell hyper-reactivity in SLE [40].
The decrease in the number of significant laboratory values after combining iLD and LD into one group shows that the iLD cohort dilutes the differences between normal and LD patients. Our regression analysis demonstrates a significant positive correlation between LFTs and anti-DNA antibodies and a negative correlation between LFTs and C3. These results are consistent with our parametric (t-test) and binomial (χ2) analysis showing that LD patients are more likely to be positive for anti-DNA antibodies and hypocomplementemia. The lack of correlation between LFTs and C4 levels can be attributed to genetic causes that commonly underlie the deficiency of this complement factor in SLE [41].
A retrospective study of 206 SLE patients found a similar, 20.9%, rate of liver disease in 1980 [52]. While this study utilized stricter criteria, requiring 4 separate determinations of 2-fold increase in either total bilirubin, AST, ALT, lactate dehydrogenase, or alkaline phosphatase, it did not exclude alcoholic and viral hepatitis [52]. The incidence of mucosal ulcers, cytopenia, and thyroid disease was significantly higher, while arthralgia was significantly less common in the group with liver disease [52]. It is conceivable that infection by hepatitis virus or thyroid disease contributed to the disease manifestations in the latter study [52]. In contrast, our study excluded alcoholic and viral hepatitis as well as thyroid disease, because increased serum TSH is often seen in liver cirrhosis [60, 61]. We also excluded hepatitis viruses A, B, and C as well as HIV and parvovirus B19 in our cohort, because the pathologies of these infections can mimic the presentation of SLE [59]. Thus, by excluding infectious and metabolic causes, we found the prevalence of anti-DNA antibodies, hypocomplementemia, SMA, leucopenia, thrombocytopenia, and proteinuria as well as SLEDAI to be markedly increased in SLE patients with LD in comparison to SLE patients with no liver involvement. In contrast to several earlier retrospective studies summarized in Table S4, these findings strongly support the notion that LD is primarily a consequence of disease activity in SLE.
Another retrospective study of liver enzyme patterns in 81 patients with SLE from 1981 documented a 55% prevalence of abnormal LFTs [42]. Excluding salicylate toxicity, alcohol abuse, and viral hepatitis cut the prevalence to 23% of patients who had no explanation for abnormal LFTs other than SLE [42]. After filtering out patients with less than a 2-fold elevation in LFTs, only 8.6% of these SLE patients met our criteria for LD [42], which is significantly lower than the 20.7% LD prevalence documented in this study. A prospective study from 1984 found elevated LFTs in 61 of 260 SLE patients, however, 40 of the 61 patients with elevated LFTs had a documented non-SLE liver pathology or toxicity [53]. Based on our study’s criteria, only 10% of these SLE patients had elevated LFTs [53], which is significantly lower than the 49.8% prevalence rate of elevated AST or ALT found in our study.
Our study has been initiated to determine the causes of liver disease with a focus on the contributions of SLE disease activity and medication us. This initiative was prompted by the common dilemma that the clinician face in daily practice with respect to handling of liver enzyme elevations. Recent studies set the threshold for drug-induced liver injury at a 2-fold elevation of ALT or AST, depending on the patient population involved [57,58]. In immunocompromised patients, such as those infected by HIV or HCV, the threshold was set at a 2-fold elevation of ALT or AST [57,58]. Our results clearly suggest that such enzyme elevation may represent a manifestation of lupus disease activity and may respond to continued immunosuppression and introduction of prednisone rather than caused by drug toxicity.
Alternatively, a recent comprehensive study assessed the causes of chronic liver disease in Canadian patients with SLE. Here, subjects with ≥1.5 times elevated AST and/or ALT on 2 consecutive visits within a 2-year span were included [43]. Among 1533 patients reviewed, 134 (8.7%) met the inclusion criteria. Compared to controls, cases were higher in BMI, anti-DNA antibody, prevalence of hypertension, antiphospholipid syndrome, and use of immunosuppressive medication, especially azathioprine and methotrexate; they were lower in IgM. Although this study had different goals, the association of LFT elevation with anti-DNA and APLA is in agreement with our findings. It has not been documented whether anti-DNA was higher in patients with AST or ALT elevation [43]. Although our study has been initiated with the goal that was to help with decision making of clinicians facing ≥2-fold elevation of ALT or AST in patients with SLE, which is commonly considered as a sign of drug-induced liver injury [57,58], we also examined other potential causes of chronic liver disease unrelated to SLE in our cohort. The available records of 7/14 patients whose ≥2-fold elevated LFTs failed to normalize revealed 2 patients with liver metastasis secondary to lung cancer and 1 patient with steatosis of the liver, while the remaining subjects had normal imaging studies. These analyses suggest that a single ≥2-fold elevation of ALT or AST in patients with SLE commonly represents a treatable manifestation of lupus activity rather than chronic liver disease.
A retrospective study from 2014, which excluded patients with alcohol abuse and viral hepatitis, reported any elevation in one LFT test in 9.3% (47/504) of SLE patients in Guangzhou, China [51]. This is significantly lower that the prevalence of liver disease in our cohort, which corresponds to 49.7% in our lupus population with iLD and LD that included all patients with any elevation of AST or ALT (216/435; two-tailed χ2 p < 0.0001). In this Chinese study, SLEDAI values were similar in patients with or without LFT elevation, nevertheless, liver disease was more common in patients with SLEDAI >4, and those with elevated anti-DNA or hypocomplementemia [51]. Therefore, despite the markedly lower prevalence, LFT elevation also appears to be a consequence of lupus disease activity in China [51]. In contrast, another study from 2013 showed LD in 59.7% of SLE patients in Japan [54]. In this study, LD was defined as an elevation of any two of the following enzymes: AST, ALT, γ-glutamyl transpeptidase (GGT), or alkaline phosphatase [54]. The slightly greater prevalence of liver disease may be attributed to the inclusion of elevated gamma-glutamyl transferase or alkaline phosphatase because these markers have been implicated in extrahepatic biliary pathologies [44,45]. Notably, similar to our study, LD was also more common in Japanese males than females with SLE [54]. In a recent study of MRL/lpr mice prior to lupus disease onset, mitochondrial dysfunction was found in the liver to be more severe in males than females [46]. Thus, more investigation is warranted to determine why males with SLE are more at risk for developing LD and whether this results from mitochondrial dysfunction.
Despite the fact that the liver possesses critical roles in the immune system, including autoimmunity [47], the relationship between SLE and this organ is not well characterized. Given the fundamental role of the liver in metabolism, which has been also recognized as a regulator of immune responses [48,49], the injury of this organ may contribute to pathogenesis in SLE. In comparison to 42 matched healthy subjects, me-tabolome changes in peripheral blood lymphocytes (PBL) of 36 lupus patients have recently unveiled a prominent impact on the pentose phosphate pathway, which reflects a greater demand for nucleotides and oxidative stress [50]. Among 42 metabolites, which exhibited altered concentration in lupus PBL, adenosine was reduced by 54% in 13 of these patients, who also had liver disease, with respect to patients with normal LFTs (two-tailed t-test raw p = 0.000093; p = 0.031 after Bonferroni-correction for 34 significantly changed metabolites in SLE). Notably, adenosine has significant anti-inflammatory properties [51], including an inhibitory effect on the development of SLE [52–55]. Given that adenosine is produced and released into the bloodstream by hepatocytes [56], it may represent a potential metabolic link between liver disease and SLE.
In the current study, anti-DNA, hypocomplementemia, proteinuria, thrombocytopenia, and leukopenia as well as SLEDAI disease activity scores were significantly associated with LD, which therefore appears to be a component of pathogenesis at least in a subset of patients. This notion is further supported by a resolution of LD upon continued treatment with immunosuppressants and increased use of prednisone. In our cohort, no patient was found to have primary biliary cirrhosis, which involves the autoimmune destruction of intra-hepatic biliary ducts and thus leads to cholestasis and cirrhosis [57]. AMA is rarely detected in healthy individuals, but it is found in over 90% of primary biliary cirrhosis patients [57]. In our study, LD was not associated with the presence of AMA. On the other hand, SMA was associated with LD in our lupus cohort, which implies that autoimmune hepatitis is a manifestation of SLE. Indeed, AIH and SLE have been documented to possess several overlapping serological markers and clinical presentations, including positive ANA, SMA, and poly-arthritis [58,59]. Although the specificity of SMA for autoimmune hepatitis is high, its sensitivity is only moderate [60]. Thus, the sole presence of a positive SMA is insufficient to confirm the presence of AIH as a confounding factor in SLE. Nevertheless, all of our four SLE patients with biopsy-proven AIH also had SMA. While one LD patient had mild AIH on biopsy and responded to the introduction of HCQ alone, two patients with AIH only responded to a combination treatment with HCQ and MMF. In contrast, a 4th patient with AIH revealed severe inflammation and 50-fold elevated AST, and she only improved upon treatment with rapamycin (sirolimus). Along these lines, a conspicuous absence of prior exposure to rapamycin was noted in LD patients relative to other immunosuppressants, such AZA, CsA, and CTX. This is consistent with the documented effectiveness of rapamycin in SLE [29,34] and AIH [61–63]. There was also a conspicuous absence of LD in patients treated with NAC relative to those treated with CsA or CTX. However, the significance of these findings is limited due to the small numbers of patients on any given medication and the retrospective nature of this analysis. LD, as defined in this study, did not develop in any of the patients enrolled in prospective clinical trials with rapamycin [29] or NAC [35]. Given that NAC has well-established hepato-protective effects [64–66], and it showed safety and clinical efficacy in a double-blind placebo-controlled pilot study of 3-month duration, follow-up studies of longer duration are clearly warranted in SLE patients [35]. Although our study suggest that LD may be more common than generally perceived, liver biopsy does not appear to be routinely justified given the overwhelming responsiveness to persistent immunosuppression and administration of prednisone. Nevertheless, the facts that only 4 of our patients have undergone liver biopsy, two of whom showed aggressive hepatitis, indicate that significant liver disease is rare in SLE.
NSAIDs were used more frequently in patients with normal LFTs. While NSAIDs are commonly employed to treat mild arthritis in SLE, they can elicit liver injury [67]. Therefore, we associate the inverse correlation between LD and NSAID use with a purposeful avoidance and lack of effectiveness of this therapy in patients with more severe lupus.
Interestingly, hepatocellular carcinoma (HCC) has increased prevalence in SLE with an elevated standardized incidence ratio of 1.7 [68] to 2.6 [69]. The pathogenesis of HCC is characterized by chronic inflammation driven by glutathione depletion and oxidative stress [28,70], which have also been documented in patients with SLE [36,71,72]. Interestingly, APS was significantly more common in our lupus cohort with LD (Table 3), which concurs with meta-analyses of liver involvement in patients with APS [73,74]. Mitochondrial mass and oxidative stress are increased in PBL of lupus patients with APS [30]. Along these lines, NAC, a precursor of glutathione and potent antioxidant, was found to be beneficial for liver dysfunction [28] as well as SLE [35]. Therefore, further studies aimed at delineating common mechanisms underlying oxidative stress in liver disease and SLE appear to be justified. It is conceivable that NAC may be particularly beneficial in SLE patients with liver disease.
Supplementary Material
Acknowledgments
Funding
This work was supported in part by grants AI072648 and DK078922 from the National Institutes of Health.
Abbreviations
- AIH
autoimmune hepatitis
- AMA
anti-mitochondrial antibody
- Anti-DNA
anti-double stranded DNA antibody
- ANA
antinuclear antibody
- Anti-TNF
tumor necrosis factor blocker
- ALT
alanine aminotransferase
- APLA
anti-phospholipid antibody
- APS
anti-phospholipid syndrome
- AST
aspartate aminotransferase
- AZA
azathioprine
- BMI
body mass index
- C3
complement factor
- C4
complement factor 4
- CPK
creatine phosphokinase
- CsA
cyclosporine A
- CTX
cyclophosphamide
- HCQ
hydroxychloroquine
- HBV
hepatitis B virus
- HCC
hepatocellular carcinoma
- HCV
hepatitis C virus
- HIV
human immunodeficiency virus
- iLD
intermediate liver disease
- LD
liver disease (LD)
- LFT
liver function test
- MMF
mycophenolate mofetil
- MPA
mycophenolic acid
- mTOR
mechanistic target of rapamycin
- NAC
N-acetylcysteine
- NSAID
non-steroidal anti-inflammatory drug
- PBL
peripheral blood lymphocytes
- PRED
prednisone
- Rapa
rapamycin/sirolimus
- SLE
systemic lupus erythematosus
- SLEDAI
systemic lupus erythematosus disease activity index
- SMA
anti-smooth muscle antibody
- TSH
thyroid-stimulating hormone
- WBC
white blood cell
Appendix A. Supplementary data
Supplementary data to this article can be found online at http://dx.doi.org/10.1016/j.clim.2015.07.001.
Footnotes
Contributorship statement
All authors contributed meaningfully to this study.
Competing interests
The authors have no competing interests.
Ethical approval information
This study has been approved for protection of human subjects by the SUNY IRB.
Data sharing statement
All data have been submitted either in the main body of the manuscript or in the supplemental materials section.
References
- 1.Perl A. Systems biology of lupus: mapping the impact of genomic and environmental factors on gene expression signatures, cellular signaling, metabolic pathways, hormonal and cytokine imbalance, and selecting targets for treatment. Autoimmunity. 2010;43:32–47. doi: 10.3109/08916930903374774. [DOI] [PMC free article] [PubMed] [Google Scholar]
- 2.Zheng RH, Wang JH, Wang SB, Chen J, Guan WM, Chen MH. Clinical and immunopathological features of patients with lupus hepatitis. Chin Med J. 2013;126:260–266. [PubMed] [Google Scholar]
- 3.Runyon BA, LaBrecque DR, Anuras S. The spectrum of liver disease in systemic lupus erythematosus. Report of 33 histologically-proved cases and review of the literature. Am J Med. 1980;69:187–194. doi: 10.1016/0002-9343(80)90378-2. [DOI] [PubMed] [Google Scholar]
- 4.Miller MH, Urowitz MB, Gladman DD, Blendis LM. The liver in systemic lupus erythematosus. Q J Med. 1984;53:401–409. [PubMed] [Google Scholar]
- 5.Takahashi A, Abe K, Saito R, Iwadate H, Okai K, Katsushima F, Monoe K, Kanno Y, Saito H, Kobayashi H, Watanabe H, Ohira H. Liver dysfunction in patients with systemic lupus erythematosus. Intern Med. 2013;52:1461–1465. doi: 10.2169/internalmedicine.52.9458. [DOI] [PubMed] [Google Scholar]
- 6.Limdi JK, Hyde GM. Evaluation of abnormal liver function tests. Postgrad Med J. 2003;79:307–312. doi: 10.1136/pmj.79.932.307. [DOI] [PMC free article] [PubMed] [Google Scholar]
- 7.Nyblom H, Berggren U, Balldin J, Olsson R. High AST/ALT ratio may indicate advanced alcoholic liver disease rather than heavy drinking. Alcohol Alcohol. 2004;39:336–339. doi: 10.1093/alcalc/agh074. [DOI] [PubMed] [Google Scholar]
- 8.Yang JJ, Huang CH, Liu CE, Tang HJ, Yang CJ, Lee YC, Lee KY, Tsai MS, Lin SW, Chen YH, Lu PL, Hung CC. Multicenter study of trimethoprim/sulfamethoxazole-related hepatotoxicity: incidence and associated factors among HIV-infected patients treated for Pneumocystis jirovecii pneumonia. PLoS One. 2014;9:e106141. doi: 10.1371/journal.pone.0106141. [DOI] [PMC free article] [PubMed] [Google Scholar]
- 9.Mikl J, Sulkowski MS, Benhamou Y, Dieterich D, Pol S, Rockstroh J, Robinson PA, Ranga M, Stern JO. Hepatic profile analyses of tipranavir in Phase II and III clinical trials. BMC Infect Dis. 2009;9:203. doi: 10.1186/1471-2334-9-203. [DOI] [PMC free article] [PubMed] [Google Scholar]
- 10.Perl A. Mechanisms of viral pathogenesis in rheumatic diseases(Invited Review) Ann Rheum Dis. 1999;58:454–461. doi: 10.1136/ard.58.8.454. [DOI] [PMC free article] [PubMed] [Google Scholar]
- 11.Wu Y, You S, Zang H, Liu H, Mao Y, Mao P, Zhu B, Xu J, Xie G, Guo J, Li D, Xin S, Wan Z. Usefulness of serum thyroid-stimulation hormone (TSH) as a prognostic indicator for acute-on-chronic liver failure. Ann Hepatol. 2015;14:218–224. [PubMed] [Google Scholar]
- 12.Green JRB, Snitcher EJ, Mowat NAG, Ekins RP, Rees LH, Dawson AM. Thyroid function and thyroid regulation in euthyroid men with chronic liver disease: evidence of multiple abnormalities. Clin Endocrinol. 1977;7:453–461. doi: 10.1111/j.1365-2265.1977.tb01337.x. [DOI] [PubMed] [Google Scholar]
- 13.Tan EM, Cohen AS, Fries JF, Masi AT, McShane DJ, Rothfield NF, Schaller JG, Talal N, Winchester RJ. The 1982 revised criteria for the classification of systemic lupus erythematosus. Arthritis Rheum. 1982;25:1271–1277. doi: 10.1002/art.1780251101. [DOI] [PubMed] [Google Scholar]
- 14.Hochberg MC. Updating the American College of Rheumatology revised criteria for the classification of systemic lupus erythematosus. Arthritis Rheum. 1997;40:1725. doi: 10.1002/art.1780400928. [DOI] [PubMed] [Google Scholar]
- 15.American Psychiatric Association. Diagnostic and Statistical Manual of Mental Disorders. American Psychiatric Publishing; Arlington, VA: 2013. [Google Scholar]
- 16.Ruhl CE, Everhart JE. Joint effects of body weight and alcohol on elevated serum alanine aminotransferase in the United States population. Clin Gastroenterol Hepatol. 2005;3:1260–1268. doi: 10.1016/s1542-3565(05)00743-3. [DOI] [PubMed] [Google Scholar]
- 17.Bonilla E, Francis L, Allam F, Ogrinc M, Neupane H, Phillips PE, Perl A. Immuno-fluorescence microscopy is superior to fluorescent beads for detection of antinuclear antibody reactivity in systemic lupus erythematosus patients. Clin Immunol. 2007;124:18–21. doi: 10.1016/j.clim.2007.04.010. [DOI] [PMC free article] [PubMed] [Google Scholar]
- 18.Miyakis S, Lockshin MD, Atsumi T, Branch DW, Brey RL, Cervera R, Derksen RH, DE Groot PG, Koike T, Meroni PL, Reber G, Shoenfeld Y, Tincani A, Vlachoyiannopoulos PG, Krilis SA. International consensus statement on an update of the classification criteria for definite antiphospholipid syndrome (APS) [see comment]. [136 refs] J Thromb Haemost. 2006;4:295–306. doi: 10.1111/j.1538-7836.2006.01753.x. [DOI] [PubMed] [Google Scholar]
- 19.Bombardier C, Gladman DD, Urowitz MB, Caron D, Chang CH. the committee on prognosis studies in SLE, Derivation of the SLEDAI. A disease activity index for lupus patients. Arthritis Rheum. 1992;35:630–640. doi: 10.1002/art.1780350606. [DOI] [PubMed] [Google Scholar]
- 20.Czaja AJ, Muratori P, Muratori L, Carpenter HA, Bianchi FB. Diagnostic and therapeutic implications of bile duct injury in autoimmune hepatitis. Liver Int. 2004;24:322–329. doi: 10.1111/j.1478-3231.2004.0924.x. [DOI] [PubMed] [Google Scholar]
- 21.Gatselis NK, Zachou K, Koukoulis GK, Dalekos GN. Autoimmune hepatitis, one disease with many faces: etiopathogenetic, clinico-laboratory and histological characteristics. World J Gastroenterol. 2015;21:60–83. doi: 10.3748/wjg.v21.i1.60. [DOI] [PMC free article] [PubMed] [Google Scholar]
- 22.Abraham S, Begum S, Isenberg D. Hepatic manifestations of autoimmune rheumatic diseases[see comment]. [Review] Ann Rheum Dis. 2004;63:123–129. doi: 10.1136/ard.2002.001826. [DOI] [PMC free article] [PubMed] [Google Scholar]
- 23.Selmi C, De Santis M, Gershwin ME. Liver involvement in subjects with rheumatic disease. Arthritis Res Ther. 2011;13:226. doi: 10.1186/ar3319. [DOI] [PMC free article] [PubMed] [Google Scholar]
- 24.Chowdhury VR, Crowson CS, Poterucha JJ, Moder KG. Liver involvement in systemic lupus erythematosus: case review of 40 patients. J Rheumatol. 2008;35:2159–2164. doi: 10.3899/jrheum.080336. [DOI] [PubMed] [Google Scholar]
- 25.Piga M, Vacca AF, Porru GF, Cauli AF, Mathieu A. Liver involvement in systemic lupus erythematosus: incidence, clinical course and outcome of lupus hepatitis. Clin Exp Rheumatol. 2010;28:504–510. [PubMed] [Google Scholar]
- 26.Konikoff F, Isenberg DA, Kooperman O, Kennedy RC, Rauch J, Theodor E, Shoenfeld Y. Common lupus anti-DNA antibody idiotypes in chronic liver diseases. Clin Immunol Immunopathol. 1987;43:265–272. doi: 10.1016/0090-1229(87)90134-6. [DOI] [PubMed] [Google Scholar]
- 27.Sheth SG, Flamm SL, Gordon FD, Chopra S. AST/ALT ratio predicts cirrhosis in patients with chronic hepatitis C virus infection. Am J Gastroenterol. 1998;93:44–48. doi: 10.1111/j.1572-0241.1998.044_c.x. [DOI] [PubMed] [Google Scholar]
- 28.Hanczko R, Fernandez D, Doherty E, Qian Y, Vas Gy, Niland B, Telarico T, Garba A, Banerjee S, Middleton FA, Barrett D, Barcza M, Banki K, Landas SK, Perl A. Prevention of hepatocarcinogenesis and acetaminophen-induced liver failure in transaldolase-deficient mice by N-acetylcysteine. J Clin Invest. 2009;119:1546–1557. doi: 10.1172/JCI35722. [DOI] [PMC free article] [PubMed] [Google Scholar]
- 29.Lai Z-W, Borsuk R, Shadakshari A, Yu J, Dawood M, Garcia R, Francis L, Tily H, Bartos A, Faraone SV, Phillips PE, Perl A. mTOR activation triggers IL-4 production and necrotic death of double-negative T cells in patients with systemic lupus eryhthematosus. J Immunol. 2013;191:2236–2246. doi: 10.4049/jimmunol.1301005. [DOI] [PMC free article] [PubMed] [Google Scholar]
- 30.Lai Z-W, Marchena-Mendez I, Perl A. Oxidative stress and Treg depletion in lupus patients with anti-phospholipid syndrome. Clin Immunol. 2015;158:148–152. doi: 10.1016/j.clim.2015.03.024. [DOI] [PMC free article] [PubMed] [Google Scholar]
- 31.Grammatikos AP, Kyttaris VC, Kis-Toth K, Fitzgerald LM, Devlin A, Finnell MD, Tsokos GC. A T cell gene expression panel for the diagnosis and monitoring of disease activity in patients with systemic lupus erythematosus. Clin Immunol. 2014;150:192–200. doi: 10.1016/j.clim.2013.12.002. [DOI] [PMC free article] [PubMed] [Google Scholar]
- 32.Ohteki T, Seki S, Abo T, Kumagai K. Liver is a possible site for the proliferation of abnormal CD3+4−8− double-negative lymphocytes in autoimmune MRL-lpr/lpr mice. J Exp Med. 1990;172:7–12. doi: 10.1084/jem.172.1.7. [DOI] [PMC free article] [PubMed] [Google Scholar]
- 33.Masuda T, Ohteki T, Abo T, Seki S, Nose M, Nagura H, Kumagai K. Expansion of the population of double negative CD4−8− Talpha/beta-cells in the liver is a common feature of autoimmune mice. J Immunol. 1991;147:2907–2912. [PubMed] [Google Scholar]
- 34.Fernandez D, Bonilla E, Mirza N, Niland B, Perl A. Rapamycin reduces disease activity and normalizes T-cell activation-induced calcium fluxing in patients with systemic lupus erythematosus. Arthritis Rheum. 2006;54:2983–2988. doi: 10.1002/art.22085. [DOI] [PMC free article] [PubMed] [Google Scholar]
- 35.Lai Z-W, Hanczko R, Bonilla E, Caza TN, Clair B, Bartos A, Miklossy G, Jimah J, Doherty E, Tily H, Francis L, Garcia R, Dawood M, Yu J, Ramos I, Coman I, Faraone SV, Phillips PE, Perl A. N-acetylcysteine reduces disease activity by blocking mTOR in T cells of lupus patients. Arthritis Rheum. 2012;64:2937–2946. doi: 10.1002/art.34502. [DOI] [PMC free article] [PubMed] [Google Scholar]
- 36.Perl A. Oxidative stress in the pathology and treatment of systemic lupus erythematosus. Nat Rev Rheumatol. 2013;9:674–686. doi: 10.1038/nrrheum.2013.147. [DOI] [PMC free article] [PubMed] [Google Scholar]
- 37.Lunec J, Herbert K, Blount S, Griffiths HR, Emery P. 8-Hydroxydeoxyguanosine. A marker of oxidative DNA damage in systemic lupus erythematosus. FEBS Lett. 1994;348:131–138. doi: 10.1016/0014-5793(94)00583-4. [DOI] [PubMed] [Google Scholar]
- 38.Pisetsky DS. The origin and properties of extracellular DNA: from PAMP to DAMP. Clin Immunol. 2012;144:32–40. doi: 10.1016/j.clim.2012.04.006. [DOI] [PMC free article] [PubMed] [Google Scholar]
- 39.Saxena NK, Ikeda K, Rockey DC, Friedman SL, Anania FA. Leptin in hepatic fibrosis: evidence for increased collagen production in stellate cells and lean littermates of ob/ob mice. Hepatology. 2002;35:762–771. doi: 10.1053/jhep.2002.32029. [DOI] [PMC free article] [PubMed] [Google Scholar]
- 40.Amarilyo G, Iikuni N, Shi FD, Liu A, Matarese G, La Cava A. Leptin promotes lupus T-cell autoimmunity. Clin Immunol. 2013;149:530–533. doi: 10.1016/j.clim.2013.09.002. [DOI] [PubMed] [Google Scholar]
- 41.Boteva L, Morris D, Cortes-Hernandez J, Martin J, Vyse T, Fernando M. Genetically determined partial complement C4 deficiency states are not independent risk factors for SLE in UK and Spanish populations. Am J Hum Genet. 2012;90:445–456. doi: 10.1016/j.ajhg.2012.01.012. [DOI] [PMC free article] [PubMed] [Google Scholar]
- 42.Gibson T, Myers AR. Subclinical liver disease in systemic lupus erythematosus. J Rheumatol. 1981;8:752–759. [PubMed] [Google Scholar]
- 43.Huang D, Aghdassi E, Su J, Mosko J, Hirschfield GM, Gladman DD, Urowitz MB, Fortin PR. Prevalence and risk factors for liver biochemical abnormalities in Canadian patients with systemic lupus erythematosus. J Rheumatol. 2012;39:254–261. doi: 10.3899/jrheum.110310. [DOI] [PubMed] [Google Scholar]
- 44.Gilmore I, Garvey CJ. Investigating and imaging the liver and biliary tract. Medicine. 2007;35:5–12. [Google Scholar]
- 45.Stein TA, Burns GP, Wise L. Diagnostic value of liver function tests in bile duct obstruction. J Surg Res. 1989;46:226–229. doi: 10.1016/0022-4804(89)90061-9. [DOI] [PubMed] [Google Scholar]
- 46.Oaks Z, Telarico T, Perl A. Mitochondrial dysfunction in the liver of lupus-prone MRL/Lpr mice prior to disease onset. Arthritis Rheum. 2012;64(Suppl. 10):1455. (Ref Type: Abstract) [Google Scholar]
- 47.Bogdanos DP, Gao B, Gershwin ME. Liver immunology. Compr Physiol. 2013;3:567–598. doi: 10.1002/cphy.c120011. [DOI] [PMC free article] [PubMed] [Google Scholar]
- 48.Fernandez D, Perl A. Metabolic control of T cell activation and death in SLE. Autoimmun Rev. 2009;8:184–189. doi: 10.1016/j.autrev.2008.07.041. [DOI] [PMC free article] [PubMed] [Google Scholar]
- 49.Chi H. Regulation and function of mTOR signalling in T cell fate decisions. Nat Rev Immunol. 2012;12:325–338. doi: 10.1038/nri3198. [DOI] [PMC free article] [PubMed] [Google Scholar]
- 50.Perl A, Hanczko R, Lai ZW, Oaks Z, Kelly R, Borsuk R, Asara JM, Phillips PE. Comprehensive metabolome analyses reveal N-acetylcysteine-responsive accumulation of kynurenine in systemic lupus erythematosus: implications for activation of the mechanistic target of rapamycin. Metabolomics. 2015 doi: 10.1007/s11306-015-0772-0. in press, http://link.springer.com/article/10.1007/s11306-015-0772-0. [DOI] [PMC free article] [PubMed]
- 51.Hasko G, Linden J, Cronstein B, Pacher P. Adenosine receptors: therapeutic aspects for inflammatory and immune diseases. Nat Rev Drug Discov. 2008;7:759–770. doi: 10.1038/nrd2638. [DOI] [PMC free article] [PubMed] [Google Scholar]
- 52.Mandler R, Birch RE, Polmar SH, Kammer GM, Rudolph SA. Abnormal adenosine-induced immunosuppression and cAMP metabolism in T lymphocytes of patients with systemic lupus erythematosus. Proc Natl Acad Sci U S A. 1982;79:7542–7546. doi: 10.1073/pnas.79.23.7542. [DOI] [PMC free article] [PubMed] [Google Scholar]
- 53.Zhang L, Yang N, Wang S, Huang B, Li F, Tan H, Liang Y, Chen M, Li Y, Yu X. Adenosine 2A receptor is protective against renal injury in MRL/lpr mice. Lupus. 2011;20:667–677. doi: 10.1177/0961203310393262. [DOI] [PubMed] [Google Scholar]
- 54.Balow JE, Boumpas DT, Austin HA., III New prospects for treatment of lupus nephritis. Semin Nephrol. 2000;20:32–39. [PubMed] [Google Scholar]
- 55.Young MC, Bangs JD, Borel Y. Immune suppression to nucleosides: differences between NZB and NZW mice. Eur J Immunol. 1981;11:424–428. doi: 10.1002/eji.1830110514. [DOI] [PubMed] [Google Scholar]
- 56.Lautt WW. Regulatory processes interacting to maintain hepatic blood flow constancy: vascular compliance, hepatic arterial buffer response, hepatorenal reflex, liver regeneration, escape from vasoconstriction. Hepatol Res. 2007;37:891–903. doi: 10.1111/j.1872-034X.2007.00148.x. [DOI] [PMC free article] [PubMed] [Google Scholar]
- 57.Yamagiwa S, Kamimura H, Takamura M, Aoyagi Y. Autoantibodies in primary biliary cirrhosis: recent progress in research on the pathogenetic and clinical significance. World J Gastroenterol. 2014;20:2606–2612. doi: 10.3748/wjg.v20.i10.2606. [DOI] [PMC free article] [PubMed] [Google Scholar]
- 58.Arnett FC, Reichlin M. Lupus hepatitis: an under-recognized disease feature associated with autoantibodies to ribosomal P. Am J Med. 1995;99:465–472. doi: 10.1016/s0002-9343(99)80221-6. [DOI] [PubMed] [Google Scholar]
- 59.Bessone F, Poles N, Roma MG. Challenge of liver disease in systemic lupus erythematosus: clues for diagnosis and hints for pathogenesis. World J Hepatol. 2014;6:394–409. doi: 10.4254/wjh.v6.i6.394. [DOI] [PMC free article] [PubMed] [Google Scholar]
- 60.Zhang WC. Meta-analysis: diagnostic accuracy of antinuclear antibodies, smooth muscle antibodies and antibodies to a soluble liver antigen/liver pancreas in autoimmune hepatitis. PLoS One. 2014;9:e92267. doi: 10.1371/journal.pone.0092267. [DOI] [PMC free article] [PubMed] [Google Scholar]
- 61.Kurowski J, Melin-Aldana H, Bass L, Alonso EM, Ekong UD. Sirolimus as rescue therapy in pediatric autoimmune hepatitis. J Pediatr Gastroenterol Nutr. 2014;58:e4–e6. doi: 10.1097/MPG.0b013e318291feaa. [DOI] [PubMed] [Google Scholar]
- 62.Selvarajah V, Montano-Loza AJ, Czaja AJ. Systematic review: managing suboptimal treatment responses in autoimmune hepatitis with conventional and nonstandard drugs. Aliment Pharmacol Ther. 2012;36:691–707. doi: 10.1111/apt.12042. [DOI] [PubMed] [Google Scholar]
- 63.Larsen FS. Treatment of patients with severe autoimmune hepatitis. Minerva Gastroenterol Dietol. 2008;54:57–63. [PubMed] [Google Scholar]
- 64.Larson AM, Polson J, Fontana RJ, Davern TJ, Lalani E, Hynan LS, Reisch JS, Schiodt FV, Ostapowicz G, Shakil AO, Lee WM. Acute Liver Failure Study Group. Acetaminophen-induced acute liver failure: results of a United States multicenter, prospective study[see comment] Hepatology. 2005;42:1364–1372. doi: 10.1002/hep.20948. [DOI] [PubMed] [Google Scholar]
- 65.Singh S, Hynan LS, Lee WM. Improvements in hepatic serological biomarkers are associated with clinical benefit of intravenous N-acetylcysteine in early stage non-acetaminophen acute liver failure. Dig Dis Sci. 2013;58:1397–1402. doi: 10.1007/s10620-012-2512-x. [DOI] [PMC free article] [PubMed] [Google Scholar]
- 66.Lee WM, Hynan LS, Rossaro L, Fontana RJ, Stravitz RT, Larson AM, Vern TJ, II, Murray NG, McCashland T, Reisch JS, Robuck PR. Intravenous N-acetylcysteine improves transplant-free survival in early stage non-acetaminophen acute liver failure. Gastroenterology. 2009;137:856–864. doi: 10.1053/j.gastro.2009.06.006. [DOI] [PMC free article] [PubMed] [Google Scholar]
- 67.Francis L, Perl A. Pharmacotherapy of systemic lupus erythematosus. Expert Opin Pharmacother. 2009;10:1481–1494. doi: 10.1517/14656560902971003. [DOI] [PubMed] [Google Scholar]
- 68.Bernatsky S, Ramsey-Goldman R, Labrecque J, Joseph L, Boivin JF, Petri M, Zoma A, Manzi S, Urowitz M, Gladman D, Fortin PR, Ginzler E, Yelin E, Bae SC, Wallace DJ, Edworthy S, Jacobsen S, Gordon C, Dooley MA, Peschken CA, Hanly JG, Alarcon GS, Nived O, Ruiz-Irastorza G, Isenberg D, Rahman A, Witte T, Aranow C, Kamen DL, Steinsson K, Askanase A, Barr S, Criswell LA, Sturfelt G, Patel NM, Senecal JL, Zummer M, Pope JE, Ensworth S, El-Gabalawy H, McCar-thy T, Dreyer L, Sibley J, Pierre Y, Clarke AE. Cancer risk in systemic lupus: an updated international multi-centre cohort study. J Autoimmun. 2013;42:130–135. doi: 10.1016/j.jaut.2012.12.009. [DOI] [PMC free article] [PubMed] [Google Scholar]
- 69.Bernatsky S, Boivin JF, Joseph L, Rajan R, Zoma A, Manzi S, Ginzler E, Urowitz M, Gladman D, Fortin PR, Petri M, Edworthy S, Barr S, Gordon C, Bae SC, Sibley J, Isenberg D, Rahman A, Aranow C, Dooley MA, Steinsson K, Nived O, Sturfelt G, Alarcon G, Senecal JL, Zummer M, Hanly J, Ensworth S, Pope J, El Gabalawy H, McCarthy T, St Pierre Y, Ramsey-Goldman R, Clarke A. An international cohort study of cancer in systemic lupus erythematosus. Arthritis Rheum. 2005;52:1481–1490. doi: 10.1002/art.21029. [DOI] [PubMed] [Google Scholar]
- 70.Perl A, Hanczko R, Telarico T, Oaks Z, Landas S. Oxidative stress, inflammation and carcinogenesis are controlled through the pentose phosphate pathway by transaldolase. Trends Mol Med. 2011;7:395–403. doi: 10.1016/j.molmed.2011.01.014. [DOI] [PMC free article] [PubMed] [Google Scholar]
- 71.Gergely PJ, Grossman C, Niland B, Puskas F, Neupane H, Allam F, Banki K, Phillips PE, Perl A. Mitochondrial hyperpolarization and ATP depletion in patients with systemic lupus erythematosus. Arthritis Rheum. 2002;46:175–190. doi: 10.1002/1529-0131(200201)46:1<175::AID-ART10015>3.0.CO;2-H. [DOI] [PMC free article] [PubMed] [Google Scholar]
- 72.Fujii J, Kurahashi T, Konno T, Homma T, Iuchi Y. Oxidative stress as a potential causal factor for autoimmune hemolytic anemia and systemic lupus erythematosus. World J Nephrol. 2015;4:213–222. doi: 10.5527/wjn.v4.i2.213. [DOI] [PMC free article] [PubMed] [Google Scholar]
- 73.Asherson RA, Cervera R, Piette JC, Font J, Lie JT, Burcoglu A, Lim K, Munoz-Rodriguez FJ, Levy RA, Boue F, Rossert J, Ingelmo M. Catastrophic antiphospholipid syndrome: clinical and laboratory features of 50 patients. Medicine. 1998;77:195–207. doi: 10.1097/00005792-199805000-00005. [DOI] [PubMed] [Google Scholar]
- 74.Ambrosino P, Lupoli R, Spadarella G, Tarantino P, Di Minno A, Tarantino L, Di Minno MND. Autoimmune liver diseases and antiphospholipid antibodies positivity: a meta-analysis of literature studies. 2015;24:25–34. doi: 10.15403/jgld.2014.1121.amb. [DOI] [PubMed] [Google Scholar]
Associated Data
This section collects any data citations, data availability statements, or supplementary materials included in this article.