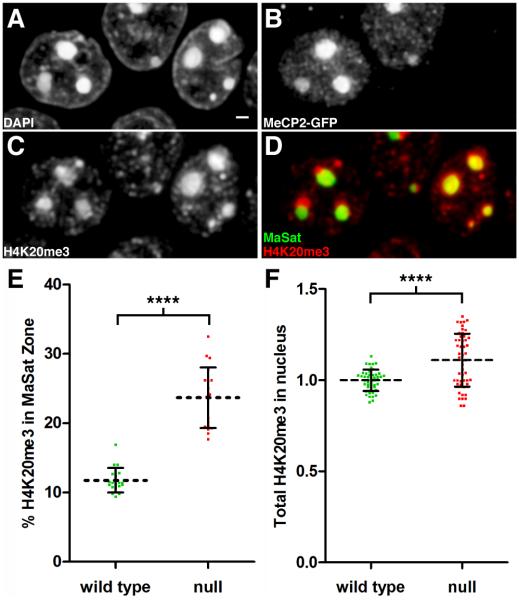
Figure 4. The H4K20me3 Modification Expands Into Pericentromeric Heterochromatin in Mecp2-Null Nuclei.
Panels A-D represent fluorescence images taken from a volume rendering through the hippocampal pyramidal cell layer. (A) DAPI staining. Scale bar, 1 μm. (B) Immunostaining for MeCP2-GFP identifies left neuron as WT and right neuron as Mecp2-null. (C) Immunostaining for H4K20me3. (D) Merged image showing H4K20me3 distribution (red) relative to major satellite FISH signal (green). In the WT neuron, H4K20me3 enriched regions are peripheral to the major satellite heterochromatin territory. (E) Scatter plot showing the percentage of total nuclear H4K20me3 within the major satellite threshold (mean ± SD). There is a significant redistribution of H4K20me3 into pericentromeric heterochromatin after loss of MeCP2 (WT, 11.8 ± 1.8, n = 19 nuclei from 3 mice), (null, 23.7 ± 4.4, n = 19 nuclei from three mice). Unpaired t test, p < 0.0001. (F) The relative amount of H4K20me3 within the nucleus (mean ± SD) is compared between WT and null neurons. Intensity units represent total integrated intensity (×106) with mean intensity normalized for WT pyramidal neurons. (WT, 1.00 ± 0.01, n = 46 nuclei from 3 animals), (null, 1.11 ± 0.02, n = 50 nuclei from three mice). Unpaired t test, p < 0.0001. See also Movie S4.

