

Abstract
The role of the Piwi/piRNA pathway during mammalian oogenesis has remained enigmatic thus far, especially since experiments with Piwi knockout mice did not reveal any phenotypic defects in female individuals. This is in striking contrast with results obtained from other species including flies and zebrafish. In mouse oocytes, however, only low levels of piRNAs are found and they are not required for their function. We recently demonstrated dynamic expression of PIWIL1, PIWIL2, and PIWIL3 during mammalian oogenesis and early embryogenesis. In addition, small RNA analysis of human, crab-eating macaque and cattle revealed that piRNAs are also expressed in the female germline and closely resemble piRNAs from testis. Here, we thoroughly describe the experimental and computational methods that we applied for the generation, processing and analyses of next generation sequencing (NGS) data associated with our study on Piwi proteins and piRNAs in mammalian oocytes and embryos (Roovers et al., 2015). The complete sequence data is available at NCBI's Gene Expression Omnibus (http://www.ncbi.nlm.nih.gov/geo/) under the accession GSE64942.
Keywords: Piwi, piRNA, Oocytes, Ovary, Embryo
| Specifications | |
|---|---|
| Organism/cell line/tissue | Human (adult and fetal ovary), marmoset (adult testis and ovary), cattle (adult ovary, oocytes, cumulus and in vitro fertilized 2–4 cell stage embryos) |
| Sex | Male and female |
| Sequencer or array type | Illumina HiSeq 2500 |
| Data format | Raw and analyzed |
| Experimental factors | Normal and untreated tissues/cells |
| Experimental features | Sequencing of small RNA transcriptomes. Comparison of small RNA libraries with and without a NaIO4 oxidation step (for selected samples). |
| Consent | Human adult ovary samples were from cancer patients that underwent unilateral oophorectomy for fertility preservation and have signed informed consent. The human fetal material used was from elective abortions and donated for research with informed consent. The research on human material was approved by the Medical Ethical Committee of the Leiden University Medical Center (CME P08.087 and CME 05/03 K/YR). |
| Sample source location | Leiden, Netherlands (human samples), Göttingen, Germany (macaque samples), Utrecht, Netherlands (bovine samples) |
1. Direct link to deposited data
2. Experimental design, materials and methods
The Gene Expression Omnibus (GEO) Series GSE64942 comprises 41 high-throughput sequencing datasets (raw and processed) associated with the Roovers et al. study [1]. The following table lists all samples and provides the most relevant data associated with each sample (Table 1).
Table 1.
Key features of GEO Series GSE64942 samples (hsap: Homo sapiens, mfas: Macaca fascicularis, and btau: Bos taurus).
| GEO id | Sample name | Species | Tissue or cell type | NaIO4 treatment |
|---|---|---|---|---|
| GSM1584495 | Bovine_GV_a | btau | Oocytes at GV stage | No |
| GSM1584496 | Bovine_GV_b1 | btau | Oocytes at GV stage | No |
| GSM1584497 | Bovine_MI_1 | btau | Oocytes at MI stage | No |
| GSM1584498 | Bovine_MI_2 | btau | Oocytes at MI stage | No |
| GSM1584499 | Bovine_MII_a1 | btau | Oocytes at MII stage | No |
| GSM1584500 | Bovine_MII_a2 | btau | Oocytes at MII stage | No |
| GSM1584501 | Bovine_MII_b1 | btau | Oocytes at MII stage | No |
| GSM1584502 | Bovine_MII_b2 | btau | Oocytes at MII stage | No |
| GSM1584503 | Bovine_ovary_1 | btau | Adult ovary | No |
| GSM1584504 | Bovine_ovary_2 | btau | Adult ovary | No |
| GSM1584505 | Bovine_oxidized_1 | btau | Adult ovary | Yes |
| GSM1584506 | Bovine_oxidized_2 | btau | Adult ovary | Yes |
| GSM1584507 | Bovine_testis_1 | btau | Adult testis | No |
| GSM1584508 | Bovine_testis_2 | btau | Adult testis | No |
| GSM1584509 | Bovine_cumulus_MI_1 | btau | Cumulus cells from MI oocytes | No |
| GSM1584510 | Bovine_cumulus_MI_2 | btau | Cumulus cells from MI oocytes | No |
| GSM1584511 | Bovine_cumulus_MII_1 | btau | Cumulus cells from MII oocytes | No |
| GSM1584512 | Bovine_cumulus_MII_2 | btau | Cumulus cells from MII oocytes | No |
| GSM1584513 | Bovine_IVF_1 | btau | IVF embryos in 2–4 cell stages | No |
| GSM1584514 | Bovine_IVF_2 | btau | IVF embryos in 2–4 cell stages | No |
| GSM1584515 | Macaque_ovary_1 | mfas | Adult ovary | No |
| GSM1584516 | Macaque_ovary_2 | mfas | Adult ovary | No |
| GSM1584517 | Macaque_oxidized_1 | mfas | Adult ovary | Yes |
| GSM1584518 | Macaque_oxidized_2 | mfas | Adult ovary | Yes |
| GSM1584519 | Macaque_testis_1 | mfas | Adult testis | No |
| GSM1584520 | Macaque_testis_2 | mfas | Adult testis | No |
| GSM1584521 | Human_ovary_1 | hsap | Adult ovary | No |
| GSM1584522 | Human_ovary_2 | hsap | Adult ovary | No |
| GSM1584523 | Human_ovary_1_oxidized | hsap | Adult ovary | Yes |
| GSM1584524 | Human_ovary_2_oxidized | hsap | Adult ovary | Yes |
| GSM1584525 | Fetal_1st_1 | hsap | Ovary from 1st trimester fetus | No |
| GSM1584526 | Fetal_1st_2 | hsap | Ovary from 1st trimester fetus | No |
| GSM1584527 | Fetal_1st_1_oxidized | hsap | Ovary from 1st trimester fetus | Yes |
| GSM1584528 | Fetal_1st_2_oxidized | hsap | Ovary from 1st trimester fetus | Yes |
| GSM1584529 | Fetal_2nd_1 | hsap | Ovary from 2nd trimester fetus | No |
| GSM1584530 | Fetal_2nd _2 | hsap | Ovary from 2nd trimester fetus | No |
| GSM1584531 | Fetal_2nd _1_oxidized | hsap | Ovary from 2nd trimester fetus | Yes |
| GSM1584532 | Fetal_2nd _2_oxidized | hsap | Ovary from 2nd trimester fetus | Yes |
| GSM1614231 | Bovine_oxidized_2_repeat | btau | Adult ovary | Yes |
| GSM1614232 | Bovine_cumulus_GV_a | btau | Cumulus cells from oocytes at GV stage | No |
| GSM1614233 | Bovine_cumulus_GV_b | btau | Cumulus cells from oocytes at GV stage | No |
2.1. RNA isolation and NaIO4 treatment
RNA was extracted from the ovary and testis tissues by adding 750 μl TRIzol LS reagent (Ambion) and the tissues were mashed and sonicated (3 times 30 s, low power). The oocyte samples of all stages (~ 1000 oocytes per sample) and the IVF samples (450 embryos per sample) were treated similarly, but instead of adding 750 μl TRIzol LS, only 325 μl TRIzol LS was used (for following steps half amounts were used as well). First trimester fetal samples were taken up in 325 μl TRIzol LS and sonicated 3 times 30 s, whereas second trimester ovary samples were first grinded under liquid N2 and then taken up in 325 μl TRIzol LS. The RNA extraction was performed according to instructions of the manufacturer with small adjustments: Precipitation was performed overnight at − 80 °C with the addition of 1 μl glycoblue (Ambion). Secondly, samples were spun down for 1 h at 16,000 × g at 4 °C before washing with 70% ethanol.
Samples that were sequenced directly without NaIO4 treatment were taken up in 6 μl RNase free MQ followed by library preparation. Samples that were oxidized were either first enriched for > 200 nt RNA molecules (bovine, macaque and human ovary) using the mirVana kit (Ambion), or were oxidized directly (low input samples: GV oocytes and fetal ovary tissues). In the case of GV oocytes, to control for successful oxidation and subsequent RNA isolation, we added 1/10th concentration of macaque testis RNA, since the testis piRNAs are methylated and the methylation state of the piRNAs from GV stage oocytes was still unknown. For the oxidation, we divided the samples into two and performed NaIO4 treatment or mock treatment as follows: prepare 5 × borate buffer (148 mM borax, 148 boric acid, adjust pH to 8.6) and prepare freshly 200 mM NaIO4. Mix 4 μl 5 × borate buffer, 2.5 μl 200 mM NaIO4 or 2.5 μl MQ (mock samples), RNA, MQ to 20 μl. Leave the reaction at RT for 10 min and add 2 μl glycerol and incubate 1 more minute at RT. Continue with RNA precipitation by adding 2.2 μl 3 M NaAc pH 5.5, 25 μl isopropanol and 1 μl glycoblue. Mix and precipitate overnight at − 80 °C. Spin down samples 1 h at 16,000 × g at 4 °C and wash once with 70% ethanol. Spin 20 more minutes, remove supernatant and take up the pellet in 6 μl RNase free MQ and continue with library preparation.
2.2. Library construction and high-throughput sequencing
Total RNA was subjected to 15% TBE-urea gel for size selection of 15–35 nt. This excised gel fraction was eluted in 0.3 M NaCl for > 16 h and precipitated with 100% isopropanol and Glycoblue for > 1 h at − 20 °C. The precipitated RNA pellet was washed once with 75% ethanol and dissolved in nuclease-free water. The purified RNA fraction was confirmed by Bioanalyzer Small RNA assay (Agilent). Library preparation was based on the NEBNext® Small RNA Library Prep Set for Illumina® (New England Biolabs) with minor modifications. To counteract ligation bias and to remove PCR duplicates, small RNA was first ligated to the 3′ adapter and then the 5′ adapter, both of which contained four random bases at the 5′ and 3′ end, respectively. Adapters with random bases were chemically synthesized by Bioo Scientific. Adapter-ligated RNA was reverse-transcribed and PCR amplified for 14 cycles using index primers. The PCR amplified cDNA construct was checked on the Bioanalyzer (Agilent) using High Sensitivity DNA assay. We performed a size selection of the small RNA library on LabChip XT instrument (PerkinElmer) using the DNA 300 assay kit. All libraries were pooled to obtain 10 nM, which was denatured to 9 or 10 pmol with 5% PhiX spiked-in and sequenced as single-read for 50 cycles on an Illumina MiSeq or HiSeq 2500 instrument in either rapid or high-output mode.
2.3. Computational processing and analysis of sequence data sets
2.3.1. Software deposition
For the processing, filtering and analyses of sequence datasets we applied a set of Perl scripts that are available using the following download link: http://www.smallrnagroup-mainz.de/software/scripts_Roovers-et-al.zip. Many of these Perl scripts are part of the NGS toolbox, which is subject to constant updating and debugging. The NGS toolbox collection as well as the latest sRNAmapper and proTRAC [2] software version including detailed documentations are available at http://www.smallrnagroup-mainz.de/software.html.
2.3.2. Data filtering, mapping and annotation
The 5′ and 3′ RNA adapters used for library construction were tagged with a short stretch of four random nucleotides at their 3′ or 5′ end, respectively. As a result, all 50 bp raw sequence reads comprise the original small RNA sequence flanked by four random nucleotides, and end with the 3′ adapter sequence (Fig. 1).
Fig. 1.
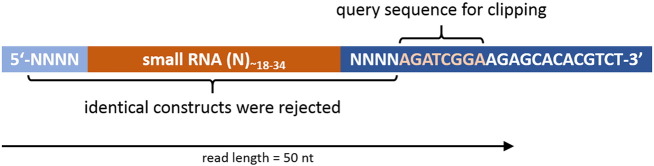
Scheme of sequencing construct. The cloned RNA molecule is flanked by 5′ and 3′ random tags. The read length is 50 nt and therefore, depending on the cloned RNA length, typically ends with an incomplete 3′ adapter sequence.
In order to avoid any PCR-induced bias we clipped adapter sequences and excluded raw sequence reads with identical small RNA sequences and flanking random tags from the sequence data sets as these may constitute cloning products that each represents the same molecule (cliplinker_random.pl). Remaining sequence reads within the size range of 18–34 nt (NGS toolbox: length-filter) were collapsed to non-identical sequences while storing information on read counts for each sequence in the FASTA headers (NGS toolbox: collapse). We then mapped the sequences to the genome of Homo sapiens (assembly: GRCh38, GenBank accession: GCA_000001405.15), Macaca fascicularis (assembly: Macaca_fascicularis_5.0, GenBank accession: GCA_000364345.1) and Bos taurus (assembly: UMD3.1, GenBank accession: 6 GCA_000003055.3) using piRmapper_1.0.pl which is now replaced by the sRNAmapper software that is available at http://www.smallrnagroup-mainz.de/software.html. The mapping process was performed requiring a perfect match for positions 1 to 18 and allowing one internal mismatch in the following part of the sequence. In addition, we allowed up to two non-template 3′ nucleotides in order to map piRNAs that may carry post-transcriptionally modified 3′ ends. Fig. 2 displays the results of the initial processing and mapping procedures.
Fig. 2.

Results of initial processing and mapping.
Sequences that were successfully mapped to the genome were also mapped (in sense orientation) to non-coding (nc) RNA datasets from Ensembl database (release 77), miRBase (release 21 [3]), Genomic tRNA database [4], and Silva rRNA database (release 119, [5]) using SeqMap [6] in order to identify miRNAs or fragments of miRNA precursors, lincRNA (no lincRNAs are described for Bos taurus), miscRNA, rRNA, snoRNA, snRNA and tRNA. In addition, we scanned for low complexity reads discarding reads with ≥ 75% of their sequence being composed of the same 1–4 nt motif (kill_simples.pl. = NGS toolbox: duster). In case of multiple annotation for one sequence, we apportioned the read counts accordingly to the different ncRNA types. Fig. 3 displays the results of this annotation step. Exact values for the information provided in the Fig. 2, Fig. 3 are available in supplementary file 1 (Excel sheet). A set of FASTA-formatted sequence files with sequences sorted according to the described annotation are available for each sample in supplementary file 2 (zip-compressed folder).
Fig. 3.

Results of ncRNA annotation for successfully mapped reads.
2.3.3. Cloning efficiency of different random tags
Besides the possibility to minimize a putative sequence bias induced by PCR amplification, the usage of randomly tagged RNA adapters also ensures a high cloning efficiency due to providing all possible ligation substrates in order to antagonize putative ligation bias resulting from unknown or obscure ligation preferences of the applied RNA ligase. Indeed, we observed a bias for specific random tags in both 5′ and 3′ adapters across the different sequence datasets (Fig. 4).
Fig. 4.
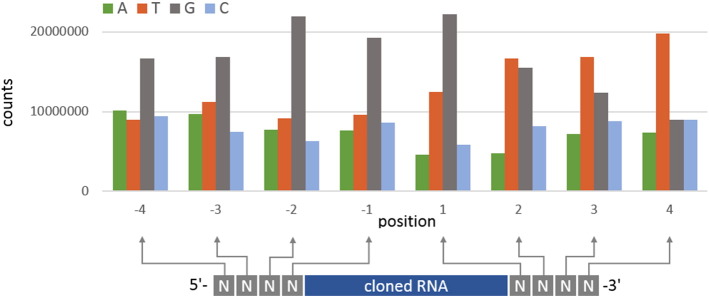
Positional nucleotide composition of 5′ and 3′ random tags.
While all positions of the 5′ random tag are biased towards G, only the first position of the 3′ random tag is biased towards G, whereas the following positions are biased towards T (U). Interestingly, this pattern is essentially the same comparing 3′ uridylated testis and 3′ adenylated oocyte and IVF derived sequences [1]. This suggests equal ligation efficiency and adapter bias for 3′ U and 3′ A RNA populations. However, we cannot exclude a difference in the population composition of cloned RNAs for different random adapters as observed by Jayaprakash and coworkers [7].
2.3.4. Prediction of genomic piRNA clusters
We predicted genomic piRNA clusters with proTRAC version 2.0.4 using the following command line arguments: -clstrand 0.5, -pimin 24, -pimax 31, -distr 1-90, -nr, -nh, and -mmr. The option -mmr (per million mapped reads) is renamed -rpm (reads per million) in proTRAC version 2.0.5 and later. The original proTRAC output is available for download at http://www.smallrnagroup-mainz.de/data/proTRAC_Roovers-et-al.zip as these results are not attached to the original study. Selected datasets from this GEO Series have also been added to the piRNA cluster database that can be accessed under the following URL: http://www.smallrnagroup-mainz.de/piRNAclusterDB.html.
Acknowledgments
This work was supported by a VICI grant (724.011.001) from the Dutch Organization for Scientific Research (to R.F.K.), by the Rhineland-Palatinate Forschungsschwerpunkt GeneRED (to H.Z) and by the research funding program MAIFOR of the University Medical Center Mainz (to D.R.).
Footnotes
Supplementary data to this article can be found online at http://dx.doi.org/10.1016/j.gdata.2015.06.026.
Appendix A. Supplementary data
Supplementary material 1.
Supplementary material 2.
References
- 1.Roovers E.F., Rosenkranz D., Mahdipour M., Han C.T., He N., de Sousa C., Lopes S.M., van der Westerlaken L.A.J., Zischler H., Butter F., Roelen B.A.J., Ketting R.F. Piwi proteins and piRNAs in mammalian oocytes and early embryos. Cell Rep. 2015;10:2069–2082. doi: 10.1016/j.celrep.2015.02.062. [DOI] [PubMed] [Google Scholar]
- 2.Rosenkranz D., Zischler H. proTRAC — a software for probabilistic piRNA cluster detection, visualization and analysis. BMC Bioinformatics. 2012;13:5. doi: 10.1186/1471-2105-13-5. [DOI] [PMC free article] [PubMed] [Google Scholar]
- 3.Griffiths-Jones S. The microRNA Registry. Nucleic Acids Res. 2004;32:D109–D111. doi: 10.1093/nar/gkh023. [DOI] [PMC free article] [PubMed] [Google Scholar]
- 4.Chan P.P., Lowe T.M. GtRNAdb: a database of transfer RNA genes detected in genomic sequence. Nucleic Acids Res. 2009;37:D93–D97. doi: 10.1093/nar/gkn787. [DOI] [PMC free article] [PubMed] [Google Scholar]
- 5.Quast C., Pruesse E., Yilmaz P., Gerken J., Schweer T., Yarza P., Peplies J., Glöckner F.O. The SILVA ribosomal RNA gene database project: improved data processing and web-based tools. Nucleic Acids Res. 2013;41:D590–D596. doi: 10.1093/nar/gks1219. [DOI] [PMC free article] [PubMed] [Google Scholar]
- 6.Jiang H., Wong W.H. SeqMap: mapping massive amount of oligonucleotides to the genome. Bioinformatics. 2008;24:2395–2396. doi: 10.1093/bioinformatics/btn429. [DOI] [PMC free article] [PubMed] [Google Scholar]
- 7.Jayaprakash A.D., Jabado O., Brown B.D., Sachidanandam R. Identification and remediation of biases in the activity of RNA ligases in small-RNA deep sequencing. Nucleic Acids Res. 2011 doi: 10.1093/nar/gkr693. [DOI] [PMC free article] [PubMed] [Google Scholar]
Associated Data
This section collects any data citations, data availability statements, or supplementary materials included in this article.
Supplementary Materials
Supplementary material 1.
Supplementary material 2.