

SUMMARY
To understand how different diets, the consumers’ gut microbiota and the enteric nervous system (ENS) interact to regulate gut motility, we developed a gnotobiotic mouse model that mimics short-term dietary changes that happen when humans are traveling to places with different culinary traditions. Studying animals transplanted with the microbiota from humans representing each cuisine and fed a sequence of diets representing those of all donors, we find that correlations between bacterial species abundances and transit times are diet-dependent. However, the levels of unconjugated bile acids - reflecting microbial bile salt hydrolase activity - correlate with faster transit across diets, including a Bangladeshi diet. Mice harboring a consortium of sequenced bacterial strains from the Bangladeshi donor’s microbiota and fed a Bangladeshi diet revealed that the commonly used spice, turmeric, slows transit times. Turmeric affects gut motility via bacterial bile acid deconjugation and modulation of Ret signaling in the ENS. These results demonstrate how a single food ingredient interacts with a functional microbiota trait to regulate host physiology.
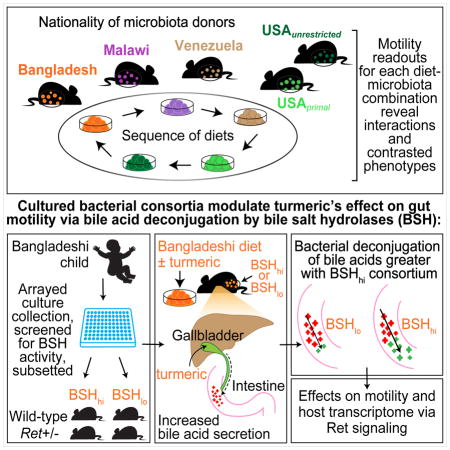
Graphical Abstract
INTRODUCTION
Gut motility, a key physiologic parameter governing digestion and absorption of nutrients, is affected by diet (Cummings et al., 1976, 1978), gut microbes (Husebye et al., 1994, 2001; Wichmann et al., 2013), the enteric nervous system (ENS) (Edery et al., 1994; Romeo et al., 1994), and host genetics (Levy et al., 2000; Whorwell et al., 1986). At present, we lack detailed understanding of the complex and dynamic interrelationships between these factors, particularly in the global context of diverse cultural traditions concerning foods, their methods of preparation, and the varied human gut microbiota that have evolved under these dietary conditions. Intestinal transit times measured in >1000 healthy individuals representing diverse populations worldwide varied within and between groups, likely reflecting a culmination of these factors (Burkitt et al., 1972). The advent of culture-independent methods for characterizing the structure and expressed functions of a gut microbiota creates an opportunity to identify new approaches for understanding gut motility and for optimizing the nutritional benefits derived from different dietary practices.
In the present study, we began by modeling short-term diet changes associated with global human travel in gnotobiotic mice colonized with gut microbiota from healthy human donors from around the world. We hypothesized that with an international focus, we could conduct a screen of food types and microbiota for potential mediators of motility common to diverse diets and gut communities. Without making any assumptions regarding the healthiness of faster or slower motility, our strategy was to identify diets and microbiota whose interactions result in highly contrasting transit times in order to subsequently home in on specific dietary ingredients and microbiota-encoded metabolic capacities that affect motility. We reasoned that by generating clonally arrayed collections of bacterial strains cultured from donor microbiota that transmitted disparate motility phenotypes in different dietary settings, we could deliberately manipulate which members of the collection were used for colonization of mice based on specific metabolic attributes that could be identified from their genomes and confirmed by direct biochemical assays in vitro. Colonization with different subsets of the community could then be performed in the context of concurrently manipulated diets, either in wild-type animals or those with deliberately manipulated genetic features known to affect ENS function. Our immediate goal for this type of preclinical modeling was to decipher the mechanisms by which diet-by-microbiota interactions can regulate gut motility. Our long-term goal was to implement an approach that could, in principle, be generalized to dissect the effects of interactions between (i) ingredients represented in established as well as emerging dietary traditions/trends, (ii) members of consumers’ gut microbiota, and (iii) gut motility and potentially other aspects of human physiology.
RESULTS
Modeling diet and motility changes associated with global human travel in gnotobiotic mice
In an initial ‘travel’ experiment, intact uncultured fecal microbiota samples obtained from six healthy adults representing different geographic locations and cultural/culinary traditions were transplanted into adult germ-free C57BL/6 male mice (n=6 recipient mice/donor microbiota). Microbiota donors included (i) three residents of the USA (a twin pair stably discordant for obesity with both co-twins consuming an American diet without self-imposed dietary restrictions (USAunrestricted) (Ridaura et al., 2013) plus another lean individual who had consumed a protein- and fat-rich primal diet for a number of years (USAprimal)), (ii) an Amerindian living in a remote rural village in the Amazonas State of Venezuela (Yatsunenko et al., 2012), (iii) a Bangladeshi resident of an urban slum (Subramanian et al., 2014), and (iv) a Malawian from a rural village in the southern part of the country (Yatsunenko et al., 2012) (see Table S1A for a description of donor characteristics and Table S1B for analysis of microbiota transplantation efficiency). The six groups of transplant recipients were fed a sequence of six sterilized diets formulated to represent those consumed by the microbiota donors (Figure 1, Table S1C, D), in essence simulating the varying dietary experiences of humans and their microbiota during travel. In each case, the initial and final diets in the sequence represented the native or home diet of the donor, in order to characterize the longer term effects of dietary exposures during travel and the degree to which transit times recover; in between, travel diets were given in the same sequence, in an order chosen randomly but executed uniformly for all mice, as permitted by the type of home diet (Figure 2A). The starting and ending home diets were given for 14 and 8 days, respectively, while each travel diet was administered for 8 days. Intestinal transit times were measured at the end of each diet phase by gavaging mice with non-absorbable red carmine dye and recording the time from gavage to first appearance of the dye in their feces (Kashyap et al., 2013; Li et al., 2011; Yano et al., 2015) (Figure 2B, Table S2A). Carmine dye does not perturb the structure of the gut bacterial community; 16S rRNA analysis of fecal samples, collected before and after carmine administration from 9-week-old gnotobiotic mice colonized with a fecal microbiota from a conventionally-raised C57BL/6 donor, showed no significant effect of the dye as judged by weighted UniFrac distances (p>0.05, two-tailed Student’s t-test). Moreover, fecal samples collected on the days of transit time measurements were taken prior to carmine administration.
Figure 1. Compositions of diets used in the 6-phase travel experiment.

In the foreground, word clouds convey the specific ingredients used: font sizes depict the weight-based proportional representations of ingredients within each diet. Pie charts in the background present the macromolecular compositions. See also Table S1.
Figure 2. Diet and microbiota significantly impact intestinal transit times.

(A) Schematic of 6-phase travel experiment. Groups of adult germ-free C57BL/6 mice were colonized with fecal microbiota from six healthy donors and fed diets representative of those consumed by all donors in the sequence shown in panel B. (B) The central squares of this heat map represent means of transit times for each diet-microbiota combination as measured by carmine red dye assay; the frames of the squares represent s.e.m. (n=6 mice/donor microbiota). Microbiota are represented along rows, diet phases along columns. Each group of mice consumed human diets in the order shown from left to right; home diets were always consumed during the initial and final diet phases but skipped in the intervening travel diet progression (primal diet
 unrestricted American diet
Bangladeshi diet
Malawian diet
Amerindian diet). (C) Histogram showing distribution of all transit times recorded throughout the 6-phase travel experiment. (D) The most contrasted diet-by-microbiota effects on transit times were observed in mice colonized with a Bangladeshi or USAunrestricted microbiota and fed Bangladeshi versus primal diets. Results for USAunrestricted (lean) and USAunrestricted (obese) were aggregated and are represented together as USAunrestricted. Results from the ‘home’ and ‘return home’ phases for mice colonized with a Bangladeshi microbiota and fed a Bangladeshi diet were also aggregated. Statistical significance was determined using a two-tailed Student’s t-test; *, p<0.05. See also Figures 1, 3, S1, S2 and Tables S1, S2, S3, S4, S5.
unrestricted American diet
Bangladeshi diet
Malawian diet
Amerindian diet). (C) Histogram showing distribution of all transit times recorded throughout the 6-phase travel experiment. (D) The most contrasted diet-by-microbiota effects on transit times were observed in mice colonized with a Bangladeshi or USAunrestricted microbiota and fed Bangladeshi versus primal diets. Results for USAunrestricted (lean) and USAunrestricted (obese) were aggregated and are represented together as USAunrestricted. Results from the ‘home’ and ‘return home’ phases for mice colonized with a Bangladeshi microbiota and fed a Bangladeshi diet were also aggregated. Statistical significance was determined using a two-tailed Student’s t-test; *, p<0.05. See also Figures 1, 3, S1, S2 and Tables S1, S2, S3, S4, S5.
Aggregating data from all animals at all time points of this 6-phase travel experiment revealed a normal distribution of transit times (Figure 2C). The average within-mouse variance throughout the experiment was 27.7 minutes, while the average between-mouse variance at a given time point was 29.3 minutes. Repeated measures ANOVA in which transit time was the dependent variable demonstrated that diet (p=5.6×10⁻⁵), the donor microbiota (p=2.3×10⁻³), and the interaction of diet and microbiota (p=2.6×10⁻³) were all significant factors (Table S3A). The most contrasted diet-by-microbiota effects on transit times were documented in mice colonized with the Bangladeshi compared to the USAunrestricted microbiota when they consumed Bangladeshi and primal diets (Figure 2D). Specifically, mice colonized with the USAunrestricted microbiota had significantly faster motility (i.e., lower transit times) when consuming the Bangladeshi diet compared to primal diet (p<0.002, two-tailed Student’s t-test); the opposite was observed in mice colonized with a Bangladeshi microbiota (p<0.006, two-tailed Student’s t-test). We tested the robustness of these most contrasted motility phenotypes by colonizing animals (n=5 recipient mice/donor microbiota) with fecal microbiota obtained from three healthy Bangladeshi adults (including the donor tested in the first experiment) and three healthy USAunrestricted adults (a repeat of the obese co-twin in the discordant pair, plus a new obese and a new lean donor; see Table S1A for donor characteristics). Recipients were subjected to three diet phases beginning and ending with a ‘local’ diet (i.e., the primal diet for mice colonized with a USAunrestricted microbiota or the Bangladeshi diet for mice colonized with a Bangladeshi microbiota) and including an interval ‘non-native’ diet (Figure S1A). The results of this 3-phase travel experiment confirmed that significantly contrasted transit times were imparted by the interactions of these diets and microbiota (p<2.6×10⁻⁵, F=19.8, ANCOVA), although the effect size and statistical significance of differences in transit time varied by the individual microbiota donor (Figure S1B, Table S2B).
Correlations between the relative abundances of gut bacterial strains and transit times are diet-dependent
To identify relationships between specific bacterial taxa, diet, and transit time phenotypes, we sequenced PCR amplicons generated from the V4 region of bacterial 16S rRNA genes present in fecal microbiota collected throughout the course of the 6-phase as well as 3-phase travel experiments (984 fecal samples; 22,470±630 reads per sample [mean±s.e.m.]; Table S4). 16S rRNA reads were grouped into operational taxonomic units based on whether they shared ≥97% nucleotide sequence identity (97%ID OTUs). Principal coordinates analysis (PCoA) based on unweighted UniFrac, a phylogenetic metric that computes similarity between any two microbiota based on the degree to which their component OTUs share branch length on a bacterial tree (Lozupone and Knight, 2005), indicated that community assembly was rapid and highly reproducible within a given group of mice that received the same donor microbiota in both the 6-phase and 3-phase travel experiments (Figure S2A, C).
The microbiota donor was the predominant factor explaining variance in unweighted UniFrac distances between samples from the different experimental groups (p<0.001 within-group as compared to between-group similarity, PERMANOVA; Figure S2B, D). Nonetheless, diet had consistent effects across different treatment groups and phenotypes: 87 diet-discriminatory 97%ID OTUs that were robust to donor microbiota and motility phenotypes were identified by applying a machine learning algorithm (Random Forests) to the 16S rRNA dataset generated from all fecal microbiota samples collected from all mouse recipients of all human donor microbiota throughout the 6-phase travel experiment (Figure 3; Table S5). We elected to apply a decision tree-based algorithm for feature selection (i.e., in this case, the most diet-discriminatory OTUs) so that we would not have to make any distributional assumptions regarding our dataset of proportional OTU abundances. The Random Forests-derived model predicted which diet was being consumed in the subsequent 3-phase travel experiment with a mean accuracy of 83%±0.02% (range 79%–86%; 10,000 replications), significantly better than the null distribution (p<2.2×10⁻¹⁶). These 87 diet-discriminatory OTUs were not significantly correlated with transit times in either experiment. In an analysis of all 416 97%ID OTUs with relative abundances above the limit of detection (0.01%) in mouse fecal samples collected throughout both travel experiments, just a single OTU, Parabacteroides gordonii (OTU ID 240), was significantly correlated, after Bonferroni correction for multiple comparisons, with transit times across the highly contrasted diet-microbiota combinations (rho=0.3, p=0.02). This organism has not been reported to be associated with altered intestinal motility in humans.
Figure 3. Diet-discriminatory OTUs are robust to different donor microbiota and motility phenotypes.

(A) Out-of-bag estimated error rates in a Random Forests model for predicting diet, stratified by donor microbiota, as a function of numbers of diet-discriminatory OTUs. For each microbiota, 40 OTUs were sufficient to discriminate diet, yielding a total of 87 unique OTUs across six microbiota donors from five cultural/dietary traditions in the 6-phase travel experiment. (B) Evidence for the robustness of diet-discriminatory OTUs to donor microbiota and motility phenotype. Feature importance scores of 87 diet-discriminatory OTUs in each diet-microbiota context are represented in this heat map. A sparse Random Forests model built using these diet-discriminatory OTUs accurately predicted diet in the 3-phase travel experiment. See also Table S5.
In contrast, 27 OTUs present in both the USAunrestricted and Bangladeshi microbiota had significant diet-dependent correlations with transit times documented in the context of either the Bangladeshi or primal diets but not both (Table S3B). The relationships of bacteria to transit times were strain-specific: two strains of Eubacterium desmolans (OTU IDs 170124 and 158946) had opposing relationships with transit times within the setting of primal diet consumption. A single OTU, E. desmolans (OTU ID 158946), was significantly correlated with transit times in both diets, but remarkably the correlations were opposite in the Bangladeshi versus primal diet contexts (p<9.3×10⁻⁶, F=9.6, ANCOVA testing interaction of E. desmolans abundance with diet). In the unrestricted USA diet context, yet another OTU in the USAunrestricted and Bangladeshi microbiota (Clostridiales, OTU ID 261590) was correlated with transit times (rho=−0.57, p=0.04). Hence, a hypothetical next-generation probiotic strain designed to impact motility would likely require simultaneous consumption of a specific diet or diet ingredient to exert its effect, much like leanness-conferring microbes have been demonstrated to transmit their phenotype in a diet-dependent manner (Ridaura et al., 2013).
Transit times at the ends of the initial and final home diets often varied. This finding could not be ascribed to increasing age (p=0.7, F=0.1, one-way ANOVA of transit time as a function of age). Mathematically, if we consider two functions h(m) and t(m), then h(m) need not necessarily equal h(t(h(m))). We postulated that if these two functions represent the effects of home (h) and travel (t) diets, respectively, on a microbiota m, then the result of a home diet may depend on whether intervening travel diets were consumed. Indeed, an analysis comparing fecal microbiota at the ends of the initial and final home phases in the 6-phase travel experiment disclosed that community structure, while largely similar, always exhibited statistically significant changes (p<0.05, paired two-tailed Student’s t-test after Bonferroni correction) in the proportional abundances of one or more OTUs. For example, mice colonized with fecal microbiota from both USAunrestricted individuals exhibited a significant increase in the relative abundance of Bacteroides ovatus between the first and last home diet periods, while mice colonized with microbiota from the adult Bangladeshi donor exhibited significantly increased abundances of an OTU classified as Clostridiales and a decrease in Ruminococcus obeum.
The imperfect recovery of transit time following diverse dietary exposures during travel could reflect not only these structural differences but also functional differences in the microbiota. Therefore, we characterized metabolic features of the microbiota in the context of the most highly contrasted motility phenotypes.
Microbially deconjugated bile acid metabolites are correlated with faster gut transit
To identify metabolic features that correlate with motility phenotypes, we applied ultra high performance liquid chromatography mass spectrometry (UPLC-MS) to fecal samples collected from mice in the 3-phase travel experiment on the same days when their transit times were measured (3 USAunrestricted and 3 Bangladeshi donor microbiota; 5 mice/donor microbiota; 3 fecal samples analyzed/mouse). We observed >2,500 unique m/z peaks that were present in more than one mouse. Spearman’s rank correlations (without Bonferroni correction) yielded 599 m/z peaks that were significantly correlated with transit times, of which 67 (11%) were putatively identified as bile acid metabolites (Tables S6A–S6B). In mice, the predominant primary bile acids are beta-muricholic acid and cholic acid, while in humans they are chenodeoxycholic acid and cholic acid (Haslewood, 1967). Prior to secretion from hepatocytes into biliary canaliculi, bile acids are conjugated with either taurine (predominant in mice (Falany et al., 1997)) or glycine (predominant in humans (Falany et al., 1994)) to decrease passive absorption by intestinal enterocytes. Bile acids have microbicidal activity; members of the gut microbiota neutralize these effects by metabolizing host bile acids, beginning with deconjugation catalyzed by microbial bile salt hydrolases (BSH) (Drasar et al., 1966). Since bile acids are modified by the microbiota, we considered whether differences in bile acid metabolite profiles could explain discordant microbiota-associated motility phenotypes.
To gain insights into the relationships between OTUs and bile acid metabolites as they pertain to transit times, we calculated Spearman’s rank correlation coefficients between the proportional abundances of 97%ID OTUs in fecal microbiota, the peak intensities of fecal bile acids, and transit times in the 3-phase travel experiment (Figure 4, Table S6B). After Bonferroni correction, we identified 118 OTUs with significant correlations between their abundances and levels of one or more fecal bile acids; only one of these OTUs, Blautia (OTU ID 296977), also had a significant correlation between its abundance and transit times (slower transit) (Table S6B). A sparse linear model, built after regressing transit times against all bile acid metabolite levels then simplified by applying stepwise backward feature selection, demonstrated that levels of just five bile acids (7-ketodeoxycholic acid, muricholic acid, taurocholic acid, tauro-beta-muricholic acid, and tauro-muricholic acid sulfate) accurately predicted transit times in the 3-phase travel experiment (rho=0.54, p=1.8×10⁻⁷, Spearman’s rank correlation), out-performing a linear model built with an equivalent number of randomly selected non-bile acid metabolites (rho=0.17, p=0.47, Spearman’s rank correlation; mean values over 1,000 replications) (Figure S1C, Table S6C). Of these five bile acids, none was significantly associated with either diet. Only one bile acid species, tauro-muricholic acid sulfate, was significantly associated with the geographic origin of the microbiota donor; it was found at significantly higher concentrations in fecal specimens collected from mice colonized with subjects residing in Bangladesh (Figure 4). Bile acids that were correlated with faster transit times were unconjugated (7-ketodeoxycholic acid and muricholic acid), whereas those that correlated with slower transit times were conjugated (tauro-beta-muricholic acid, taurocholic acid, and tauro-muricholic acid sulfate) (Figure 4, Table S6B). Multiple bile acids, including these five bile acids, were significantly correlated with multiple OTUs (Figure 4), underscoring the complexity of microbial bile acid metabolism.
Figure 4. Significant correlations between fecal bile acid metabolite concentrations and the relative abundances of bacterial 97%ID OTUs.

Bile acid metabolite profiling and 16S rRNA analysis was performed on fecal samples collected from mice in the 3-phase travel experiment (Figure S1). Spearman rank correlations were calculated between bile acid concentrations and relative abundances of 97%ID OTUs. Unsupervised hierarchical clustering was applied. Significant associations (p<0.05 calculated by two-tailed Student’s t-test, with Bonferroni correction) between microbiota/diet and bile acids/OTUs are represented in the vertical and horizontal side panels. Associations between bile acids and motility were calculated by linear modeling with stepwise backward feature selection, as detailed in the text and Supplemental Experimental Procedures. See also Figures S1 and Tables S4, S6.
Turmeric alters gut motility
Intestinal bile acid concentrations are largely dictated by dietary components (e.g. peptides and fats) that trigger intestinal signals (e.g. cholecystokinin), which, in turn, influence gallbladder contraction and release of bile into the lumen of the proximal small intestine. To further characterize interactions between specific OTUs, bile acid metabolism, and diet, we examined the effects of turmeric on transit time. We selected turmeric, a spice with cultural significance commonly used in Bangladeshi cuisine, because it has a dose-dependent cholekinetic effect; i.e., its active ingredient, curcumin, stimulates gallbladder contraction and thus increases luminal bile acid levels. The effect sizes of turmeric’s cholekinesis vary between reported studies, possibly due to population-based differences (e.g., European versus Asian subjects) or differences in how the spice was administered (Marciani et al., 2013; Rasyid and Lelo, 1999; Rasyid et al., 2002). In a study using serial hydrogen breath tests to assess carbohydrate fermentation and small bowel transit time, investigators observed that turmeric-containing Japanese-style curry fed to Japanese individuals increased fermentation and shortened small bowel transit time compared to curry prepared without turmeric (Shimouchi et al., 2009). The microbial underpinnings of these observations in human subjects are unknown, as metagenomic or metabolomic analyses of their gut microbiota were not performed.
We initially defined the effect of turmeric in adult male C57BL/6 gnotobiotic mice colonized with a collection of anaerobic bacterial strains cultured from the fecal microbiota of a healthy 2-year-old Bangladeshi child (Table S7A). We generated this culture collection from a child rather than an adult to avoid the potential confounding effects of chronic antecedent turmeric exposure on microbiota features. This child, like the three Bangladeshi adults whose microbiota were tested in the earlier experiments, lived in Mirpur, an urban sub-district of Dhaka. The sequenced, clonally arrayed bacterial culture collection gave us the capacity to perform follow-up experiments in which specific strains were selected for colonization based on their capacity to metabolize bile acids.
Following gavage of the entire culture collection, composed of 53 bacterial strains (Table S7A), mice were initially fed a Bangladeshi diet lacking turmeric for 10 days (diet phase 1), then the same diet containing turmeric for 10 days (diet phase 2), and finally the unsupplemented Bangladeshi diet again for 10 days (diet phase 3). A control group was maintained under germ-free conditions and subjected to the same sequence of diets (n=6 animals/group). To limit carryover of turmeric from the prior diet, old bedding was replaced with fresh new bedding at start of each diet phase.
Colonization was highly reproducible between animals with community assembly completed within 3–5 days after gavage. At the end of the first diet phase, 44±1.2 (mean±s.e.m.) of the 53 input strains were detectable in fecal samples collected from recipient animals, based on community profiling by shotgun sequencing (COPRO-Seq) of fecal DNA (see Experimental Procedures). Colonized mice had significantly faster transit times at each diet phase compared to their germ-free counterparts (p=5.0×10⁻⁶, p<4.7×10⁻⁷, and p<1.7×10⁻⁵ for diet phases 1, 2, and 3, respectively, two-tailed Student’s t-test; Table S2C). Consumption of turmeric was associated with a significant slowing of motility (i.e., longer transit time) (Table S2C). UPLC-MS of fecal samples collected from germ-free mice at the end of each diet phase disclosed that ingestion of this cholekinetic spice was associated with significantly increased levels of taurohyodeoxycholic acid (p=0.003, one-tailed Student’s t-test) and tauro-muricholic acid sulfate (p=0.03, one-tailed Student’s t-test) compared to the period of unsupplemented diet consumption (Table S6A). As expected, no unconjugated bile acids were detected in the germ-free group during any of the diet phases. We included a curcumin standard in order to quantify fecal curcumin levels; however, curcumin was undetectable in all samples.
To directly test the hypothesis that microbiota with different capacities to deconjugate bile acids transmit distinct transit time phenotypes, we first used a UPLC-MS-based in vitro assay to screen all members of the clonally arrayed culture collection for their bile salt hydrolase (BSH; EC 3.5.1.24) activities. The screen demonstrated that OTUs representing diverse phylotypes had the ability to deconjugate at least one of the two primary bile acids found in mice (Table S7A). BLAST predictions, based on the presence in a strain’s genome of a gene or genes homologous to known BSH genes (E-value threshold cutoff ≤10−5) were correct in predicting in vitro BSH enzymatic activity for 85% of the bacterial strains. Only 10 strains did not deconjugate either bile acid in vitro (6 members of the genus Enterococcus, 3 members of Eggerthella, and 1 belonging to Enterobacteriaceae). The strains with BSH activity were largely members of the genera Bifidobacterium and Enterococcus. We then assembled two bacterial consortia, each composed of seven strains representing the taxonomic diversity of the BSH-positive and BSH-negative subsets within the culture collection: the “BSHhi” consortium contained four members of Enterococcus and three members of Bifidobacterium; the “BSHlo” consortium had five members of Enterococcus, one Eggerthella species, and one Enterobacteriaceae (see Table S7B for a summary of KEGG-based annotations of the sequenced genomes of these 14 strains). Members of the two consortia had in vitro growth rates in rich medium that were not significantly different from one another (p=0.92, two-tailed Student’s t-test).
Age-matched adult male C57BL/6 gnotobiotic mice were colonized with either the BSHhi or BSHlo consortium (assembled prior to gavage by combining equal numbers of colony forming units of each component strain). A positive control group was colonized with the entire culture collection. As before, mice in each of these three groups (n=5/group) were given the unsupplemented Bangladeshi diet for 3 days prior to gavage of the cultured organisms. Following gavage, mice were maintained on the unsupplemented Bangladeshi diet for 8 days, followed by the turmeric-supplemented diet for 8 days, and then returned to the starting Bangladeshi diet for another 8 days. The complete culture collection produced a transit time that was significantly faster than that measured with the BSHlo consortium in all three diet phases (p<0.002, one-tailed Student’s t-test; Table S2D). While mice harboring the BSHlo consortium had the same transit time as the BSHhi consortium in the absence of turmeric, addition of this spice to the Bangladeshi diet produced significantly slower transit times in BSHlo animals (p=0.02, one-tailed Student’s t-test comparing phase 1 versus phase 2 transit times; Figure 5A) but no significant effects in BSHhi mice (p=0.7, one-tailed Student’s t-test). These findings indicate that a gut microbiota capable of deconjugating bile acids could modify the response to turmeric, which through its cholekinetic effects delivers increased amounts of conjugated bile acids to the proximal intestine.
Figure 5. An interaction between diet, bile acid metabolism, and gut motility revealed by colonizing germ-free mice with a BSHhi or BSHlo consortium and feeding them a representative Bangladeshi diet with or without turmeric.

(A) Turmeric consumption resulted in significantly slower motility in mice colonized with the BSHlo but not the BSHhi consortium. (B) While consuming the turmeric-supplemented Bangladeshi diet, BSHhi mice had transit times comparable to mice colonized with the complete 53 strain culture collection (“CC”) and faster motility (i.e., shorter transit times) than BSHlo mice (n=5 animals/microbiota). (C) Turmeric consumption is associated with a significant increase in total fecal unconjugated bile acid concentrations in gnotobiotic wild-type mice colonized with the BSHhi consortium but not the BSHlo consortium. (D) Transit times (mean ± s.e.m.) measured for two groups of gnotobiotic mice colonized with BSHlo consortium and fed the unsupplemented or turmeric-containing Bangladeshi diet. Measurements occurred at the end of the single (monotonous) 10-day diet experiment. Statistical significance was determined using a one-tailed Student’s t-test. *, p<0.05. See also Tables S4, S6, S7, S8.
Mice colonized with the BSHlo consortium had significantly slower motility than BSHhi animals only in the setting of turmeric (p<0.03, one-tailed Student’s t-test; Figure 5B). UPLC-MS confirmed that BSHhi mice had significantly higher total concentrations of fecal unconjugated bile acids (p=0.01, one-tailed Student’s t-test) and significantly lower total concentrations of conjugated bile acids (p=0.02, one-tailed Student’s t-test) compared to mice colonized with the BSHlo consortium (Figure 5C, Table S6A). Total concentrations of the two unconjugated primary bile acids (cholic acid and beta-muricholic acid) were significantly negatively correlated with transit times (rho=−0.76, p=3.6×10⁻⁹, Spearman’s rank correlation). COPRO-Seq revealed that turmeric had no statistically significant effects on the representation of any strain in either consortium when compared to the unsupplemented diet phases (p>0.15, two-tailed Student’s t-test).
Applying microbial RNA-Seq to fecal samples collected at the same time points as those used for the COPRO-Seq analysis, we confirmed significantly greater overall levels of community BSH expression in the BSHhi compared to the BSHlo consortium’s meta-transcriptome (145-fold; p=0.006, two-tailed Student’s t-test). However, turmeric did not result in significant changes in the levels of BSH transcripts in the fecal meta-transcriptomes of BSHlo and BSHhi animals (p>0.05, two-tailed Student’s t-test). Enterococcus faecalis (isolate ID hG2) was the only member of the BSHlo consortium that expressed BSH, albeit at low levels (thus explaining the presence of fecal unconjugated bile acids in these animals; Figure 5C). In the BSHhi consortium, the principal contributors of BSH transcripts to the community meta-transcriptome were three Bifidobacteria (isolate IDs hB1, hB8, and hF8), which together accounted for 76%±1% (mean±s.e.m.) of these transcripts. In mice colonized with the BSHlo consortium, turmeric resulted in significant reductions in expression of two transcripts in the meta-transcriptome assigned to the KEGG ‘dioxin degradation pathway’ (5.7-fold; p=0.004, two-tailed Student’s t-test): salicylate 1-monooxygenase (EC 1.14.13.1, a oxidoreductase that produces catechol) and 4-oxalocrotonate tautomerase (EC 5.3.2.6; part of a metabolic pathway that generates TCA cycle intermediates). No KEGG pathways were significantly differentially expressed as a function of turmeric consumption in mice colonized with the BSHhi consortium. Together, these results suggest that turmeric enhances the discordance in motility phenotypes between BSHlo versus BSHhi mice not by changing expression of bacterial BSH genes but rather through its cholekinetic effect, thereby providing conjugated bile acids to the two consortia with markedly different BSH gene content and deconjugation capacities.
Effects of turmeric on host gene expression
To assess the effects of turmeric on host gene expression, we focused on the BSHlo consortium because, in the previous experiment, it transmitted a turmeric-responsive transit time phenotype. BSHlo mice were monotonously fed either the unsupplemented or turmeric-supplemented Bangladeshi diet for 10 days. The capacity of turmeric to significantly slow motility was replicated in this new, single diet phase experiment (p=0.003, one-tailed Student’s t-test comparing transit times between the two diet-treatment groups; Figure 5D). RNA-Seq datasets were generated from the liver and terminal ileum, essential components of the enterohepatic circulation. Differentially expressed genes were identified using the exact negative binomial test. Genes that satisfied our criteria for significant differences in expression (after correcting for multiple comparisons) are listed in Table S8. Transcriptional data generated from the livers of mice from the 10 day-long monotonous diet experiment indicated that turmeric consumption was followed by a homeostatic response designed to maintain bile acid pool size at constant levels: i.e., consistent with the increased fecal bile acid levels elicited by turmeric consumption, Cyp7a1 (cholesterol 7α-hydroxylase) expression was 3.3-fold lower (p=0.00002). Cyp7A1 converts cholesterol into 7α-hydroxycholesterol in the rate-limiting first step of hepatic bile acid synthesis, a step subject to feedback inhibition by increased bile acid concentrations.
In the terminal ileum, a total of 96 genes exhibited significant differential expression in the face of turmeric consumption (Table S8A), including greater expression of multiple genes involved in gut mucosal immune/barrier function: Retnlb (resistin-like molecule β, with 410-fold higher expression), Siglec5 (sialic acid binding Ig-like lectin 5, an eosinophil marker), Fut2 [α-1,2-fucosyltransferase; a null allele of this gene in humans confers non-secretor status and is associated with Crohn’s disease (Tong et al., 2014) while Fut2 deficiency in mice enhances susceptibility to infection with eukaryotic and bacterial pathogens (Goto et al., 2014; Hurd and Domino, 2004)], Nfil3 [nuclear factor, interleukin 3, a transcription factor that directs development of innate lymphoid cells (ILC) (Geiger et al., 2014; Klose et al., 2014)], Tnfrsf21 (tumor necrosis factor receptor superfamily member 21 involved in T helper cell function), and Irf2 (interferon regulatory factor 2). Retnlb is expressed by intestinal goblet cells and enterocytes (Hogan et al., 2006) and appears to have various effects on immunity, including maintenance of mucosal barrier function (Hogan et al., 2006), macrophage activation to produce TNF-α (McVay et al., 2006; Steinbrecher et al., 2011), and protection from gut helminthic infections [e.g. by inhibiting migration of worms (Artis et al., 2004; Herbert et al., 2009)]. Eosinophils, which, as noted above, express Siglec5, contribute to protective immunity against parasites (Knott et al., 2007). Nfil3 expression is linked to ILC accumulation; group 2 ILCs have been implicated in development of protective immunity to parasites (Oliphant et al., 2014) while group 3 ILCs promote Fut2 expression and mediate resistance to bacterial pathogens such as Salmonella (Goto et al., 2014). Turmeric’s ability to modulate the distal ileal transcriptome is interesting in light of the South Asian Ayurvedic tradition of using crushed turmeric as an anti-helminthic (Handral et al., 2013; Nadkarni and Nadkarni, 1976). The burden of parasitic infection in this population is great (Roy et al., 2011); our findings offer one potential biological insight about why turmeric came to be ubiquitously represented in Bangladeshi cuisine. Though it is unclear whether these findings relate to our observed motility phenotypes, they may be of anthropologic significance.
Interplay of the microbiota, bile acids, and the ENS
To assess the degree to which the effect of turmeric on motility was dependent upon ENS-based signaling (Alemi et al., 2013), we turned to mice heterozygous for a null allele of the Ret receptor (Tsuzuki et al., 1995). Ret, which encodes a transmembrane protein that binds glial cell-derived neurotrophic factor family ligands, is the gene most commonly implicated in Hirschsprung’s disease (Edery et al., 1994; Romeo et al., 1994), a developmental disorder associated with absent peristalsis in the distal colon. Heuckeroth and colleagues have reported that Ret+/− mice exhibit >90% reductions in longitudinal and circular gut muscle contractility and 70–95% reductions in the release of two neurotransmitters (substance P and VIP) compared to Ret+/+ animals despite having equivalent numbers of enteric neurons (Gianino et al., 2003). We found that conventionally raised wild-type (Ret+/+) mice have significantly slower transit times than their conventionally-raised heterozygous (Ret+/−) littermates (p=0.05, one-tailed Student’s t-test; Table S2F).
We re-derived C57BL/6 Ret+/− mice as germ-free and colonized the heterozygotes and their wild-type littermates with either the 7-member BSHlo or 7-member BSHhi consortium. Animals were subjected to a three-phase diet oscillation as in the experiments described above (unsupplemented
turmeric-supplemented
unsupplemented Bangladeshi diet; 10 days/phase). We hypothesized that if enteric neurons were key mediators of the observed phenotypes, then the difference in transit times seen between wild-type mice colonized with the two different 7-member consortia (Figure 5B) might be mitigated in Ret+/− animals. Indeed, in contrast to wild-type mice, transit times were not significantly different between Ret+/− mice harboring the two different consortia (Table S2D) despite the same pattern of differences in fecal bile acids concentrations documented by UPLC-MS in wild-type mice: Ret+/− mice colonized with the BSHlo consortium had significantly lower fecal concentrations of unconjugated bile acids compared to Ret+/− mice colonized with the BSHhi consortium in the setting of turmeric consumption (p=0.009, one-tailed Student’s t-test). As in wild-type mice, COPRO-Seq analysis showed that no bacterial strains in the Ret+/− mice were significantly correlated with turmeric consumption. Notably, a significant difference in transit times between Ret+/− and wild-type mice was only seen in mice colonized with the BSHhi bacterial consortium (diet phase 1: p=0.009, phase 2: p=0.02, phase 3: p=0.09, one-tailed Student’s t-test; p>0.05 in all analogous comparisons of Ret+/− versus wild-type mice colonized with the BSHlo consortium). Thus, while turmeric consumption has a cholekinetic effect in both wild-type and Ret+/− mice, the transit time phenotype it produces in wild-type mice is mediated by gut microbial bile acid metabolism and a functionally intact ENS.
DISCUSSION
Intestinal motility is a key physiologic parameter impacting nutritional status and gut health. The travel-associated diet changes that we model here is increasingly relevant to our daily lives during this period of rapid globalization, in which a day spent entirely in one’s hometown may nonetheless consist of consumption of foods representing several of the world’s cultures. A gnotobiotic mouse model of global travel might also incorporate additional factors that impact the gut microbiota, such as disruption of circadian rhythm (Thaiss et al., 2014) or the order in which different diets are experienced. Using gnotobiotic mice colonized with microbiota obtained from healthy individuals representing different geographic and cultural traditions and diets representative of those consumed by these donors, we were able to dissect factors that interact to define a motility phenotype. These diet-microbiota-metabolic interactions were resolved in the context of Bangladeshi microbiota through a multi-pronged strategy that involved (i) manipulating the dietary representation of a single culturally relevant spice, turmeric, (ii) selecting members of a clonally arrayed culture collection generated from a Bangladeshi donor’s microbiota, based on whether they were or were not able to support BSH-mediated bile acid deconjugation, and (iii) colonizing germ-free mice with or without a mutation in Ret, a key regulator of ENS function, with a BSHhi or BSHlo consortium.
The simulation of global travel-associated short-term diet shifts revealed that (i) diet-discriminatory bacterial strains were represented across microbiota from individuals raised in environments that are geographically and culturally distinct, and (ii) correlations between individual bacterial species abundances and transit times are largely diet-dependent: e.g., a given bacterial strain can have contrasting correlations with transit times depending upon the diet context. These findings suggest that future use of bacterial strains derived from the human gut as probiotic agents for motility disorders will require thoughtful consideration of an individual’s dietary practices and/or adjunct dietary recommendations. Reciprocally, our preclinical data suggest that dietary treatments for motility disorders need to be calibrated based on structural and functional features of an individual’s microbiota. In this respect, we find that unconjugated bile acids resulting from bacterial metabolism are consistently correlated with faster transit times across different diets and microbiota. In patients with irritable bowel syndrome, a limited number of clinical trials have suggested that a subset of patients respond to oral administration of the unconjugated bile acid chenodeoxycholate with accelerated transit times (Odunsi-Shiyanbade et al., 2010; Rao et al., 2010), consistent with our observations. Our results point to fecal BSH activity as a functional microbiota parameter that could be useful for categorizing individuals with motility disorders, allowing correlation analyses to be performed between the levels of its conjugated substrates and/or its various unconjugated bile acid products and transit time. If significantly correlated within a population, this metabolic activity could be used as a target or biomarker in clinical studies testing the effects, both short and long-term, of various therapeutic interventions.
The imperfect recovery of transit times following consumption of ‘travel’ diets, initially noted in the context of the 6-phase and 3-phase travel experiments, was also seen in our experiments involving sequential presentation of an unsupplemented, turmeric-supplemented, and unsupplemented Bangladeshi diet. Across ecosystems, history (i.e., order and temporal features of perturbations) is well known to impact community structure and function (Chase, 2003; Fukami and Morin, 2003; Pagaling et al., 2014). In this context, turmeric may influence alternative stable states (Staver et al., 2011) of the gut microbiota and ENS. Despite our practice of changing bedding between diet phases to limit carryover of ingredients, turmeric may have long-lived effects on host physiology. A sustained increase in total bile acid pool size evoked by turmeric’s cholekinetic effects seems an unlikely explanation for these observations, as bile acid concentrations in the final diet phase returned to pre-turmeric levels (Figure 5C). Follow-up experiments examining the duration of turmeric’s effects on the transcriptome of purified enteric neurons (including the TGR5 bile acid receptor (Alemi et al., 2013)) in combination with analyses of the microbiota and its metabolic features, localization of motility effects (i.e., gastric, small intestinal, and/or colonic), and production of neuroactive compounds such as serotonin by enteroendocrine cells (Yano et al., 2015), could reveal and help characterize this postulated turmeric-induced alternative stable state.
Other dietary ingredients (e.g. polysaccharides (Kashyap et al., 2013)) and products of bacterial metabolism (e.g. butyrate (Soret et al., 2010)) have been previously described to impact motility in mouse models. Populations experiencing shifting cultural/culinary traditions through travel, immigration or emigration, are susceptible to marked changes in their gut microbiota, both structural and functional, which may have downstream health consequences. In principle, our approach could be used to identify and characterize the biological activities and microbiota interactions of dietary components characteristic of dietary/cultural traditions established over centuries but now vulnerable to diminished use due to Westernization. Their exclusion from modern diets may represent a loss of key food ingredients that could be used to promote health in contemporary societies. These ingredients may also serve as valuable tools for identifying and characterizing mechanisms by which food and the microbiota interact to affect various features of our physiology.
EXPERIMENTAL PROCEDURES
Measurement of gastrointestinal transit times using non-absorbable red carmine dye
Carmine red (Sigma-Aldrich, St. Louis, MO) was prepared as a 6% (w/v) solution in 0.5% methylcellulose (Sigma-Aldrich) and autoclaved prior to import into gnotobiotic isolators. Mice were maintained on a strict 12h light cycle (lights on between 06:00 and 18:00) and gavaged with 150 μL of the carmine solution between 08:00 and 08:30 local time. Animals were not fasted beforehand. Feces were collected every 30 minutes (up to 8 hours from time of gavage) and streaked across a sterile white napkin to assay for the presence of the red carmine dye. The time from gavage to initial appearance of carmine in the feces was recorded as the total intestinal transit time for that animal.
Generating a clonally arrayed culture collection of anaerobic bacterial strains from the fecal microbiota of a healthy 24 month-old Bangladeshi child
A clonally arrayed culture collection was generated using methods described in an earlier publication (Goodman et al., 2011). A given well of the 96-well plate used to archive the collection contained a monoculture of a single isolate. Each isolate’s genome was sequenced using an Illumina MiSeq or HiSeq instrument [250 nucleotide (nt) and 101 nt paired end reads, respectively; 53±4.8-fold (mean±s.e.m.) genome coverage]. Genomes were assembled using MIRA (Chevreux et al., 1999) (N50 contig length: 23,253 ± 2,669 bp; range, 735–112,622 bp). Assemblies were annotated using Prokka (version 1.10) (Seemann, 2014). Predicted genes were mapped to KEGG pathways by querying the KEGG reference database (release 72.1) and assigning their protein products to KEGG Ortholog (KO) groups (BLAST 2.2.29+, blastp E-value threshold ≤10−10, single best hit defined by E-value and bit score) (Kanehisa and Goto, 2000; Kanehisa et al., 2014). Species-level taxonomic identities of bacterial isolates were defined by Sanger capillary sequencing of full-length 16S rRNA gene amplicons generated using the universal 8F and 1391R PCR primers, with classifications performed using the Ribosomal Database Project (RDP) version 2.4 classifier (Ridaura et al., 2013). Strain-level taxonomic classifications were subsequently determined based on a minimum 96% genome identity [calculated by the software package NUCmer (Kurtz et al., 2004)] between sequenced isolates bearing the same 16S rRNA-based taxonomy. A total of 53 unique strains were identified using this 96% identity cutoff threshold and grown in modified gut microbiota medium (mGMM) containing ingredients described in a previous publication (Goodman et al., 2011) but without short chain fatty acid supplementation. Strains were stored at −80°C in 15% glycerol (v/v) in reduced PBS until used for gavage of germ-free mice.
In vitro assays for bile acid deconjugation
We screened each of the 91 isolates, comprising 53 strains, in the clonally arrayed culture collection for their capacity to deconjugate bile acids. The two predominant primary bile acids in mice, taurocholic acid (TCA; Sigma-Aldrich, St. Louis, MO) and tauro-beta-muricholic acid (TbMCA; Santa Cruz Biotechnology, Santa Cruz, CA), were dissolved in water at concentrations of 100 mg/mL and 10 mg/mL, respectively. Each isolate was first incubated in 1 mL of mGMM containing 100 μM TCA for 48 h in an anaerobic Coy chamber (75% N2, 20% CO2, and 5% H2) with growth monitored based on OD600. Cells were then pelleted by centrifugation (17,900 x g for 7 minutes at 4°C), and the resulting supernatant subjected to ultra high performance liquid chromatography-mass spectrometry (UPLC-MS; see details below) to assess levels (peak intensities) of unconjugated and conjugated bile acids (cholic acid and taurocholic acid [TCA], respectively). For the vast majority of isolates, bile acid profiles at 48 hours were either all conjugated or unconjugated. Growth of bacterial isolates was simultaneously assessed by measuring optical densities at 600 nm to ensure that a lack of deconjugation was not simply a reflection of a lack of bacterial viability. If no deconjugation was observed, we performed a secondary screen where isolates were incubated in 1 mL of mGMM containing 100 μM tauro-beta-muricholic acid (TbMCA) for 48 hours in an anaerobic chamber, followed by UPLC-MS quantitation of the levels of unconjugated (beta-muricholic acid) and conjugated (TbMCA) bile acids. Bacterial isolates that did not deconjugate either bile acid in vitro were considered as eligible for the BSHlo consortium. See Supplemental Information for additional protocols.
Supplementary Material
Article highlights.
Gut motility is affected by different human gut microbiota-by-diet combinations (81 characters)
Turmeric slows motility in gnotobiotic mice with a Bangladeshi microbiota/diet (80 characters)
Turmeric’s effect involves bile acid secretion/deconjugation & Ret signaling (78 characters)
Gnotobiotic mice can define key interactions between traditional foods & microbiota (85 characters)
Acknowledgments
We are grateful to Robert Heuckeroth (University of Pennsylvania) for generously providing Ret+/− mice, Maria Gloria Dominguez-Bello (New York University) for her leadership in obtaining fecal samples from Amerindians in an earlier collaborative study, Andreea Soare for her assistance in obtaining fecal samples and diet records from individuals consuming a primal diet, David O’Donnell and Maria Karlsson for their assistance with gnotobiotic husbandry, Sabrina Wagoner, Janaki Lelwala-Guruge, Martin Meier, and Jessica Hoisington-Lopez for their invaluable technical assistance, and Vanessa Ridaura, Sathish Subramanian, Ansel Hsiao, Matthew Hibberd, Nicholas Griffin, Nathan McNulty, Philip Ahern, and other members of the Gordon lab for their helpful suggestions. This work was supported by grants from the NIH (DK30292, DK70977, DK078669), the Bill and Melinda Gates Foundation, and the Crohn’s and Colitis Foundation of America. N.D. is the recipient of a Young Investigator Grant for Probiotics Research from the Global Probiotics Council. J.I.G. is cofounder of Matatu Inc., a company characterizing the role of diet-by-microbiota interactions in animal health.
Footnotes
ACCESSION NUMBERS
Bacterial V4-16S rRNA amplicon datasets, whole genome shotgun sequencing datasets from cultured bacterial strains, plus microbial and host RNA-Seq datasets have been deposited in the European Nucleotide Archive (ENA) under the study accession number PRJEB9169.
AUTHOR CONTRIBUTIONS
N.D., L.V.B., J.C., and J.I.G. designed the experiments; N.D., V.E.W., L.V.B, and J.C. generated the data; V.E.W. generated the clonally arrayed bacterial culture collection; L.F. provided microbiota samples and dietary data from primal dieters; T.A. and R.H. provided microbiota samples and dietary data from Bangladeshi individuals; N.D. and J.I.G. analyzed the data and wrote the paper.
Publisher's Disclaimer: This is a PDF file of an unedited manuscript that has been accepted for publication. As a service to our customers we are providing this early version of the manuscript. The manuscript will undergo copyediting, typesetting, and review of the resulting proof before it is published in its final citable form. Please note that during the production process errors may be discovered which could affect the content, and all legal disclaimers that apply to the journal pertain.
References
- Alemi F, Poole DP, Chiu J, Schoonjans K, Cattaruzza F, Grider JR, Bunnett NW, Corvera CU. The receptor TGR5 mediates the prokinetic actions of intestinal bile acids and is required for normal defecation in mice. Gastroenterology. 2013;144:145–154. doi: 10.1053/j.gastro.2012.09.055. [DOI] [PMC free article] [PubMed] [Google Scholar]
- Artis D, Wang ML, Keilbaugh SA, He W, Brenes M, Swain GP, Knight PA, Donaldson DD, Lazar MA, Miller HRP, et al. RELMbeta/FIZZ2 is a goblet cell-specific immune-effector molecule in the gastrointestinal tract. Proc Natl Acad Sci U S A. 2004;101:13596–13600. doi: 10.1073/pnas.0404034101. [DOI] [PMC free article] [PubMed] [Google Scholar]
- Burkitt DP, Walker ARP, Painter NS. Effect of dietary fibre on stools and the transit-times, and its role in the causation of disease. The Lancet. 1972;300:1408–1411. doi: 10.1016/s0140-6736(72)92974-1. [DOI] [PubMed] [Google Scholar]
- Chase JM. Community assembly: when should history matter? Oecologia. 2003;136:489–498. doi: 10.1007/s00442-003-1311-7. [DOI] [PubMed] [Google Scholar]
- Chevreux B, Wetter T, Suhai S. Genome Sequence Assembly Using Trace Signals and Additional Sequence Information. Comput Sci Biol Proc Ger Conf Bioinforma GCB. 1999;99:45–56. [Google Scholar]
- Cummings JH, Jenkins DJ, Wiggins HS. Measurement of the mean transit time of dietary residue through the human gut. Gut. 1976;17:210–218. doi: 10.1136/gut.17.3.210. [DOI] [PMC free article] [PubMed] [Google Scholar]
- Cummings JH, Wiggins HS, Jenkins DJ, Houston H, Jivraj T, Drasar BS, Hill MJ. Influence of diets high and low in animal fat on bowel habit, gastrointestinal transit time, fecal microflora, bile acid, and fat excretion. J Clin Invest. 1978;61:953–963. doi: 10.1172/JCI109020. [DOI] [PMC free article] [PubMed] [Google Scholar]
- Drasar BS, Hill MJ, Shiner M. The deconjugation of bile salts by human intestinal bacteria. Lancet. 1966;1:1237–1238. doi: 10.1016/s0140-6736(66)90242-x. [DOI] [PubMed] [Google Scholar]
- Edery P, Lyonnet S, Mulligan LM, Pelet A, Dow E, Abel L, Holder S, Nihoul-Fékété C, Ponder BA, Munnich A. Mutations of the RET proto-oncogene in Hirschsprung’s disease. Nature. 1994;367:378–380. doi: 10.1038/367378a0. [DOI] [PubMed] [Google Scholar]
- Falany CN, Johnson MR, Barnes S, Diasio RB. Glycine and taurine conjugation of bile acids by a single enzyme. Molecular cloning and expression of human liver bile acid CoA:amino acid N-acyltransferase. J Biol Chem. 1994;269:19375–19379. [PubMed] [Google Scholar]
- Falany CN, Fortinberry H, Leiter EH, Barnes S. Cloning, expression, and chromosomal localization of mouse liver bile acid CoA:amino acid N-acyltransferase. J Lipid Res. 1997;38:1139–1148. [PubMed] [Google Scholar]
- Fukami T, Morin PJ. Productivity-biodiversity relationships depend on the history of community assembly. Nature. 2003;424:423–426. doi: 10.1038/nature01785. [DOI] [PubMed] [Google Scholar]
- Geiger TL, Abt MC, Gasteiger G, Firth MA, O’Connor MH, Geary CD, O’Sullivan TE, van den Brink MR, Pamer EG, Hanash AM, et al. Nfil3 is crucial for development of innate lymphoid cells and host protection against intestinal pathogens. J Exp Med. 2014;211:1723–1731. doi: 10.1084/jem.20140212. [DOI] [PMC free article] [PubMed] [Google Scholar]
- Gianino S, Grider JR, Cresswell J, Enomoto H, Heuckeroth RO. GDNF availability determines enteric neuron number by controlling precursor proliferation. Development. 2003;130:2187–2198. doi: 10.1242/dev.00433. [DOI] [PubMed] [Google Scholar]
- Goodman AL, Kallstrom G, Faith JJ, Reyes A, Moore A, Dantas G, Gordon JI. Extensive personal human gut microbiota culture collections characterized and manipulated in gnotobiotic mice. Proc Natl Acad Sci U S A. 2011;108:6252–6257. doi: 10.1073/pnas.1102938108. [DOI] [PMC free article] [PubMed] [Google Scholar]
- Goto Y, Obata T, Kunisawa J, Sato S, Ivanov II, Lamichhane A, Takeyama N, Kamioka M, Sakamoto M, Matsuki T, et al. Innate lymphoid cells regulate intestinal epithelial cell glycosylation. Science. 2014;345:1254009. doi: 10.1126/science.1254009. [DOI] [PMC free article] [PubMed] [Google Scholar]
- Handral HK, Duggi S, Handral R, GT, DSS Turmeric: Nature’s precious medicine. Asian J Pharm Clin Res. 2013;6:10–16. [Google Scholar]
- Haslewood GA. Bile salt evolution. J Lipid Res. 1967;8:535–550. [PubMed] [Google Scholar]
- Herbert DR, Yang JQ, Hogan SP, Groschwitz K, Khodoun M, Munitz A, Orekov T, Perkins C, Wang Q, Brombacher F, et al. Intestinal epithelial cell secretion of RELM-beta protects against gastrointestinal worm infection. J Exp Med. 2009;206:2947–2957. doi: 10.1084/jem.20091268. [DOI] [PMC free article] [PubMed] [Google Scholar]
- Hogan SP, Seidu L, Blanchard C, Groschwitz K, Mishra A, Karow ML, Ahrens R, Artis D, Murphy AJ, Valenzuela DM, et al. Resistin-like molecule β regulates innate colonic function: Barrier integrity and inflammation susceptibility. J Allergy Clin Immunol. 2006;118:257–268. doi: 10.1016/j.jaci.2006.04.039. [DOI] [PMC free article] [PubMed] [Google Scholar]
- Hurd EA, Domino SE. Increased susceptibility of secretor factor gene Fut2-null mice to experimental vaginal candidiasis. Infect Immun. 2004;72:4279–4281. doi: 10.1128/IAI.72.7.4279-4281.2004. [DOI] [PMC free article] [PubMed] [Google Scholar]
- Husebye E, Hellström PM, Midtvedt T. Intestinal microflora stimulates myoelectric activity of rat small intestine by promoting cyclic initiation and aboral propagation of migrating myoelectric complex. Dig Dis Sci. 1994;39:946–956. doi: 10.1007/BF02087542. [DOI] [PubMed] [Google Scholar]
- Husebye E, Hellström PM, Sundler F, Chen J, Midtvedt T. Influence of microbial species on small intestinal myoelectric activity and transit in germ-free rats. Am J Physiol - Gastrointest Liver Physiol. 2001;280:G368–G380. doi: 10.1152/ajpgi.2001.280.3.G368. [DOI] [PubMed] [Google Scholar]
- Kanehisa M, Goto S. KEGG: kyoto encyclopedia of genes and genomes. Nucleic Acids Res. 2000;28:27–30. doi: 10.1093/nar/28.1.27. [DOI] [PMC free article] [PubMed] [Google Scholar]
- Kanehisa M, Goto S, Sato Y, Kawashima M, Furumichi M, Tanabe M. Data, information, knowledge and principle: back to metabolism in KEGG. Nucleic Acids Res. 2014;42:D199–D205. doi: 10.1093/nar/gkt1076. [DOI] [PMC free article] [PubMed] [Google Scholar]
- Kashyap PC, Marcobal A, Ursell LK, Larauche M, Duboc H, Earle KA, Sonnenburg ED, Ferreyra JA, Higginbottom SK, Million M, et al. Complex interactions among diet, gastrointestinal transit, and gut microbiota in humanized mice. Gastroenterology. 2013;144:967–977. doi: 10.1053/j.gastro.2013.01.047. [DOI] [PMC free article] [PubMed] [Google Scholar]
- Klose CSN, Flach M, Möhle L, Rogell L, Hoyler T, Ebert K, Fabiunke C, Pfeifer D, Sexl V, Fonseca-Pereira D, et al. Differentiation of type 1 ILCs from a common progenitor to all helper-like innate lymphoid cell lineages. Cell. 2014;157:340–356. doi: 10.1016/j.cell.2014.03.030. [DOI] [PubMed] [Google Scholar]
- Knott ML, Matthaei KI, Giacomin PR, Wang H, Foster PS, Dent LA. Impaired resistance in early secondary Nippostrongylus brasiliensis infections in mice with defective eosinophilopoeisis. Int J Parasitol. 2007;37:1367–1378. doi: 10.1016/j.ijpara.2007.04.006. [DOI] [PubMed] [Google Scholar]
- Kurtz S, Phillippy A, Delcher AL, Smoot M, Shumway M, Antonescu C, Salzberg SL. Versatile and open software for comparing large genomes. Genome Biol. 2004;5:R12. doi: 10.1186/gb-2004-5-2-r12. [DOI] [PMC free article] [PubMed] [Google Scholar]
- Levy RL, Whitehead WE, Korff MRV, Feld AD. Intergenerational transmission of gastrointestinal illness behavior. Am J Gastroenterol. 2000;95:451–456. doi: 10.1111/j.1572-0241.2000.01766.x. [DOI] [PubMed] [Google Scholar]
- Li Z, Chalazonitis A, Huang Y, Mann JJ, Margolis KG, Yang QM, Kim DO, Côté F, Mallet J, Gershon MD. Essential Roles of Enteric Neuronal Serotonin in Gastrointestinal Motility and the Development/Survival of Enteric Dopaminergic Neurons. J Neurosci. 2011;31:8998–9009. doi: 10.1523/JNEUROSCI.6684-10.2011. [DOI] [PMC free article] [PubMed] [Google Scholar]
- Lozupone C, Knight R. UniFrac: a new phylogenetic method for comparing microbial communities. Appl Environ Microbiol. 2005;71:8228–8235. doi: 10.1128/AEM.71.12.8228-8235.2005. [DOI] [PMC free article] [PubMed] [Google Scholar]
- Marciani L, Cox EF, Hoad CL, Totman JJ, Costigan C, Singh G, Shepherd V, Chalkley L, Robinson M, Ison R, et al. Effects of various food ingredients on gall bladder emptying. Eur J Clin Nutr. 2013;67:1182–1187. doi: 10.1038/ejcn.2013.168. [DOI] [PMC free article] [PubMed] [Google Scholar]
- McVay LD, Keilbaugh SA, Wong TMH, Kierstein S, Shin ME, Lehrke M, Lefterova MI, Shifflett DE, Barnes SL, Cominelli F, et al. Absence of bacterially induced RELMbeta reduces injury in the dextran sodium sulfate model of colitis. J Clin Invest. 2006;116:2914–2923. doi: 10.1172/JCI28121. [DOI] [PMC free article] [PubMed] [Google Scholar]
- Nadkarni KM, Nadkarni AK. Indian Materia Medica. Mumbai: M/S Popular Prakashan Pvt, (Ltd); 1976. pp. 1175–1181. [Google Scholar]
- Odunsi-Shiyanbade ST, Camilleri M, McKinzie S, Burton D, Carlson P, Busciglio IA, Lamsam J, Singh R, Zinsmeister AR. Effects of chenodeoxycholate and a bile acid sequestrant, colesevelam, on intestinal transit and bowel function. Clin Gastroenterol Hepatol Off Clin Pract J Am Gastroenterol Assoc. 2010;8:159–165. doi: 10.1016/j.cgh.2009.10.020. [DOI] [PMC free article] [PubMed] [Google Scholar]
- Oliphant CJ, Hwang YY, Walker JA, Salimi M, Wong SH, Brewer JM, Englezakis A, Barlow JL, Hams E, Scanlon ST, et al. MHCII-mediated dialog between group 2 innate lymphoid cells and CD4(+) T cells potentiates type 2 immunity and promotes parasitic helminth expulsion. Immunity. 2014;41:283–295. doi: 10.1016/j.immuni.2014.06.016. [DOI] [PMC free article] [PubMed] [Google Scholar]
- Pagaling E, Strathdee F, Spears BM, Cates ME, Allen RJ, Free A. Community history affects the predictability of microbial ecosystem development. ISME J. 2014;8:19–30. doi: 10.1038/ismej.2013.150. [DOI] [PMC free article] [PubMed] [Google Scholar]
- Rao AS, Wong BS, Camilleri M, Odunsi-Shiyanbade ST, McKinzie S, Ryks M, Burton D, Carlson P, Lamsam J, Singh R, et al. Chenodeoxycholate in females with irritable bowel syndrome-constipation: a pharmacodynamic and pharmacogenetic analysis. Gastroenterology. 2010;139:1549–1558. 1558.e1. doi: 10.1053/j.gastro.2010.07.052. [DOI] [PMC free article] [PubMed] [Google Scholar]
- Rasyid A, Lelo A. The effect of curcumin and placebo on human gall-bladder function: an ultrasound study. Aliment Pharmacol Ther. 1999;13:245–249. doi: 10.1046/j.1365-2036.1999.00464.x. [DOI] [PubMed] [Google Scholar]
- Rasyid A, Rahman ARA, Jaalam K, Lelo A. Effect of different curcumin dosages on human gall bladder. Asia Pac J Clin Nutr. 2002;11:314–318. doi: 10.1046/j.1440-6047.2002.00296.x. [DOI] [PubMed] [Google Scholar]
- Ridaura VK, Faith JJ, Rey FE, Cheng J, Duncan AE, Kau AL, Griffin NW, Lombard V, Henrissat B, Bain JR, et al. Gut Microbiota from Twins Discordant for Obesity Modulate Metabolism in Mice. Science. 2013;341:1241214. doi: 10.1126/science.1241214. [DOI] [PMC free article] [PubMed] [Google Scholar]
- Romeo G, Ronchetto P, Luo Y, Barone V, Seri M, Ceccherini I, Pasini B, Bocciardi R, Lerone M, Kääriäinen H. Point mutations affecting the tyrosine kinase domain of the RET proto-oncogene in Hirschsprung’s disease. Nature. 1994;367:377–378. doi: 10.1038/367377a0. [DOI] [PubMed] [Google Scholar]
- Roy E, Hasan KZ, Haque R, Haque AF, Siddique AK, Sack RB. Patterns and risk factors for helminthiasis in rural children aged under 2 in Bangladesh. South Afr J Child Health. 2011;5:78–84. [Google Scholar]
- Seemann T. Prokka: rapid prokaryotic genome annotation. Bioinforma Oxf Engl. 2014;30:2068–2069. doi: 10.1093/bioinformatics/btu153. [DOI] [PubMed] [Google Scholar]
- Shimouchi A, Nose K, Takaoka M, Hayashi H, Kondo T. Effect of dietary turmeric on breath hydrogen. Dig Dis Sci. 2009;54:1725–1729. doi: 10.1007/s10620-008-0550-1. [DOI] [PubMed] [Google Scholar]
- Soret R, Chevalier J, De Coppet P, Poupeau G, Derkinderen P, Segain JP, Neunlist M. Short-Chain Fatty Acids Regulate the Enteric Neurons and Control Gastrointestinal Motility in Rats. Gastroenterology. 2010;138:1772–1782. doi: 10.1053/j.gastro.2010.01.053. [DOI] [PubMed] [Google Scholar]
- Staver AC, Archibald S, Levin S. Tree cover in sub-Saharan Africa: rainfall and fire constrain forest and savanna as alternative stable states. Ecology. 2011;92:1063–1072. doi: 10.1890/10-1684.1. [DOI] [PubMed] [Google Scholar]
- Steinbrecher KA, Harmel-Laws E, Garin-Laflam MP, Mann EA, Bezerra LD, Hogan SP, Cohen MB. Murine guanylate cyclase C regulates colonic injury and inflammation. J Immunol. 2011;186:7205–7214. doi: 10.4049/jimmunol.1002469. [DOI] [PMC free article] [PubMed] [Google Scholar]
- Subramanian S, Huq S, Yatsunenko T, Haque R, Mahfuz M, Alam MA, Benezra A, DeStefano J, Meier MF, Muegge BD, et al. Persistent gut microbiota immaturity in malnourished Bangladeshi children. Nature. 2014;510:417–421. doi: 10.1038/nature13421. [DOI] [PMC free article] [PubMed] [Google Scholar]
- Thaiss CA, Zeevi D, Levy M, Zilberman-Schapira G, Suez J, Tengeler AC, Abramson L, Katz MN, Korem T, Zmora N, et al. Transkingdom control of microbiota diurnal oscillations promotes metabolic homeostasis. Cell. 2014;159:514–529. doi: 10.1016/j.cell.2014.09.048. [DOI] [PubMed] [Google Scholar]
- Tong M, McHardy I, Ruegger P, Goudarzi M, Kashyap PC, Haritunians T, Li X, Graeber TG, Schwager E, Huttenhower C, et al. Reprograming of gut microbiome energy metabolism by the FUT2 Crohn’s disease risk polymorphism. ISME J. 2014 doi: 10.1038/ismej.2014.64. [DOI] [PMC free article] [PubMed] [Google Scholar]
- Tsuzuki T, Takahashi M, Asai N, Iwashita T, Matsuyama M, Asai J. Spatial and temporal expression of the ret proto-oncogene product in embryonic, infant and adult rat tissues. Oncogene. 1995;10:191–198. [PubMed] [Google Scholar]
- Whorwell PJ, McCallum M, Creed FH, Roberts CT. Non-colonic features of irritable bowel syndrome. Gut. 1986;27:37–40. doi: 10.1136/gut.27.1.37. [DOI] [PMC free article] [PubMed] [Google Scholar]
- Wichmann A, Allahyar A, Greiner TU, Plovier H, Lundén GÖ, Larsson T, Drucker DJ, Delzenne NM, Cani PD, Bäckhed F. Microbial Modulation of Energy Availability in the Colon Regulates Intestinal Transit. Cell Host Microbe. 2013;14:582–590. doi: 10.1016/j.chom.2013.09.012. [DOI] [PubMed] [Google Scholar]
- Yano JM, Yu K, Donaldson GP, Shastri GG, Ann P, Ma L, Nagler CR, Ismagilov RF, Mazmanian SK, Hsiao EY. Indigenous bacteria from the gut microbiota regulate host serotonin biosynthesis. Cell. 2015;161:264–276. doi: 10.1016/j.cell.2015.02.047. [DOI] [PMC free article] [PubMed] [Google Scholar]
- Yatsunenko T, Rey FE, Manary MJ, Trehan I, Dominguez-Bello MG, Contreras M, Magris M, Hidalgo G, Baldassano RN, Anokhin AP, et al. Human gut microbiome viewed across age and geography. Nature. 2012;486:222–227. doi: 10.1038/nature11053. [DOI] [PMC free article] [PubMed] [Google Scholar]
Associated Data
This section collects any data citations, data availability statements, or supplementary materials included in this article.