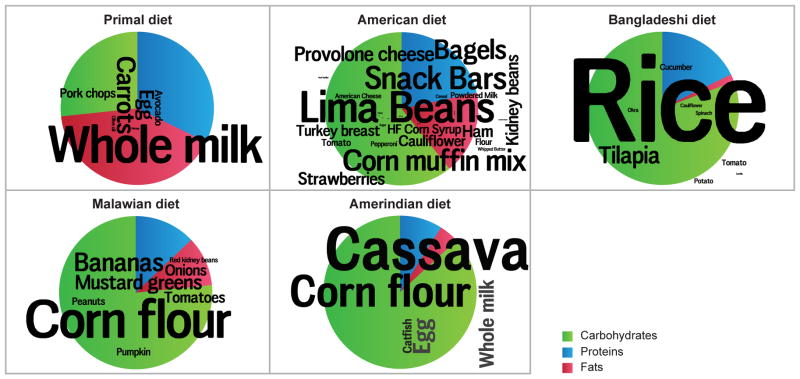
Figure 1. Compositions of diets used in the 6-phase travel experiment.
In the foreground, word clouds convey the specific ingredients used: font sizes depict the weight-based proportional representations of ingredients within each diet. Pie charts in the background present the macromolecular compositions. See also Table S1.

