

Abstract
Long non-coding RNAs (lncRNAs) are emerging in molecular biology as crucial regulators of cancer. The efficacy of doxorubicin--based chemotherapy in osteosarcoma (OS) is usually limited by acquired drug resistance. To explore the mechanism of chemoresistance of OS in terms of lncRNA, using a human lncRNA-mRNA combined microarray, we identified 3,465 lncRNAs (1,761 up and 1,704 down) and 3,278 mRNAs (1,607 up and 1,671 down) aberrantly expressed in all three sets of doxorubicin-resistant MG63/DXR and their paired parental MG63 cells (fold-change >2.0, P<0.05 and FDR <0.05). Fifteen randomly selected lncRNAs were dysregulated in MG63/DXR cells relative to MG63 cells by qRT-PCR detection, which were consistent with our microarray data. Bioinformatics analysis identified that classical genes and pathways involved in cell proliferation, apoptosis, and drug metabolism were differently expressed in these cell lines. A lncRNA-mRNA co-expression network identified lncRNAs, including ENST00000563280 and NR-036444, may play a critical role in doxorubicin-resistance of OS by interacting with important genes such as ABCB1, HIF1A and FOXC2. Besides, we found that lncRNA ENST00000563280 was distinctly increased in specimens of OS patients with a poor chemoresponse compared to those with a good chemoresponse and the patients of lower expression of it may survive longer than those of higher expression, which suggest that it may serve as a biomarker to predict the chemoresponse and prognosis of osteosarcoma patients. These results provide important insights about the lncRNAs involved in osteosarcoma chemoresistance and lay a solid foundation for uncovering the mechanism ultimately.
Keywords: Osteosarcoma, long-noncoding RNA, drug-resistant, chemoresistance
Introduction
Osteosarcoma is the most common primary malignant bone tumor in children and adolescents, making up approximately 15% of all bone tumors [1]. With the application of adjuvant and neoadjuvant chemotherapy, the survival rate in osteosarcoma patients with localized disease has been largely increased [2]. However, despite improvements in osteosarcoma therapy over the last two decades, the overall survival of patients has reached a plateau [3]. To a certain extent, the reason behind this may be attributed to chemoresistance of tumors to anti-OS therapy [4].
To elucidate the underlying mechanisms of chemoresistance in OS, extensive genetic and molecular analyses have been performed. Results from these studies have revealed multiple biological changes, such as perturbations to cell cycle regulation, overexpression of ABC membrane transporter family members, disorders of cell death pathways and aberrant metabolic pathways [4-6]. In turn, these alterations could lead to decreased intracellular drug accumulation [7], drug inactivation [8], enhanced DNA repair [9], perturbations in signal transduction pathways [10], apoptosis- and autophagy-related chemoresistance [11,12], microRNA (miRNA) dysregulation [13,14] and cancer stem cell (CSC)-mediated drug resistance [15,16]. Previous studies have proposed a number of potential mechanisms of chemoresistance in OS, but almost none of the currently available methods are able to effectively reverse chemoresistance in OS. New molecular therapeutic targets for OS chemoresistance are still urgently needed. Thus, in order to improve the effectiveness of current cancer therapies and to find new targets for chemotherapies, it is necessary to better understand the global molecular changes that occur during the progression of drug-resistance induction.
With the advance of next generation sequencing methods and progress in transcriptome analysis, people have identified that at least 90% of the entire human genome is transcribed as non-coding RNAs (ncRNAs) [17]. On the basis of transcript size, ncRNAs of less than 200 nt in length are classified as small RNAs and include well known subtypes such as tRNAs, rRNAs, small nuclear RNAs (snRNAs), small nucleolar RNAs (snoRNAs), and miRNAs, which are constitutively expressed and play crucial roles in protein biosynthesis. In contrast, long non-coding RNAs (lncRNAs) are defined as eukaryote RNAs longer than 200 nucleotides in length, without protein coding capacity [18]. LncRNAs could regulate expression of neighboring protein-coding genes that have a pivotal role in development or disease progression, and also regulate gene expression via a trans-acting mechanism by associating with protein complexes, such as chromatin modifiers, transcription factors, splicing factors, or RNA decay machinery in levels of transcription, posttranscriptional modification and even translation. Thus, analysis of the co-expression of lncRNAs and mRNA can help predict their functional role in the development of various diseases, including cancer and lay a foundation for further mechanism studies. However, to date we found no studies that have discussed the roles of lncRNAs in acquisition of doxorubicin resistance by osteosarcoma, and the global pathological contribution of lncRNAs to drug-resistance in OS remains largely unknown.
To investigate the potential role of lncRNA in regulating the development of chemoresistance in OS, in this study, we described a comprehensive analysis of lncRNAs and mRNAs in the human doxorubicin-resistant osteosarcoma cell line MG63/DXR and its matched MG63 parental cell line using microarray analysis. We then classified the lncRNAs and predicted the possible functions of those that were differentially expressed. In addition, we constructed a mRNA-lncRNA co-expression network among the differently expressed lncRNAs and their related co-expressed genes, such as ABCB1, HIFA and so on. These findings may provide novel insights into mechanism of drug-resistance in osteosarcoma patients. Then we preliminarily explored the potential clinical significance of one of the validated lncRNAs.
Materials and methods
Cell lines and culture conditions
The MG63 human osteosarcoma cell line (American Type Culture Collection, ATCC, No. CRL-1427) was cultured in Dulbecco’s modified Eagle’s medium (Advanced DMEM, Gibco. Cat.12491-015, California, USA) supplemented with 10% fetal bovine serum (Gibco, Gran Island, NY, USA). The doxorubicin-resistant osteosarcoma cell line MG63/DXR, kindly provided by Dr. Yoshio Oda [19], was selected in a step-wise manner by exposing drug-sensitive MG63 cells to increasing doses of doxorubicin (DXR). The surviving cells were then maintained in the conditioned medium plus with 1 μg/ml DXR (Sigma-Aldrich, Cat. No. D1515, Missouri, USA) to maintain its drug-resistant phenotype.
Clinical samples and histological response evaluation
A total 60 of patient’s specimens were used in this study. All patients have received same multidrug chemotherapy before surgery. 60 primary osteosarcoma tissues were obtained from patients who underwent complete resection at the Shanghai Tenth Hospital between 2006 and 2014. All the specimens were gently washed with normal saline to remove excess blood, and placed immediately into liquid nitrogen and then stored at -80°C after surgery. Written informed consent was obtained from all patients. After preoperative chemotherapy, the tumors were resected and an expert panel of pathologists reviewed the histologic response. When the percentage of tumor necrosis was ≥90%, the patients were classified as good responders, and when the percentage of tumor necrosis was lower than 90%, the patients were defied as poor responders [20].
MTT assay
To measure differences in chemoresistance between MG63/DXR and MG63 cells, the number of viable cells in the two groups was determined at daily intervals (0, 24, 48 and 72 h) by MTT assay. Each well was treated with 15 μl of MTT (5 mg/ml). The supernatant was removed after 4 h and replaced with 100 μl of dimethyl sulfoxide (DMSO). The dye crystals were dissolved, and absorbance was measured at 570 nm. For DXR cytotoxicity measurements, cells were treated with doxorubicin for 48 h with concentrations ranging from 0.20 μg/ml to 25.6 μg/ml. MTT was then applied, followed by DMSO as described above. Absorbance was also measured, at 570 nm. The 50% inhibitory concentration (IC50) was calculated. Each experiment was performed in triplicate and repeated three times.
RNA isolation
Total RNA was isolated using TrIzol reagent (Invitrogen, CA, USA). Total RNA from each specimen was quantified using a NanoDrop ND-1000 spectrophotometer (OD 260 nm, NanoDrop, Wilmington, DE, USA). RNA integrity was assessed using standard denaturing agarose gel electrophoresis, and the purity was estimated by the ratio of absorbance at 260 to 280 nm (A260/A280).
LncRNA microarray
The Human LncRNA Microarray V3.0 (Arraystar Inc., MD, USA) is designed for the global profiling of human LncRNAs and protein-coding transcripts. Approximately 30,586 LncRNAs and 26,109 coding transcripts were collected from authoritative data sources including Refseq, UCSC known genes, Gencode, and landmark publications.
RNA labeling and array hybridization
In our study, double-strand cDNA (ds-cDNA) was synthesized from 5 μg of total RNA using an Invitrogen SuperScript ds-cDNA synthesis kit in the presence of 100 pmol oligo dT primers. The ds-cDNA was cleaned and labeled in accordance with the NimbleGen Gene Expression Analysis protocol (NimbleGen Systems, Inc., USA). Briefly, ds-cDNA was incubated with 4 μg RNase A at 37°C for 10 min, and then cleaned using phenol: chloroform: isoamyl alcohol followed by ice-cold absolute ethanol precipitation. The purified cDNA was quantified using a NanoDrop ND-1000 and labeled with Cy3 using a NimbleGen One-Color DNA labeling kit according to the manufacturer’s guidelines detailed in the Gene Expression Analysis protocol (NimbleGen Systems, Inc., Madison, WI, USA). A total of 1 μg of ds-cDNA was incubated for 10 min at 98°C with 1 OD of Cy3-9 mer primer. In addition, 100 pmol of deoxynucleoside triphosphates and 100 U of the Klenow fragment (New England Biolabs, USA) were added, and the mix was incubated at 37°C for 2 h. The reaction was stopped by adding 0.1 volume of 0.5 M EDTA, and the labeled ds-cDNA was purified by isopropanol/ethanol precipitation. Microarrays were hybridized at 42°C for 16-20 h with 4 μg of Cy3-labeled ds-cDNA in NimbleGen hybridization buffer/hybridization component A in a hybridization chamber (Hybridization System-NimbleGen Systems, Inc., Madison, WI, USA). Following hybridization, washing was performed using the NimbleGen Wash Buffer kit (NimbleGen Systems, Inc., Madison, WI, USA). After being washed in an ozone-free environment, the slides were scanned using an Axon GenePix 4000B microarray scanner. The microarray analysis was performed by KangChen Bio-tech, Shanghai, PR China.
Data analysis
All of the slides were scanned at 5 μm/pixel resolution using an Axon GenePix 4000B scanner (Molecular Devices Corporation) running GenePix Pro 6.0 software (Axon). Scanned images (JPEG format) were then imported into NimbleScan software (version 2.5) for grid alignment and expression data analysis. Expression data were normalized by quantile normalization with the Robust Multichip Average (RMA) algorithm included in the nimbleScan software. Probe level files and mRNA level files were generated following the normalization. All gene level files were imported into the Agilent GeneSpring GX software (version 11.5.1) and normalized by the quantile method. Then, combat software was used to adjust the normalized intensity to remove batch effects. Significantly differentially expressed LncRNAs and mRNAs were identified by Volcano Plot filtering. Hierarchical clustering was performed using the Agilent GeneSpring GX software (version 11.5.1) [21].
Bioinformatics analysis
Go analysis
GO analysis is a functional analysis associating differentially expressed mRNAs with GO categories. The GO categories are derived from Gene Ontology (www.geneontology.org), which comprise three structured networks of defined terms that describe gene product attributes.
Pathway analysis
Pathway analysis for differentially expressed mRNAs was provided, based on the latest KEGG (Kyoto Encyclopedia of Genes and Genomes, http://www.genome.jp/kegg) database, which allowed us to determine the biological pathway with the significantly enriched mRNAs involved.
Validation of microarray data by quantitative real-time reverse transcription polymerase chain reaction (qRT-PCR)
qRT-PCR, the gold standard for data verification, was used to verify the differential expression of LncRNAs and mRNAs that were detected on the microarray. Total RNA was extracted with TRIzol (Invitrogen, Carlsbad, CA, USA), and 1 mg of total RNA was converted to cDNA with Primer Script RT Mix (Takara, Dalian, China). PCR was performed with the SYBR Green PCR kit (Takara) on an ABI PRISM 7500 fast Sequence Detection System (Applied Biosystems, Foster City, CA, USA). Reaction parameters were: 95°C for 20 s, then 40 cycles of 95°C for 10 s and 60°C for 45 s. Relative gene expression was calculated with the 2/(DDCT) method, using GAPDH as an internal control [22]. Primers used for amplifying specific genes in this study are shown in Table 1.
Table 1.
Primers used for qRT-PCR analysis of fifteen randomly selected lncRNAs
| LncRNA | Forward and Reverse primer | Product length (bp) |
|---|---|---|
| ENST00000563280 | F: 5’ TTCATCGGCTGCGTATTCG 3’ | 102 |
| R: 5’ TTGCCTTCTAGTCGCCTCC 3’ | ||
| uc021pbg.1 | F: 5’ CCTGTGGATAACCTCAACTGTG 3’ | 123 |
| R: 5’ AACTCGGCTCCTTGCTCTG 3’ | ||
| ENST00000568031 | F: 5’ TCTCATCTCCAATTCTGCTTCA 3’ | 132 |
| R: 5’ CATCCGAATCTCAGGCACATT 3’ | ||
| ENST00000545508 | F: 5’ GGCAGGACCTTCTGTTACTTG 3’ | 94 |
| R: 5’ CCGCTGAATAAATGGACTTGGT 3’ | ||
| uc010lgv.1 | F: 5’ GCGACTACCTCCCTTCTGAC 3’ | 82 |
| R: 5’ TCAAAGAGCCTGGACCAATCA 3’ | ||
| ENST00000553559 | F: 5’ CATGGCAATGCGATTCATT 3’ | 132 |
| R: 5’ ATTGTTAAGTGCACCAGATGC 3’ | ||
| uc003txt.3 | F: 5’ AGCCGCCATCACATCTAGG 3’ | 150 |
| R: 5’ CCAGTTCTTTACACTCCCAGAC 3’ | ||
| NR_036444 | F: 5’ CTCCGTCAGAGTCTCCAGAAG 3’ | 95 |
| R: 5’ GCCTCCAACAGCAGAAACATT 3’ | ||
| ENST00000440570 | F: 5’ CAGTGGGCTGTACTCCAGT 3’ | 102 |
| R: 5’ TCCTTAGGAGTTTTTTTTTTAAT 3’ | ||
| ENST00000476909 | F: 5’ GGAGTCATCAGCACTGGAAC 3’ | 109 |
| R: 5’ TTGATTGGCAGGGACTTCTTG 3’ | ||
| NR_040001 | F: 5’ GGTAATTGCCGCATAGTGTAAC 3’ | 107 |
| R: 5’ TGAGAGTGACAACAATGAATGG 3’ | ||
| ENST00000457390 | F: 5’ CCGTCCTGCAAGGATATTGT 3’ | 111 |
| R: 5’ CCAACCACATTTAGGCTCTACC 3’ | ||
| uc002sts.4 | F: 5’ AAGAACGGTGGTTGTCAGG 3’ | 110 |
| R: 5’ AAACATCACACCATCCATTTCC 3’ | ||
| ENST00000576810 | F: 5’ CCGAGAAAGGAAGGAAGAAAGC 3’ | 144 |
| R: 5’ TACGCCAGCACTGACAAGAA 3’ | ||
| ENST00000565617 | F: 5’ GGAGGTGAGGTACAGGCTAA 3’ | 125 |
| R: 5’ GGCTGATTAACTGGACTTGGA 3’ | ||
| GAPDH | F: 5’ GGGAAACTGTGGCGTGAT 3’ | 299 |
| R: 5’ GAGTGGGTGTCGCTGTTGA 3’ |
Statistical analysis
The expression levels of LncRNAs and mRNAs that were differentially expressed between human doxorubicin-resistant osteosarcoma MG63/DXR cells and the parental MG63 cells were compared by the paired, two-tailed t-test using the SPSS 20.0 software package (SPSS, Chicago, IL). Overall survival were calculated by Kaplan-Meier survival analysis and compared by the log rank test. All of the data are shown as the Means ± SD of three independent experiments. A value of P<0.05 was considered statistically significant.
Results
MTT assay
The doxorubicin-resistance of the MG63/DXR cell line was identified by comparing the IC50-value of MG63/DXR with that of the MG63 cell line. As shown in Figure 1, when exposed to doxorubicin for 48 h, the IC50 value of MG63/DXR cells was 10.2 µM, whereas that of MG63 cells was 0.4 µM. The resistance factor (R factor) of the MG63/DXR cell line, which was defined as the ratio of the MG63/DXR IC50 the MG63 IC50 at 48 h, was 23.2. According to a previously defined standard, R factor <5: low or no-resistance; R factor 5-15: moderate-resistance; R factor >20: high-resistance [23]. Obviously, the high-resistance MG63/DXR cells were more resistant to doxorubicin than MG63 cells, laying a solid foundation for further study.
Figure 1.
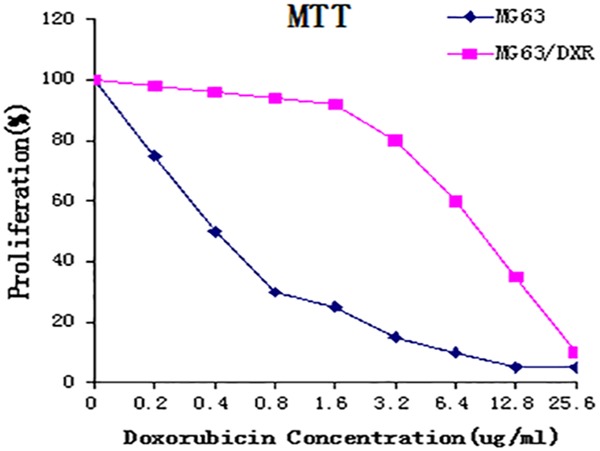
MTT assay. MTT assay was performed to confirm that MG63/DXR cells were more resistant to doxorubicin than MG63 cells. The IC50 value of MG63/DXR was 10.2 μM, and that of MG63 was 0.44 μM. The resistance factor (R factor) was 23.2, which was regarded as high resistance based on the standard where R factor <5: low or no resistance; R factor 5-15: moderate-resistance; R factor >20: high-resistance [23].
Differentially expressed lncRNAs and mRNAs
Expression levels of lncRNAs and mRNAs were statistically significantly altered between MG63/DXR and MG63 cells (P<0.05; fold-change >2). In total, 3,465 lncRNAs and 3,278 mRNAs were identified. Among these differentially expressed lncRNAs, MG63/DXR cells had a total of 1,761 that were up-regulated >2-fold, and 1,704 that were down-regulated >2-fold relative to the corresponding lncRNAs in MG63 cells (1761 vs. 1704). However, 1,607 mRNAs were found to be up-regulated more than 2-fold in the MG63/DXR cells compared to MG63 cells, while 1,671 were down-regulated more than 2-fold (P<0.05) (1671 vs. 1607). Obviously, the alteration of number of lncRNAs is more than mRNAs, whatever up and down-regulated, which may suggest the complex interactions between lncRNAs and mRNAs. We used hierarchical clustering analysis to arrange samples into groups based on their expression levels, which allowed us to hypothesize the relationships among samples. The resulting dendrogram shows the relationships between the lncRNA (Figure 2A and 2C) and mRNA (Figure 2B and 2D) expression patterns between samples. LncRNA ENST00000427085 (fold change: 352.9027266) was the most up-regulated lncRNA, and NR_038435 (fold change: 708.9148299) was the most down-regulated lncRNA. The ten most dramatically up- and down-regulated lncRNAs are shown in Table 2.
Figure 2.
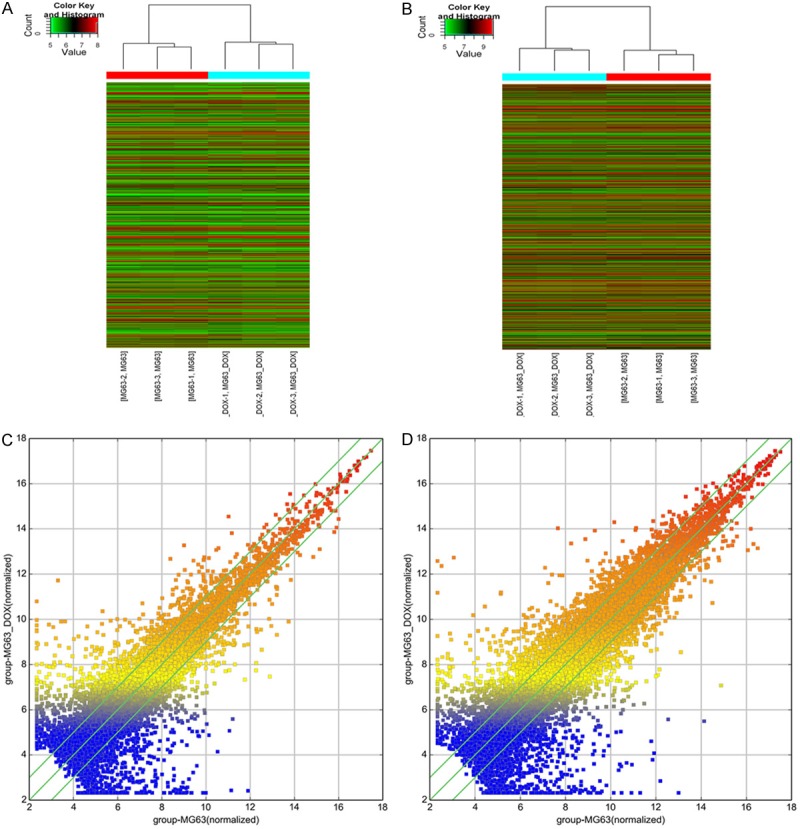
The profiles of differentially expressed lncRNAs and mRNAs in doxorubicin-resistant MG63/DXR cells were compared with their parental MG63 cells. (A) Differentially expressed lncRNAs and (B) differentially expressed mRNAs were analyzed using hierarchical clustering. “Red” indicates high relative expression, and “green” indicates low relative expression. The scatter plot is a visualization method used for assessing the variation of lncRNA (C) and mRNA (D) expression between doxorubicin-resistant MG63/DXR cells and MG63 cells. The values of the X and Y axes in the scatter plot are the averaged normalized signal values of the group (log2 scaled). The green lines represent fold-change (the default fold-change given is 2.0). It was revealed that up-regulated lncRNAs were more common than those that were down-regulated (1761 vs. 1704), while the opposite was true for mRNAs (1607 up-regulated vs. 1671 down-regulated).
Table 2.
The ten most significantly up- and down-regulated lncRNAs
| Seq. name | Regulation | FC (abs) | Relationship | Associated_gene_name | P-value |
|---|---|---|---|---|---|
| NR_073012 | up | 19.6229767 | exon sense-overlapping | PRSS21 | 1.5996E-07 |
| ENST00000563280 | up | 19.3556699 | natural antisense | FOXC2 | 3.034E-08 |
| NR_026880 | up | 12.0489033 | intron sense-overlapping | HS3ST3B1 | 8.7371E-07 |
| ENST00000525893 | up | 11.5981798 | intronic antisense | PTDSS2 | 1.08138E-06 |
| TCONS_00029064 | up | 9.3073664 | intergenic | 2.15934E-06 | |
| uc010lgv.1 | up | 6.3517348 | natural antisense | SPDYE3 | 1.1689E-07 |
| ENST00000553559 | up | 6.1205388 | natural antisense | GLRX5 | 3.2004E-07 |
| ENST00000555866 | up | 6.0395484 | bidirectional | GLRX5 | 2.6721E-07 |
| uc003txt.3 | up | 5.3902779 | intergenic | 2.6958E-07 | |
| TCONS_00023486 | up | 4.2867227 | intergenic | 0.000214235 | |
| NR_036444 | down | 22.765057 | intergenic | 1.69717E-06 | |
| uc003lrn.1 | down | 14.4639364 | exon sense-overlapping | PDGFRB | 5.83071E-06 |
| ENST00000440570 | down | 9.7694122 | intergenic | 6.78589E-05 | |
| ENST00000415000 | down | 8.060189 | intergenic | 2.48834E-06 | |
| ENST00000476909 | down | 7.8133063 | intergenic | 6.41608E-06 | |
| NR_040001 | down | 7.2909004 | intergenic | 3.666E-08 | |
| ENST00000457390 | down | 7.2230392 | intergenic | 1.11896E-06 | |
| ENST00000567054 | down | 7.0734007 | 4.80546E-06 | ||
| NR_073080 | down | 6.4986438 | exon sense-overlapping | PHLDA3 | 2.60636E-05 |
| uc002sts.4 | down | 6.4840532 | intergenic | 1.74E-09 |
Chromosomal distribution of overall differentially expressed lncRNAs and mRNAs
To further elucidate the underlying relation between lncRNAs and mRNAs, a distribution plot with respect to chromosomal location was established to determine the chromosomal patterns of the overall differentially expressed lncRNAs and mRNAs from microarray data (Figure 3). As was shown in Figure 3, the differentially regulated 3,465 lncRNAs and 3,278 mRNAs were distributed throughout the genome and could be found in every chromosome. Among them, chromosome 14 had the most up-regulated lncRNAs and mRNAs simultaneously (235 and 214, respectively), which may imply that lncRNAs and mRNAs transcribed from this chromosome could potentialy stimulate the expression with each other. However, chromosome Y contained the most down-regulated lncRNAs and the fewest up-regulated mRNAs (262 and 2, respectively), which suggest that the lncRNAs in this chromosome may negatively regulate the expression of mRNAs here. These results may suggest the importance of chromosome 14 and Y in the occurrence of doxorubicin-resistance in OS.
Figure 3.

Chromosomal distribution of up- and down-regulated lncRNAs (A, B) and mRNAs (C, D). The differentially expressed lncRNAs and mRNAs were widely distributed across all 22 autosomal and both the X and Y sex chromosomes. The highest number of up-regulated lncRNAs was on chromosome 14 (A), and the highest number of down-regulated lncRNAs was found on chromosome Y (B). The highest number of over-expressed mRNA was found in chromosome 14 (C), and the highest number of mRNAs with reduced expression was in chromosome 1 (D). The highest number of both up-regulated lncRNAs and mRNAs were found on chromosome 14, which may reveal the importance of its variation in the induction of OS chemoresistance.
LncRNA classification and subgroup analysis
According to the locations of lncRNAs relative to nearby protein-coding genes and their potential functions, the differently expressed lncRNAs were classified and sub-grouped into the following three categories: (1) Enhancer LncRNA profiling and Enhancer LncRNAs near coding gene (Table 3), (2) LncRNA profiling and LncRNAs near coding gene, (3) HOX cluster profiling (Table S1). Of these, LncRNAs with enhancer-like functions (LncRNA-a) were identified using GENCODE annotation of human genes. The selection of LncRNAs with enhancer-like function excluded transcripts mapping to both exons and introns of annotated protein coding genes, the natural antisense transcripts that overlap protein coding genes, and all known transcripts. Additionally, the coding genes near to the enhancer-like LncRNAs were less than 300 kb away from the LncRNAs and did indeed encode proteins. In addition, LncRNAs were identified according to the site in which they were located relative to two protein-coding genes. Furthermore, nearby coding genes were defined as above, similar to the Enhancer LncRNAs that were localized close to coding genes. The HOX cluster profiling included the LncRNAs in the four HOX loci, HOX A, HOX B, HOX C, and HOX D, which encode transcription factors that define cellular identities along both the major and secondary body axes. As shown in Table 3, the twenty most differentially expressed enhancer lncRNAs and their nearby genes were classified into four categories according to the expression trend of the lncRNA and mRNA: lncRNA up and mRNA up ; lncRNA up and mRNA down; lncRNA down and mRNA up; lncRNA down and mRNA down. This categorization suggested that pervasive regulatory mechanisms that involve lncRNA affecting the expression of mRNA might exist. From these categories a few important genes, such as the transcription factor genes TCEAL4 and HES4, as well as some classical genes involved in cell cycle regulation and metabolism, such as RSAD2, EDN1, were differentially expressed with the relevant lncRNA. These lncRNAs could either induce or inhibit the expression of these genes to regulate cellular activities. As shown in Table 3, expression of lncRNAs and their nearby genes followed similar trends in some cases, but opposite trends in others. MEG3, which has been shown to play a role as tumor suppressor in various cancers, such as gastric cancer [24], NSCLC [25], cervical carcinoma [26] and others, was associated with twenty differentially expressed lncRNAs.
Table 3.
The twenty most significantly differentially expressed Enhancer lncRNAs and their nearby genes
| Seq. name | Gene Symbol | Fold change - LncRNAs | Regulation-LncRNAs | Genome Relationship | Nearby Gene |
|---|---|---|---|---|---|
| ENST00000424887 | TCEAL3-AS1 | 22.8374194 | up | downstream | NM-001006935 |
| ENST00000425711 | AC097517.2 | 16.253311 | down | upstream | NM-080657 |
| ENST00000458028 | RP3-523C21.1 | 14.0142442 | down | upstream | ENST00000360971 |
| ENST00000457945 | RP11-125M16.1 | 11.5072572 | down | downstream | NM-001955 |
| ENST00000457253 | XXbac-BPG308K3.5 | 11.1698502 | up | upstream | NM-001010877 |
| NR-038981 | LOC100507254 | 11.1053083 | down | upstream | ENST00000360971 |
| NR-033917 | LOC728228 | 10.8412202 | up | upstream | ENST00000278795 |
| ENST00000456651 | RP3-522D1.1 | 9.5123946 | down | downstream | NM-001166496 |
| ENST00000431761 | KIAA0664L3 | 8.9037958 | down | downstream | NM-003414 |
| ENST00000419627 | RP3-323P13.2 | 8.6173344 | down | upstream | NM-145176 |
| NR-026821 | FAM138B | 8.5000113 | down | upstream | NM-012184 |
| ENST00000326734 | FAM87B | 7.7104153 | up | downstream | NM-021170 |
| ENST00000420597 | RP11-14N7.2 | 7.6400478 | down | upstream | NM-001164261 |
| ENST00000457390 | RP11-14N7.2 | 7.2230392 | down | upstream | NM-001164261 |
| NR-024475 | LOC100216001 | 7.0389266 | up | upstream | NM-001040177 |
| ENST00000450467 | AC097517.2 | 6.4548525 | down | upstream | NM-080657 |
| ENST00000419578 | RP1-13P20.6 | 6.3076938 | up | downstream | ENST00000368768 |
| uc001ihe.4 | LOC100216001 | 6.2438775 | up | upstream | NM-001040177 |
| ENST00000443364 | RP11-48O20.4 | 6.190759 | down | downstream | ENST00000368090 |
| ENST00000575689 | LINC00327 | 5.7935591 | down | upstream | ENST00000382298 |
GO analysis and pathway analysis
A GO enrichment analysis of differentially expressed mRNAs was performed to identify GOs with higher confidence. Fisher’s exact test was used to determine whether the overlap between genes on the differentially expressed list and the GO annotation list was greater than that expected by chance (p-value <0.05 is recommended as the cut-off). Through GO analysis we found that these dysregulated transcripts of lncRNAs were associated with heart development and extracellular matrix organization (ontology: biological process), intracellular molecules and cytoplasm (ontology: cellular component), catalytic activity and oxidoreductase activity (ontology: molecular function) (Figure 4). The genes corresponding to the up-regulated and down-regulated mRNAs respectively included 152 and 126 genes involved in biological processes, 80 and 72 genes involved in cellular components, 69 and 56 genes involved in molecular functions.
Figure 4.

GO analysis of the down-regulated (A) and up-regulated (B) mRNAs from our dataset. The Gene Ontology project provides a controlled vocabulary to describe gene and gene product attributes in any organism (http://www.geneontology.org). The ontology covers three domains: Biological Process, Cellular Component and Molecular Function. Fisher’s exact test is used to determine whether there is more overlap between the DE list and the GO annotation list than would be expected by chance. The p-value denotes the significance of GO terms enrichment in the DE genes. The lower the p-value, the more significant the GO term (p-value ≤0.05 is recommended). The (A) shows the result of GO analysis of down-regulated mRNAs from our dataset. The result of GO analysis of up-regulated mRNAs is in (B).
Significant pathways of differential genes were compared with the KEGG database to further specify and identify target mRNAs among the 3,278 identified genes. Through the pathway analysis, we identified that 31 pathways were significantly enriched among the up-regulated transcripts (Table S2) and 25 pathways (Table S3) were significantly enriched among the under-regulated transcripts. Among them, ‘Glutathione metabolism-Homo sapiens (human)’ and ‘Transcriptional misregulation in cancer-Homo sapiens (human)’ were the most enriched networks respectively. Some of these pathways, such as the classical gene category ‘NF-κB’ and ‘MAPK’, have been reported to be involved in the induction of chemoresistance in osteosarcoma [27-30] (Figure 5).
Figure 5.

Pathway analysis of the differentially expressed profiles. Pathway analysis is a functional analysis in which genes are mapped to KEGG pathways. The p-value (EASE-score, Fisher-P value or Hypergeometric-P value) denotes the significance of the pathway correlated to the conditions, where the lower the p-value, the more significant the pathway. (The recommend p-value cut-off is 0.05.) The ‘NF-κB’ (A) and “MAPK” (B) signaling pathways show modulation in tumor signatures and are associated with chemoresistance of osteosarcoma. The genes labeled “yellow” that were differentially expressed between MG63/DXR and MG63 cells were involved in the “NF-κB” and “MAPK” signaling pathways.
Real-time quantitative PCR validation
Based on the features of the differentially expressed lncRNAs, such as fold change, gene locus, and nearby encoding gene, we initially identified a number of interesting candidate lncRNAs for further analysis. Seven up-regulated lncRNAs (ENST00000563280, uc021pbg.1, ENST00000568031, ENST00000545508, uc010 lgv.1, ENST00000553559 and uc003txt.3), and eight down-regulated lncRNAs (NR_036444, ENST00000440570, ENST00000476909, NR_040001, ENST00000457390, uc002sts.4, ENST00000576810 and ENST00000-565617) (Table 4) were randomly chosen. To further validate these differentially expressed lncRNAs, we performed quantitative real-time PCR assays, which is the gold standard for data verification. These selected lncRNAs were from various categories, such as natural antisense, intergenic and intronic antisense. As is illustrated in Figure 6 and Table 5, these data supported a strong consistency between the qRT-PCR result and microarray data. The results showed that lncRNA ENST00000563280, uc021pbg.1, ENST00000568031, ENST00000545508, uc010lgv.1, ENST00000553559 and uc003txt.3 were up-regulated and that NR-036444, ENST00000440570, ENST00000476909, NR_040001, ENST00000457390, uc002sts.4, ENST00000576810 and ENST00000565617 were down-regulated in the doxorubicin-resistant MG63/DXR cells compared with their parental MG63 cell controls.
Table 4.
Fifteen lncRNAs randomly selected for validation by qRT-PCR
| LncRNA | Regulation | FC (abs) | RNA length | Relationship | Associated_gene_name | P-value |
|---|---|---|---|---|---|---|
| ENST00000563280 | up | 19.3556699 | 319 | natural antisense | FOXC2 | 3.034E-08 |
| uc021pbg.1 | up | 9.0230322 | 1971 | natural antisense | BCAN | 1.16379E-05 |
| ENST00000568031 | up | 8.2885674 | 1313 | intergenic | 6.60888E-06 | |
| ENST00000545508 | up | 8.1706136 | 402 | intergenic | 1.93109E-05 | |
| uc010lgv.1 | up | 6.3517348 | 1245 | natural antisense | SPDYE3 | 1.1689E-07 |
| ENST00000553559 | up | 6.1205388 | 428 | natural antisense | GLRX5 | 3.2004E-07 |
| uc003txt.3 | up | 5.3902779 | 549 | intergenic | 2.6958E-07 | |
| NR_036444 | down | 22.765057 | 2693 | intergenic | 1.74E-09 | |
| ENST00000440570 | down | 9.7694122 | 760 | intergenic | 1.69717E-06 | |
| ENST00000476909 | down | 7.8133063 | 792 | intergenic | 6.78589E-05 | |
| NR_040001 | down | 7.2909004 | 1058 | intergenic | 6.41608E-06 | |
| ENST00000457390 | down | 7.2230392 | 425 | intergenic | 3.666E-08 | |
| uc002sts.4 | down | 6.4840532 | 1169 | intergenic | 1.11896E-06 | |
| ENST00000576810 | down | 5.6083524 | 1394 | intergenic | 1.6125E-07 | |
| ENST00000565617 | down | 5.1850084 | 2825 | intergenic | 6.79638E-05 |
Figure 6.
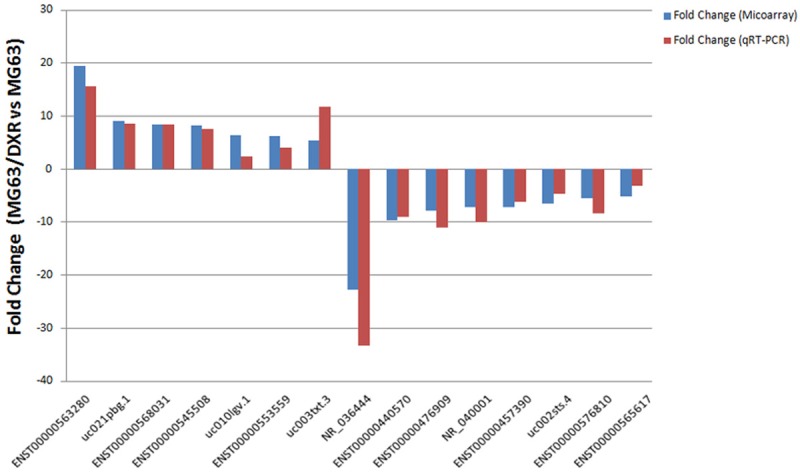
The differential expression of lncRNAs was validated by quantitative real-time PCR. Comparison between microarray and quantitative real-time PCR results. Fifteen differentially expressed lncRNAs (seven up-regulated and eight down-regulated) were validated by qRT-PCR and the results were shown in the histogram. The heights of the columns in the chart represent the median fold-changes (MG63/DXR vs. MG63) in expression across three pairs of samples (P≤0.05). The qPCR results were consistent with the microarray data.
Table 5.
The differential expression of lncRNAs validated by qRT-PCR
| Seq. name | Regulation | Fold Change (Microarray) | Fold Change (qRT-PCR) | P-value |
|---|---|---|---|---|
| ENST00000563280 | up | 19.3556699 | 15.59 | 0.000006 |
| uc021pbg.1 | up | 9.0230322 | 8.5 | 0.004182 |
| ENST00000568031 | up | 8.2885674 | 8.37 | 0.000166 |
| ENST00000545508 | up | 8.1706136 | 7.53 | 0.001984 |
| uc010 lgv.1 | up | 6.3517348 | 2.34 | 0.003205 |
| ENST00000553559 | up | 6.1205388 | 3.96 | 0.000243 |
| uc003txt.3 | up | 5.3902779 | 11.68 | 0.000004 |
| NR-036444 | down | 22.765057 | 33.33 | 0.000004 |
| ENST00000440570 | down | 9.7694122 | 9.09 | 0.00012 |
| ENST00000476909 | down | 7.8133063 | 11.11 | 0.000028 |
| NR-040001 | down | 7.2909004 | 10 | 0.000156 |
| ENST00000457390 | down | 7.2230392 | 6.25 | 0.010177 |
| uc002sts.4 | down | 6.4840532 | 4.76 | 0.000007 |
| ENST00000576810 | down | 5.6083524 | 8.33 | 0.000628 |
| ENST00000565617 | down | 5.1850084 | 3.13 | 0.004141 |
Establishment of the lncRNA-mRNA co-expression network
We constructed a coding-noncoding gene co-expression network that included the 15 differentially expressed lncRNAs validated by qRT-PCR and their putative target coding genes. The lncRNAs and coding genes with Pearson correlation coefficients equal to or greater than 0.999 were chosen for network, which was drawn using Cytoscape (Institute of Systems Biology in Seattle). The result revealed that the co-expression network was between 15 lncRNAs and 593 coding genes. Within this co-expression network, 999 pairs presented as positive and 1053 pairs presented as negative. This co-expression network indicated that one lncRNA could target a maximum of 201 coding genes, and that one coding gene could be related to a maximum of 9 lncRNAs (Figure 7). At the same time, we found that lncRNA EST00000563280 and NR-036444 were strongly correlated with previously reported multidrug-resistance associated genes such as ACBC1and HIF1A, which were also differentially expressed in our data (Table 6). These results may provide us some valuable clues to further clarify the mechanism of how lncRNA EST00000563280 and NR-036444 regulate the sensitivity of MG63 cells to doxorubicin from the perspective of interactions with these classical multidrug-resistance genes.
Figure 7.
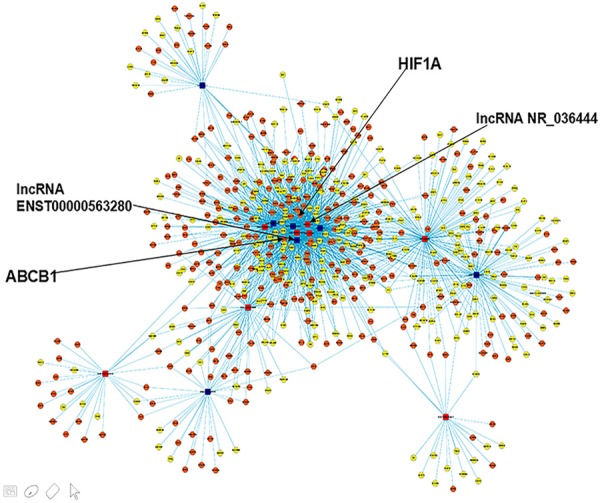
Predicted lncRNA-mRNA association network. The co-expression network was established between the 15 qRT-PCR-verified lncRNAs and 593 coding genes that had Pearson correlation coefficients equal to or greater than 0.999. Within this co-expression network, 999 pairs presented as positive, and 1053 pairs presented as negative. This co-expression network indicated that one lncRNA could target a maximum of 201 coding genes and that one coding gene could correlate with a maximum of 9 lncRNAs. The seven blue boxes represent up-regulated lncRNAs, while the eight red boxes indicate down-regulated lncRNAs. The orange nodes denote over-expressed genes and the yellow ones represent those with reduced expression.
Table 6.
Differentially expressed multidrug-resistance associated genes
| Seq. name | FC (abs) | Regulation | Gene Symbol | Product | P-value |
|---|---|---|---|---|---|
| NM-000927 | 459.720896 | up | ABCB1 | multidrug resistance protein 1 | 3.35E-07 |
| NM-181054 | 20.4640428 | up | HIF1A | hypoxia-inducible factor 1-alpha isoform 2 | 3.01E-06 |
Potential clinical significance of lncRNA in osteosarcoma
To explore the potential clinical significance of lncRNA, we then examined the expression level of lncRNA ENST00000563280, which was named osteosarcoma multidrug-resistance related up-regulated lncRNA, namely lncRNA OMRUL, in the 60 primary osteosarcoma tissues samples, which were divided into two groups: chemosensitivity and chemoresistance group, thirty persons per group. The baseline between the two groups is comparable (Table 7). We used the median expression level of lncRNA OMRUL as a cut-off to divide the 60 patients into lncRNA OMRUL -high (n=38, with an average ΔCt expression value of 80.25) and low groups (n=22, with an average ΔCt expression value of 19.75). As is shown in the Figure 8A, our data showed that the expression of lncRNA ENST00000563280 (lncRNA OMRUL), the most up-regulated lncRNA of the seven selected lncRNAs verified by qRT-PCR, in chemoresistance group was about four fold than that of chemosensitivity group. And in the Figure 8B, the patients in lower expression of lncRNA ENST00000563280 (lncRNA OMRUL) may survive longer than those of higher expression (28.2±1.4 months vs. 48.6±1.2 months), which suggest that lncRNA ENST00000563280 (lncRNA OMRUL) may serve as a biomarker to predict the chemoresponse and prognosis of osteosarcoma patients. But it is still needed to be examined and validated in more clinical samples of osteosarcoma.
Table 7.
The baseline between chemosensitive and chemoresistant group of osteosarcoma patients
| chemosensitive group | chemoresistant group | ||
|---|---|---|---|
| Number | 30 | 30 | |
| Gender | P=0.08 | ||
| Male | 22 | 24 | |
| Female | 8 | 6 | |
| Age (y) | 18.6±0.4 (6-40) | 19.2±0.8 (8-36) | P=0.1 |
| Location | P=0.07 | ||
| Proximal of Humerus | 8 | 6 | |
| Distal of Femur | 12 | 14 | |
| Proximal of Tibia | 8 | 9 | |
| Other | 2 | 1 | |
| Follow-up time (m) | 25.0±1.2 (6-96) | 22.4±1.4 (3-80) | P=0.55 |
Figure 8.
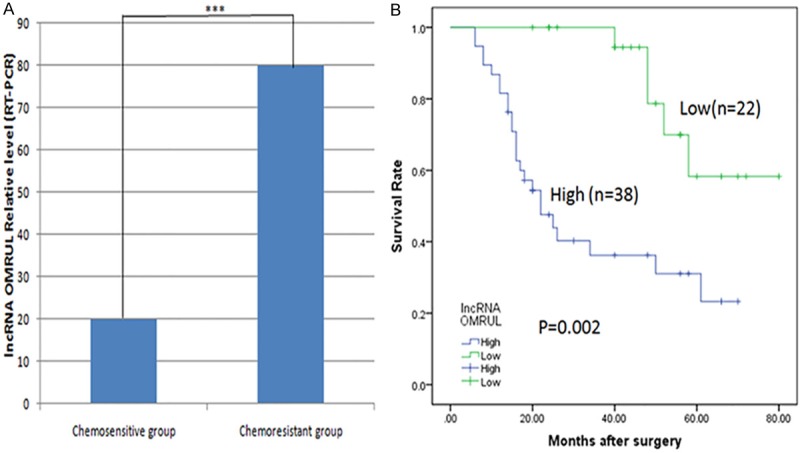
LncRNA expression in osteosarcoma (OS) tissue and potential clinical significance. A. The expression of lncRNA ENST00000563280 (OMRUL) in specimens of OS patients that had a poor chemoresponse was about four fold than those with a good chemoresponse (20.2±0.3 vs. 80.4±0.6). The data are presented as the mean ± SD. GR stands for good chemoresponse group and PR means poor chemoresponse. B. The average survival lifetime of the patients in lower expression of lncRNA OMRUL was 48.6±1.2 months and the higher patients was 28.2±1.4 months, which may suggest the potential significance of this lncRNA.
Discussion
Osteosarcoma is the most common primary malignant bone tumor in children and adolescents, making up approximately 15% of all bone tumors. Chemotherapy has been a very important adjuvant therapy in the treatment of osteosarcoma. Doxorubicin and cisplatin in combination with methotrexate is the most commonly used chemotherapy regimens. However, the appearance of chemoresistance impedes its clinical usage [31]. Over the past decades, the molecular mechanism of chemoresistance in osteosarcoma has been extensively investigated. Nevertheless, the exact biological mechanism of this process remains still unclear, therefore, further study of chemoresistance in OS is of great importance. LncRNAs have been reported to play an vital role in many biological processes [32], including X-chromosome inactivation, gene imprinting [33], carcinogenesis and tumor metastasis [34]. Different types of lncRNAs with a variety of biological functions make it possible to regulate the biological behavior of malignant tumors, which provides an important opportunity to reveal the nature of chemoresistance of malignant tumors. Studying the changes in lncRNA expression between multi-drug resistant cells and their drug-sensitive counterparts, as well as studying differentially expressed lncRNAs and corresponding epigenetic modifications during induction of chemoresistance, may provide a new perspective and, potentially, new therapies to overcome the multi-drug resistance of malignant tumors.
In fact, some lncRNAs have been reported to be involved in drug resistance of various types of cancers. In particular, the relationship between lncRNA and chemoresistance in non-small cell lung cancer [21], bladder cancer [35], stomach cancer [36], and soft tissue sarcoma [37] has been partly elucidated. Fan [35] showed that over-expression of lncRNA UCA1 significantly increased the viability of cisplatin-resistant bladder cancer cells during cisplatin treatment, whereas UCA1 knockdown reduced cell viability during cisplatin treatment. And lncRNA UCA1 may regulate the chemoresistance of bladder cancer through activating Wnt signaling. Jiang [38] showed that the expression of lncRNA ARA (Adriamycin Resistance Associated) was significantly associated with adriamycin sensitivity in a panel of breast and liver cancer cell lines, and was markedly up-regulated in parental drug-sensitive MCF-7 and HepG2 cell lines after receiving adriamycin (namely, doxorubicin) treatment. Furthermore, ARA was shown to be capable of modulating multiple signaling pathways, including the MAPK signaling pathway, metabolic pathways, and cell cycle and cell adhesion-related biological pathways. ARA could also regulate cellular processes, including transcriptional processes and protein binding, which plays various important biological functions. In addition, Wang [39] found a set of lncRNAs related to multi-drug resistance in gastric cancer, including lncRNA DMTF1v4 (cyclin D binding myb-like transcription factor 1 (DMTF1), transcript variant 4), which was expressed at significantly higher levels in the doxorubicin- and vincristine-resistant gastric cancer cell line SGC7901. After knocking down DMTF1v4 through corresponding siRNAs, the level of P-g protein in SGC7901 cells markedly decreased, while the percentage of apoptotic cells significantly increased.
To our knowledge, this is the first study to examine the regulatory effects of lncRNAs in chemoresistance of OS. In the present study, to explore the mechanism underlying doxorubicin-resistance in the human osteosarcoma cell line MG63/DXR in terms of lncRNA, the lncRNA expression profiles of these cells were investigated using microarray analysis. Indeed, the lncRNA expression levels differed compared to the MG63 parental cell line. We analyzed three pairs of human primary MG63/DXR osteosarcoma drug-resistant cell line and their MG63 parental drug-sensitive cells and identified that 3,465 lncRNAs were differently expressed in total, which included 1,761 up-regulated and 1,704 down-regulated lncRNAs (Fold change >2.0) in drug-resistant MG63/DXR cells relative to MG63 cells. Additionally, the dysregulated lncRNAs were distributed across all 22 autosomes and the X and Y sex chromosomes, which may suggest their extensive role in regulation of various biological activities. Fifteen lncRNAs (seven up and eight down-regulated) of three types (intergenic, intronic antisense and natural antisense) were evaluated by quantitative real-time PCR to validate the consistency of our results. Furthermore, we utilized Gene Ontology (GO) analysis and pathway analysis and constructed an lncRNA-mRNA co-expression network to preliminarily study the biological functions of these lncRNAs in the development of OS chemoresistance. In addition, we examined the expression of lncRNA ENST00000563280 in 30 pairs of osteosarcoma patient samples to explore its potential clinical significance.
Through the GO and pathway analyses, we have identified the biological functions enriched among the differentially expressed mRNAs. GO analysis revealed that the number of genes corresponding to up-regulated mRNAs was larger than that corresponding to down-regulated mRNAs (152 vs. 126). We found that these genes were mainly involved in cell components and basic metabolic processes, which may suggest that the differently expressed lncRNAs could regulate the chemoresponse of osteosarcoma cell line via influencing the expression of these genes. Pathway analysis showed that there were 31 pathways corresponded to all up-regulated transcripts (including Transcriptional disregulation in cancer, NF-kappa B signaling pathway, TNF signaling pathway and MAPK signaling pathway) and 25 pathways corresponded to all down-regulated transcripts (including Glutathione metabolism, PI3K-Akt signaling pathway, ECM-receptor interaction and Drug metabolism-cytochrome P450 pathway). Of them, the classical signal pathway, ‘NF-κb、MAPK’ were well known to diversely involve in the cell proliferation and apoptosis. Meanwhile, the ‘Glutathione metabolism’ and ‘Drug metabolism-cytochrome P450’ pathways have been previously reported to be associated with the occurrence of drug-resistance [40,41]. These may suggest that the different expressed lncRNAs may regulate the chemoresistance of osteosarcoma through these classical pathways.
Furthermore, according to the microarray and qRT-PCR results, we found that lncRNA ENST00000563280, the most highly over-expressed of the seven validated up-regulated lncRNAs (fold change: 19.3556699), and lncRNA NR_036444, the most dramatically decreased of the eight validated down-regulated lncRNAs (fold change: 22.765057), were most likely involved in the induction of doxorubincin-resistance of MG63 cells. At the same time, with the help of our established lncRNA-mRNA co-expression network, we found that lncRNA EST00000563280 and NR-036444 had a strong correlation (correlation coefficient of ≥0.97) with classical multidrug-resistance (MDR) associated genes, including ABCB1 [42] and HIF1A [43] (Table 8). Specifically, ABCB1 (ATP-binding cassette, subfamily B, member 1), is a well-known multidrug-resistance associated gene, which is one of seven distinct subfamilies of ABC (ATP-binding cassette) genes (ABC1, MDR/TAP, MRP, ALD, OABP, GCN20, and White). The protein encoded by ABCB1, P-gp, is an ATP-dependent drug efflux pump for xenobiotic compounds with broad substrate specificity, which is responsible for decreased drug accumulation in multidrug-resistant cells and often mediates the development of resistance to anticancer drugs [44]. Here, based on the correlation coefficient of lncRNA EST00000563280 and NR-036444 with ABCB1 and its expression levels, our results suggest that lncRNA EST00000563280 and NR-036444 may stimulate the expression of ABCB1 to transport the chemotherapeutics out of the cell, leading to chemoresistance. These data may provide valuable clues to further clarify the mechanism by which lncRNA EST00000563280 and NR-036444 regulate the sensitivity of MG63 cells to doxorubicin from the perspective of interactions between the lncRNAs and multidrug-resistance genes. As reported by Wang [39], lncRNA MRUL (MDR-related and upregulated lncRNA), located 400 kb downstream of ABCB1, was significantly upregulated in two multidrug-resistant GC cell sub-lines, SGC7901/ADR and SGC7901/VCR. Moreover, MRUL depletion reduced ABCB1 mRNA levels in a dose- and time-dependent manner, and heterologous luciferase reporter assays demonstrated that MRUL might positively affect ABCB1 expression in an orientation- and position-independent manner. These results indicated that MRUL promotes ABCB1 expression and is a potential target to reverse the MDR phenotype of GC MDR cell sub-lines. In addition, lncRNA ENST00000563280 was found to be located near FOXC2 (forkhead box protein C2), which has been demonstrated to regulate cell proliferation [45], tumor angiogenesis [46] and epithelial-to-mesenchymal transition (EMT) [47] through the MAPK and AKT signaling pathways [45]. Considering the natural antisense relationship between the simultaneously increased expression of the lncRNA ENST00000563280 and FOXC2, lncRNA ENST00000563280 may have the capacity to regulate the expression of FOXC2 at the transcriptional level to influence tumor angiogenesis and EMT. In turn, this could potentially mediate the metastasis of osteosarcoma. These results provided valuable clues for future studies. Besides, through detecting the expression of lncRNA ENST00000563280 in 60 primary osteosarcoma tissues resected from osteosarcoma patients, which has been divided into chemosensitivity group and chemoresistance group according to the histologic response previously described, obviously, the expression of lncRNA ENST00000563280 (lncRNA OMRUL) was significantly increased in specimens from OS patients that showed a poor chemoresponse compared to those that responded well to chemotherapy and the patients in lower expression of lncRNA ENST00000563280 (lncRNA OMRUL) may survive longer than those of higher expression. This may suggest that there may exist some lncRNA that could serve as a biomarker to predict the chemoresponse of osteosarcoma patients and lncRNA ENST00000563280 (lncRNA OMRUL) may be one of candidates, which needed to be confirmed in more osteosarcoma tissue samples.
Table 8.
Correlation coefficient of lncRNA with ABCB1, HIF1A and FOXC2
| Seq. name | Regulation | Drug-resistance associated Genes | ||
|---|---|---|---|---|
|
|
||||
| ABCB1 | HIF1A | FOXC2 | ||
| ENST00000563280 | up | 0.99975272272684 | 0.993251636529686 | 0.995570555864922 |
| NR-036444 | down | -0.997096376592904 | -0.996650901220175 | -0.998320477001276 |
To summarize, our present study shows, for the first time, that a set of lncRNAs with differential expression in the human doxorubicin-resistant osteosarcoma cell line MG63/DXR relative to its parental cell line MG63. Furthermore, our study revealed that lncRNA ENST00000563280 and NR-036444 may regulate the sensitivity of MG63/DXR cells sensitivity to chemotherapeutics by altering the expression of genes involved in the ‘MAPK’ and ‘NF-κB’ signaling pathways, as well as a few classical multidrug resistance (MDR) associated genes, such as ACBC1 and HIF1A. In addition, lncRNA ENST00000563280 may influence tumor angiogenesis and EMT by interacting with FOXC2 to potentially mediate the metastasis of osteosarcoma. And lncRNA ENST00000563280 (lncRNA OMRUL) may serve as a potential biomarker to predict the chemoresponse and prognosis of osteosarcoma patients. Our results revealed a penetrating layer of lncRNA of biological significance in pathologies of chemoresistance in OS, thereby pointing intriguing directions for further research. A deeper understanding of lncRNAs and their role in the formation of osteosarcoma chemoresistance possesses potential for discovering possible therapeutic targets and for identifying feasible biomarkers.
Acknowledgements
This project was supported by a Grant from The National Natural Science Foundation of China (NSFC No. 81572630).
Disclosure of conflict of interest
None.
Supporting Information
References
- 1.Picci P. Osteosarcoma (osteogenic sarcoma) Orphanet J Rare Dis. 2007;2:6–10. doi: 10.1186/1750-1172-2-6. [DOI] [PMC free article] [PubMed] [Google Scholar]
- 2.Longhi A, Errani C, De Paolis M, Mercuri M, Bacci G. Primary bone osteosarcoma in the pediatric age: state of the art. Cancer Treat Rev. 2006;32:423–436. doi: 10.1016/j.ctrv.2006.05.005. [DOI] [PubMed] [Google Scholar]
- 3.Lee JA, Kim MS, Kim DH, Lim JS, Yoo JY, Koh JS, Lee SY, Jeon DG, Park KD. Relative tumor burden predicts metastasis-free survival in pediatric osteosarcoma. Pediatr Blood Cancer. 2008;50:195–200. doi: 10.1002/pbc.21446. [DOI] [PubMed] [Google Scholar]
- 4.He H, Ni J, Huang J. Molecular mechanisms of chemoresistance in osteosarcoma (Review) Oncol Lett. 2014;7:1352–1362. doi: 10.3892/ol.2014.1935. [DOI] [PMC free article] [PubMed] [Google Scholar]
- 5.Broxterman HJ, Gotink KJ, Verheul HM. Understanding the causes of multidrug resistance in cancer: a comparison of doxorubicin and sunitinib. Drug Resist Updat. 2009;12:114–126. doi: 10.1016/j.drup.2009.07.001. [DOI] [PubMed] [Google Scholar]
- 6.Cao B, Li M, Zha W, Zhao Q, Gu R, Liu L, Shi J, Zhou J, Zhou F, Wu X, Wu Z, Wang G, Aa J. Metabolomic approach to evaluating adriamycin pharmacodynamics and resistance in breast cancer cells. Metabolomics. 2013;9:960–973. doi: 10.1007/s11306-013-0517-x. [DOI] [PMC free article] [PubMed] [Google Scholar]
- 7.Bertino JR. Karnofsky memorial lecture. Ode to methotrexate. J. Clin. Oncol. 1993;11:5–14. doi: 10.1200/JCO.1993.11.1.5. [DOI] [PubMed] [Google Scholar]
- 8.Townsend DM, Tew KD. The role of glutathione-S-transferase in anti-cancer drug resistance. Oncogene. 2003;22:7369–7375. doi: 10.1038/sj.onc.1206940. [DOI] [PMC free article] [PubMed] [Google Scholar]
- 9.Wang D, Luo M, Kelley MR. Human apurinic endonuclease 1 (APE1) expression and prognostic significance in osteosarcoma: enhanced sensitivity of osteosarcoma to DNA damaging agents using silencing RNA APE1 expression inhibition. Mol Cancer Ther. 2004;3:679–686. [PubMed] [Google Scholar]
- 10.Meric-Bernstam F, Gonzalez-Angulo AM. Targeting the mTOR signaling network for cancer therapy. J. Clin. Oncol. 2009;27:2278–2287. doi: 10.1200/JCO.2008.20.0766. [DOI] [PMC free article] [PubMed] [Google Scholar]
- 11.Asada N, Tsuchiya H, Tomita K. De novo deletions of p53 gene and wild-type p53 correlate with acquired cisplatin-resistance in human osteosarcoma OST cell line. Anticancer Res. 1999;19:5131–5137. [PubMed] [Google Scholar]
- 12.Chao DT, Korsmeyer SJ. BCL-2 family: regulators of cell death. Annu Rev Immunol. 1998;16:395–419. doi: 10.1146/annurev.immunol.16.1.395. [DOI] [PubMed] [Google Scholar]
- 13.Gougelet A, Pissaloux D, Besse A, Perez J, Duc A, Dutour A, Blay JY, Alberti L. Micro-RNA profiles in osteosarcoma as a predictive tool for ifosfamide response. Int J Cancer. 2011;129:680–690. doi: 10.1002/ijc.25715. [DOI] [PubMed] [Google Scholar]
- 14.Song B, Wang Y, Xi Y, Kudo K, Bruheim S, Botchkina GI, Gavin E, Wan Y, Formentini A, Kornmann M, Fodstad O, Ju J. Mechanism of chemoresistance mediated by miR-140 in human osteosarcoma and colon cancer cells. Oncogene. 2009;28:4065–4074. doi: 10.1038/onc.2009.274. [DOI] [PMC free article] [PubMed] [Google Scholar]
- 15.Fujii H, Honoki K, Tsujiuchi T, Kido A, Yoshitani K, Takakura Y. Sphere-forming stem-like cell populations with drug resistance in human sarcoma cell lines. Int J Oncol. 2009;34:1381–1386. [PubMed] [Google Scholar]
- 16.Martins-Neves SR, Lopes AO, do Carmo A, Paiva AA, Simoes PC, Abrunhosa AJ, Gomes CM. Therapeutic implications of an enriched cancer stem-like cell population in a human osteosarcoma cell line. BMC Cancer. 2012;12:139–152. doi: 10.1186/1471-2407-12-139. [DOI] [PMC free article] [PubMed] [Google Scholar]
- 17.Bertone P, Stolc V, Royce TE, Rozowsky JS, Urban AE, Zhu X, Rinn JL, Tongprasit W, Samanta M, Weissman S, Gerstein M, Snyder M. Global identification of human transcribed sequences with genome tiling arrays. Science. 2004;306:2242–2246. doi: 10.1126/science.1103388. [DOI] [PubMed] [Google Scholar]
- 18.Chen LL, Carmichael GG. Long noncoding RNAs in mammalian cells: what, where, and why? Wiley Interdiscip Rev RNA. 2010;1:2–21. doi: 10.1002/wrna.5. [DOI] [PubMed] [Google Scholar]
- 19.Oda Y, Matsumoto Y, Harimaya K, Iwamoto Y, Tsuneyoshi M. Establishment of new multidrug-resistant human osteosarcoma cell lines. Oncol Rep. 2000;7:859–866. doi: 10.3892/or.7.4.859. [DOI] [PubMed] [Google Scholar]
- 20.Xu M, Jin H, Xu CX, Sun B, Mao Z, Bi WZ, Wang Y. miR-382 inhibits tumor growth and enhance chemosensitivity in osteosarcoma. Oncotarget. 2014;5:9472–9483. doi: 10.18632/oncotarget.2418. [DOI] [PMC free article] [PubMed] [Google Scholar]
- 21.Yang Y, Li H, Hou S, Hu B, Liu J, Wang J. The noncoding RNA expression profile and the effect of lncRNA AK126698 on cisplatin resistance in non-small-cell lung cancer cell. PLoS One. 2013;8:e65309. doi: 10.1371/journal.pone.0065309. [DOI] [PMC free article] [PubMed] [Google Scholar]
- 22.Pfaffl MW. A new mathematical model for relative quantification in real-time RT-PCR. Nucleic Acids Res. 2001;29:e45. doi: 10.1093/nar/29.9.e45. [DOI] [PMC free article] [PubMed] [Google Scholar]
- 23.Snow K, Judd W. Characterisation of adriamycin- and amsacrine-resistant human leukaemic T cell lines. Br J Cancer. 1991;63:17–28. doi: 10.1038/bjc.1991.7. [DOI] [PMC free article] [PubMed] [Google Scholar]
- 24.Sun M, Xia R, Jin F, Xu T, Liu Z, De W, Liu X. Downregulated long noncoding RNA MEG3 is associated with poor prognosis and promotes cell proliferation in gastric cancer. Tumour Biol. 2014;35:1065–1073. doi: 10.1007/s13277-013-1142-z. [DOI] [PubMed] [Google Scholar]
- 25.Lu KH, Li W, Liu XH, Sun M, Zhang ML, Wu WQ, Xie WP, Hou YY. Long non-coding RNA MEG3 inhibits NSCLC cells proliferation and induces apoptosis by affecting p53 expression. BMC Cancer. 2013;13:461–466. doi: 10.1186/1471-2407-13-461. [DOI] [PMC free article] [PubMed] [Google Scholar]
- 26.Qin R, Chen Z, Ding Y, Hao J, Hu J, Guo F. Long non-coding RNA MEG3 inhibits the proliferation of cervical carcinoma cells through the induction of cell cycle arrest and apoptosis. Neoplasma. 2013;60:486–492. doi: 10.4149/neo_2013_063. [DOI] [PubMed] [Google Scholar]
- 27.Zhang B, Shi ZL, Liu B, Yan XB, Feng J, Tao HM. Enhanced anticancer effect of gemcitabine by genistein in osteosarcoma: the role of Akt and nuclear factor-kappaB. Anticancer Drugs. 2010;21:288–296. doi: 10.1097/CAD.0b013e328334da17. [DOI] [PubMed] [Google Scholar]
- 28.Andela VB, Siddiqui F, Groman A, Rosier RN. An immunohistochemical analysis to evaluate an inverse correlation between Runx2/Cbfa1 and NF kappa B in human osteosarcoma. J Clin Pathol. 2005;58:328–330. doi: 10.1136/jcp.2004.017640. [DOI] [PMC free article] [PubMed] [Google Scholar]
- 29.Castro-Gamero AM, Borges KS, da Silva Silveira V, Lira RC, de Paula Gomes Queiroz R, Valera FC, Scrideli CA, Umezawa K, Tone LG. Inhibition of nuclear factor-kappaB by dehydroxymethylepoxyquinomicin induces schedule-dependent chemosensitivity to anticancer drugs and enhances chemoinduced apoptosis in osteosarcoma cells. Anticancer Drugs. 2012;23:638–650. doi: 10.1097/CAD.0b013e328350e835. [DOI] [PubMed] [Google Scholar]
- 30.Zhang F, Chen A, Chen J, Yu T, Guo F. SiRNA-mediated silencing of beta-catenin suppresses invasion and chemosensitivity to doxorubicin in MG-63 osteosarcoma cells. Asian Pac J Cancer Prev. 2011;12:239–245. [PubMed] [Google Scholar]
- 31.Luetke A, Meyers PA, Lewis I, Juergens H. Osteosarcoma treatment - where do we stand? A state of the art review. Cancer Treat Rev. 2014;40:523–532. doi: 10.1016/j.ctrv.2013.11.006. [DOI] [PubMed] [Google Scholar]
- 32.Ponting CP, Oliver PL, Reik W. Evolution and functions of long noncoding RNAs. Cell. 2009;136:629–641. doi: 10.1016/j.cell.2009.02.006. [DOI] [PubMed] [Google Scholar]
- 33.Lee JT, Bartolomei MS. X-inactivation, imprinting, and long noncoding RNAs in health and disease. Cell. 2013;152:1308–1323. doi: 10.1016/j.cell.2013.02.016. [DOI] [PubMed] [Google Scholar]
- 34.Gutschner T, Diederichs S. The hallmarks of cancer: a long non-coding RNA point of view. RNA Biol. 2012;9:703–719. doi: 10.4161/rna.20481. [DOI] [PMC free article] [PubMed] [Google Scholar]
- 35.Fan Y, Shen B, Tan M, Mu X, Qin Y, Zhang F, Liu Y. Long non-coding RNA UCA1 increases chemoresistances of bladder cancer cells by regulating Wnt signaling. FEBS J. 2014;281:1750–8. doi: 10.1111/febs.12737. [DOI] [PubMed] [Google Scholar]
- 36.Ding J, Li D, Gong M, Wang J, Huang X, Wu T, Wang C. Expression and clinical significance of the long non-coding RNA PVT1 in human gastric cancer. Onco Targets Ther. 2014;7:1625–1630. doi: 10.2147/OTT.S68854. [DOI] [PMC free article] [PubMed] [Google Scholar]
- 37.Milhem MM, Knutson T, Yang S, Zhu D, Wang X, Leslie KK, Meng X. Correlation of MTDH/AEG-1 and HOTAIR Expression with Metastasis and Response to Treatment in Sarcoma Patients. J Cancer Sci Ther. 2011;S5 [PMC free article] [PubMed] [Google Scholar]
- 38.Jiang M, Huang O, Xie Z, Wu S, Zhang X, Shen A, Liu H, Chen X, Wu J, Lou Y, Mao Y, Sun K, Hu S, Geng M, Shen K. A novel long non-coding RNA-ARA: Adriamycin Resistance Associated. Biochem Pharmacol. 2014;87:254–283. doi: 10.1016/j.bcp.2013.10.020. [DOI] [PubMed] [Google Scholar]
- 39.Wang Y, Zhang D, Wu K, Zhao Q, Nie Y, Fan D. Long noncoding RNA MRUL promotes ABCB1 expression in multidrug-resistant gastric cancer cell sublines. Mol Cell Biol. 2014;34:3182–3193. doi: 10.1128/MCB.01580-13. [DOI] [PMC free article] [PubMed] [Google Scholar]
- 40.Traverso N, Ricciarelli R, Nitti M, Marengo B, Furfaro AL, Pronzato MA, Marinari UM, Domenicotti C. Role of glutathione in cancer progression and chemoresistance. Oxid Med Cell Longev. 2013;2013:972913. doi: 10.1155/2013/972913. [DOI] [PMC free article] [PubMed] [Google Scholar]
- 41.Backos DS, Franklin CC, Reigan P. The role of glutathione in brain tumor drug resistance. Biochem Pharmacol. 2012;83:1005–1012. doi: 10.1016/j.bcp.2011.11.016. [DOI] [PubMed] [Google Scholar]
- 42.Brambila-Tapia AJ. MDR1 (ABCB1) polymorphisms: functional effects and clinical implications. Rev Invest Clin. 2013;65:445–454. [PubMed] [Google Scholar]
- 43.Rohwer N, Cramer T. Hypoxia-mediated drug resistance: novel insights on the functional interaction of HIFs and cell death pathways. Drug Resist Updat. 2011;14:191–201. doi: 10.1016/j.drup.2011.03.001. [DOI] [PubMed] [Google Scholar]
- 44.Sui H, Fan ZZ, Li Q. Signal transduction pathways and transcriptional mechanisms of ABCB1/Pgp-mediated multiple drug resistance in human cancer cells. J Int Med Res. 2012;40:426–435. doi: 10.1177/147323001204000204. [DOI] [PubMed] [Google Scholar]
- 45.Cui YM, Jiang D, Zhang SH, Wu P, Ye YP, Chen CM, Tang N, Liang L, Li TT, Qi L, Wang SY, Jiao HL, Lin J, Ding YQ, Liao WT. FOXC2 promotes colorectal cancer proliferation through inhibition of FOXO3a and activation of MAPK and AKT signaling pathways. Cancer Lett. 2014;353:87–94. doi: 10.1016/j.canlet.2014.07.008. [DOI] [PubMed] [Google Scholar]
- 46.Kume T. The Role of FoxC2 Transcription Factor in Tumor Angiogenesis. J Oncol. 2012;2012:204593. doi: 10.1155/2012/204593. [DOI] [PMC free article] [PubMed] [Google Scholar]
- 47.Saxena M, Stephens MA, Pathak H, Rangarajan A. Transcription factors that mediate epithelial-mesenchymal transition lead to multidrug resistance by upregulating ABC transporters. Cell Death Dis. 2011;2:e179. doi: 10.1038/cddis.2011.61. [DOI] [PMC free article] [PubMed] [Google Scholar]
Associated Data
This section collects any data citations, data availability statements, or supplementary materials included in this article.