Abstract
Objective: The aberrant expression of microRNAs has been demonstrated to play a crucial role in the initiation and progression of gastric cancer (GC). We here aimed to investigate the mechanism of microRNAs in the regulation of GC pathogenesis. Methods: Transwell chambers (8-μM pore size; Costar) were used in the in vitro migration and in vision assay. Dual luciferase reporter gene construct and dual luciferase reporter assay to identify the target of miR-126. CADM1 expression was evaluated by immunohistochemical staining. The clinical manifestations, treatments and survival were collected for statistical analysis. Results: Inhibition of miR-126 effectively reduced migration and invasion of gastric cancer cell lines. Bioinformatics and luciferase reporter assay revealed that miR-126 specifically targeted the 3’UTR of cell adhesion molecule 1 (CADM1) and regulated its expression. Down-regulation of CADM1 enhanced migration and invasion of GC cell lines. Furthermore, in tumor tissues obtained from gastric cancer patients, the expression of miR-126 was negatively correlated with CADM1 and the high expression of miR-126 combined with low expression of CADM1 might serve as a risk factor for stage1 gastric cancer patients. Conclusions: Our study showed that miR-126, by down-regulation CADM1, enhances migration and invasion in GC cells.
Keywords: Gastric cancer (GC), invasion, microRNA-126, cell adhesion molecule 1 (CADM1)
Introduction
Gastric cancer (GC) is the fourth most frequently occurring malignancy, exhibiting considerable geographic variation and ranks as the second leading cause of cancer-related deaths [1]. GC results from a combination of environmental factors and the accumulation of generalized and specific genetic alterations [2]. Although accumulating evidence shows that various genetic alterations cause tumorigenesis and progression of GC [3], the molecular mechanisms underlying the pathogenesis of gastric carcinomas remain to be fully defined.
MicroRNAs (miRNA) are a class of small RNA molecules involved in regulation of translation and degradation of mRNAs [4]. MiRNAs bind to complementary sequences in the 3’untranslated regions (UTR) of their target mRNAs and induce mRNA degradation or translational repression [5]. Most known functions of miRNAs are related to negative gene regulation: miRNAs silence gene expression, usually by interfering with mRNA stability or protein translation. In recent years, miRNAs were believed to act as oncogenes or tumor suppressor genes, and contribute to cancer initiation and progression by regulating gene expression [6]. The discovery of cancer-specific upstream region hypermethylation of numerous miRNAs has demonstrated an epigenetic mechanism for aberrant miRNA expression [7,8].
Previous studies have investigated the role of miR-126 in several cancers. It was demonstrated that the expression of miR-126 was significantly associated with disease free survival of the non-amplified favorable neuroblastoma [9]. Further, Choi et el [10] found that the expression of miR-126 was reduced in human gliomas and forced expression of miR-126 in glioma cells strongly inhibited the cell proliferation, invasion mediated by targeting MET. Moreover, Musiani et al. [11] found that miR-126 negatively regulated pRb/E2F pathway by directly targeting CDK1 which was an oncogene in breast cancer. However, the role of miR-126 in GC still remains unclear. In this study, we demonstrated that decreased miR-126 expression is a characteristic molecular change in GC and investigated the effect of modulated miR-126 levels on the phenotypes of GC cell lines. We also showed that miR-126 may function as an oncogene by directly targeting CADM1.
Materials and methods
Cell culture
The human gastric cancer cell lines MKN-1, MKN-7, AGS, SGC-7901 and BGC-823 and the normal gastric epithelium cell line GES-1 were grown in RPMI 1640 medium supplemented with 10% FBS (Hyclone). The cell cultures were incubated in room air at 37°C in a humidified atmosphere of 5% CO2.
Patients and tissue specimens
The gastric mucosal specimens were obtained from 30 patients undergoing gastroscope examination as described in previous study [12]. The gastric cancer tissues and the corresponding normal tissues were obtained from patients with primary gastric cancer as described [13].
Reverse transcription and real-time polymerase chain reaction to quantify mature miR-126
Total RNA was extracted with TRIzol (Invitrogen). For mature miRNA expression analysis, cDNA was synthesized with the Taqman MiRNA Reverse Transcription kit (Applied Biosystems) and 100 ng of total RNA (100 ng/μL), along with 1 μL of miR-126 (Applied Biosystems) specific primers that were supplied with the miRNA Taqman MicroRNA Assay, according to the manufacturer’s instructions. Quantitative real-time polymerase chain reaction (PCR) analyses were performed in triplicate on a 7900HT Real-Time PCR System (Applied Biosystems), and the data were normalized to RNU6B (Applied Biosystems) for each reaction. The thermal cycling profile used was as follows: 95°C for 10 min, followed by 40 cycles of 95°C for 15 s and 60°C for 60 s. Quantification was performed according to the standard ΔΔCT method.
Transfection of the miR-126 precursor
Cells were seeded 24 h prior to transfection into 24-well or 6-well plates or 6 cm dishes. Hsa-miR-126 (Applied Biosystems), or a miRNA mimic control (Applied Biosystems) was transfected with Lipofectamine 2000 (Invitrogen) at a final concentration of 50 nmol/L. The sequences of the mature miR-126 used in this study were GGUGCAGUGCUGCAUCUCUGGU and UGAGAUGAAGCACUGUAGCUC. The cells were harvested at 24 h (for RNA extraction), 48 h (for protein extraction) or 72 h (for apoptosis assays).
Cell viability assays
An Alamar blue assay was used to measure cell proliferation. This assay is based on the quantitative metabolic conversion of blue, non-fluorescent resazurin to pink, fluorescent resorufin by living cells. After 72 h of incubation, an Alamar blue (Invitrogen) stock solution was aseptically added to the wells to equal to 10% of the total incubation volume. The resazurin reduction in the cultures was determined after a 2-6 h incubation with Alamar blue by measuring the absorbances at 530-nm and 590-nm wavelengths on a Synergy HT Multi-Mode Microplate Reader (Bio-tek Instruments).
Apoptosis assay
Following maintenance in culture, the cells were harvested and stained with phycoerythrin-conjugated Annexin V according to the manufacturer’s instructions (BD Biosciences). The cells were then analyzed on a FACSCalibur flow cytometer (BD Biosciences). The cells were considered viable if double negative, early apoptotic if positive for Annexin V alone and necrotic or late apoptotic if double positive.
Western blot
Cells were harvested, washed twice in PBS, and lysed in lysis buffer (protease inhibitors were added immediately before use) for 30 min on ice. Lysate was centrifuged at 10000 rmp and the supernatants were collected and stored at -70 in aliquots. All procedures were carried out on ice. Protein concentration was determined using BCA assay kit (Tianlai Biotech).
miRNA real-time PCR
1 × 10²-1 × 10⁷ cells were harvested, washed in PBS once, and stored on ice; complete cell lysate was prepared by addition of 600 µl lysis binding buffer and vertex; 60 µl miRNA aomogenete addictive was added to the cell lysate and mixed thoroughly by inverting several times; sample was stored on ice for 10 min, followed by addition of equal volume (600 µl) of phenol: chloroform (1:1) solution; sample was mixed by inverting for 30-60 sec, and then centrifuged at 12000 g for 5 min; the supernatant was transferred to a new tube and the volume was estimated; 1/3 volume of 100% ethanol was added and mixed; the mixture was loaded to the column at room temperature and centrifuged at 10000 g for 15 sec; the flow-though was collected and the volume was then estimated; 2/3 volume of 00% ethanol was added and mixed; the mixture was loaded to column at room temperature and centrifuged at 10000 g for 15 sec; the flow-through was discarded; 700 µl miRNA wash solution was added to the column, followed by centrifugation at 10000 for 10 sec; the flow-through was discarded; 500 µl miRNA wash solution was added to the column, followed by centrifugation at 10000 for 10 sec; the flow-through was discarded; the column was transferred to a new tube and 100 µl preheated elution solution (95°C) was added at room temperature; RNA was collected by centrifugation at 12000 g for 30 sec.
Immunoblotting
For immunoblotting, the human gastric cancer cells were collected 72 hours after transfection with miR-126 precursor or negative control miRNA precursor. Cells were lysed using 1 × RIPA buffer (Upstate Biotechnology, Lake Placid, NY) containing a protease inhibitor cocktail (Sigma, St. Louis, MO). After cell lysis, 45 mg of protein was loaded on a 10% SDS gel followed by transfer to PVDF membrane. Antibodies against SGPP2 (Abcam, Cambridge, MA), Smad4 (Cell Signaling Technologies, Danvers, MA), and Actin (Sigma, St. Louis, MO) were used. Secondary antibody was purchased from Santa Cruz Biotechnology (Santa Cruz, CA). The detected signals were visualized by an enhanced chemiluminescence kit (Beyotime Institute of Biotechnology, Haimen, Jiangsu, China), as recommended by the manufacturer.
Tumor-bearing (Xenografts) study
As reported recently [14] 1.5 × 10⁵ murine gastric adenocarcinoma cells re-suspended in 150 µl PBS were injected subcutaneously into the flank of the normal C57B/l6 mice at age about 8 weeks (5 mice per group). Both gastric cell line and the mice were in C57BL/6 background and no rejection occurred. The animals were maintained in a pathogen-free barrier facility and closely monitored by animal facility staff. The grown tumors (xenografts) were measured every 3 day starting 23 days post inoculation of cells using caliper as length × width × width/2 (mm3). 6.26 µg of miR-126 precursor or negative miRNA (GenePharma, Shanghai, China) mixed with 1.6 µl transfection reagent Lipofectamine 2000 (Invitrogen) in 50 µl PBS were injected into the tumors every 3 days, for total of 3 times. 32 days after inoculation, the animals were sacrificed and the xenografts were isolated, the weight (gram) and volume (mm3) of the xenografts were determined. All procedures were conducted according to the Animal Care and Use guideline approved by Xinxiang Medical University Animal Care Committee.
Statistical analysis
Student’s t-test (two-tailed), One-way ANOVA and Mann-Whitney test were employed to analyze the in vitro and in vivo data using SPSS 12.0 software (Chicago, IL, USA). P value < 0.05 was defined as statistically significant.
Results
miR-126 expression is up-regulated in gastric cancer
We first examined miR-126 expression in gastric epithelial cells. As shown in Figure 1A, miR-126 level was significantly increased in AGS, HGC-27, BGC-823, SGC-7901, MKN-7 and GES-1. To determine whether miR-126 is up-regulated in gastric tissues, cancer samples (n = 18) and normal controls (n = 12) were detected. As shown in Figure 1B, miR-126 was significantly up-regulated in cancer patients, with a 3.2-fold increase. We then examined the miR-126 expression in gastric cancer cell lines AGS, MKN-7, HGC-27, BGC-823 and SGC-7901 as well as gastric cancer tissues. As shown in Figure 1C, all gastric cancer cell lines expressed higher levels of miR-126 compared with five normal gastric mucosa tissues. Furthermore, we compared miR-126 expression profiles between five pairs of gastric cancer tissues and matched normal gastric mucosa tissues. In comparison with the adjacentnon-cancerous tissues, miR-126 showed on average 2.3-fold higher expression in cancer tissues (Figure 1D). These results suggested that miR-126 is over-expressed in gastric cancer.
Figure 1.
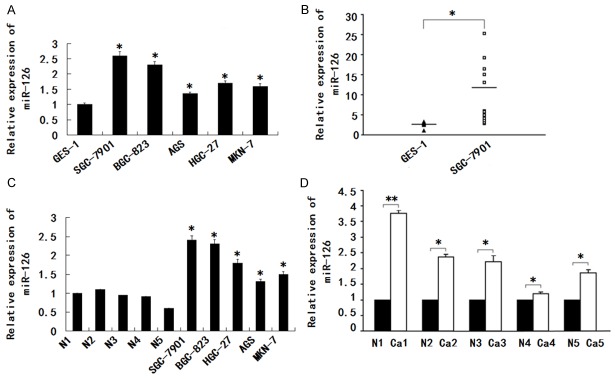
miR-126 expression is up-regulated in gastric cancer. A. The miR-126 expression was assayed in AGS, HGC-27, BGC-823, MKN-7, SGC-7901 or GES-1. B. Expression of miR-126 in gastric mucosal tissues from cancer patients (n = 18) and normal individuals (n = 12). C. Comparison of expression level of miR-126 between gastric cancer cell lines AGS, HGC-27, BGC-823, SGC-7901, MKN-7, and five normal gastric mucosa tissue samples. D. Comparison of expression level of miR-126 between gastric cancer tissue and normal tissue samples; Relative expression level of miR-126 was determined by qRT-PCR, and all data were normalized by U6. Data are mean ± S.D. of triplicate samples and are a representative experiment of three separate experiments, *P < 0.05, **P < 0.01.
miR-126 promotes migration and invasion of GC cell lines in vitro
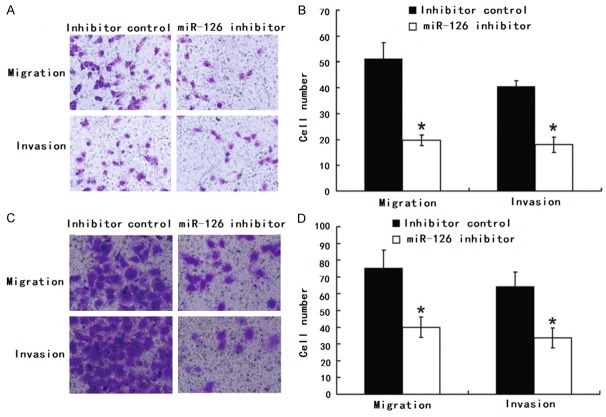
The higher expression of miR-126 in more metastatic GC line SGC-7901 promoted us to investigate its effect on the migration and invasion of GC. BGC-823 and SGC-7901 cells were transfected with either miR-126 mimic, mimic control, miR-126 inhibitor or inhibitor control and then subjected to cell migration assay and cell invasion assay, respectively As expected, cell motility in both cell lines was significantly reduced after transfection of the miR-126 inhibitor compared with inhibitor control (Figure 2). Their motility was significantly reduced after transfection of the miR-126 inhibitor compared with inhibitor control. However, no difference was observed between miR-126 mimic and mimic control in GC line SGC-7901 and BGC-823.
Figure 2.
Inhibition of miR-126 reduced migration and invasion of SGC-7901 and BGC-823. A, B. Transwell migration (n = 4) and invasion (n = 4) assays showed that SGC-7901 cells transfected with the miR-126 inhibitor (800 nM) had lower invasive and migratory potentials than the control (inhibitor control). A is a microscopic image of crystal violet staining; B shows the statistical results. C, D. Transwell migration (n = 4) and invasion (n = 4) assays showed that BGC-823 cells transfected with the miR-126 inhibitor (800 nM) had lower invasive and migratory potentials than the control (inhibitor control). C is a microscopic image of crystal violet staining; D shows the statistical results. Data represent the mean ± SD of four independent experiments. *P < 0.01.
Over-expression of miRNA-126 promotes cell proliferation and colony formation in vitro
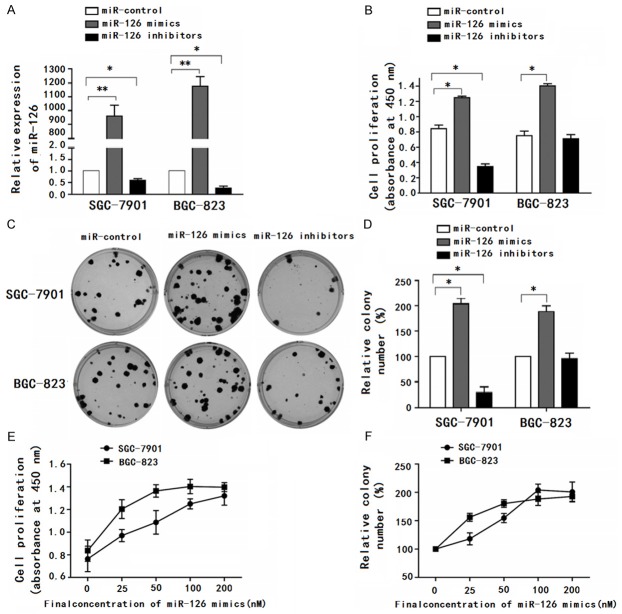
To test whether miR-126 functions as an oncogene, we examined the effects of miR-126 on gastric cancer cell proliferation. First, we tested miR-126 expression in transfected SGC-7901 and BGC-823 cells by qRT-PCR (Figure 3A). At 48 h post-transfection, the effect of miR-126 over-expression on cell proliferation was evaluated by CCK-8 assay. In SGC-7901 or BGC-823 cells, miR-126 mimics showed a significant proliferative effect compared with the control group (Figure 3B). To further test the biological effect of miR-126 on the growth of gastric cancer cells, the colony formation assay was performed. As is shown in Figure 3C, the colony number of SGC-7901 or BGC-823 cells transfected with miR-126 mimics was significantly higher than those transfected with control oligonucleotides. Moreover, miR-126 inhibitors significantly reduced cell proliferation (Figure 3B) and resulted in fewer colonies (Figure 3C) in SGC-7901 cells, but not in BGC-823 cells. The reason of the difference may be related to the low basic level of miR-126 in BGC-823 cells. The dose-dependent effect of miR-126 mimics was also conspicuous both in the CCK-8 assay (Figure 3D) and the colony formation assay (Figure 3E). These results suggested that miR-126 could be an oncogene.
Figure 3.
Over-expression of miRNA-126 promotes cell proliferation and colony formation in vitro. A. Fold changes in miR-126 expression are illustrated by qRT-PCR after the transfection of miR-control, miR-126 mimics or inhibitors at 100 nM for 24 h. B. Cells transfected with the indicated oligonucleotides at 100 nM for 48 h were subjected with CCK-8 analysis. C. Cells transfected with the indicated oligonucleotides at 100 nM were detected with colony formation assay. D and E. Cells transfected with different amounts of miR-126 mimics for 48 h were subjected to CCK-8 analysis. F. Cells transfected with gradually increased quantity of miR-126 mimics were detected with colony formation assay. Data are representative of at least three independent experiments, *P < 0.05, **P < 0.01.
CADM1 is a novel target of miRNA-126
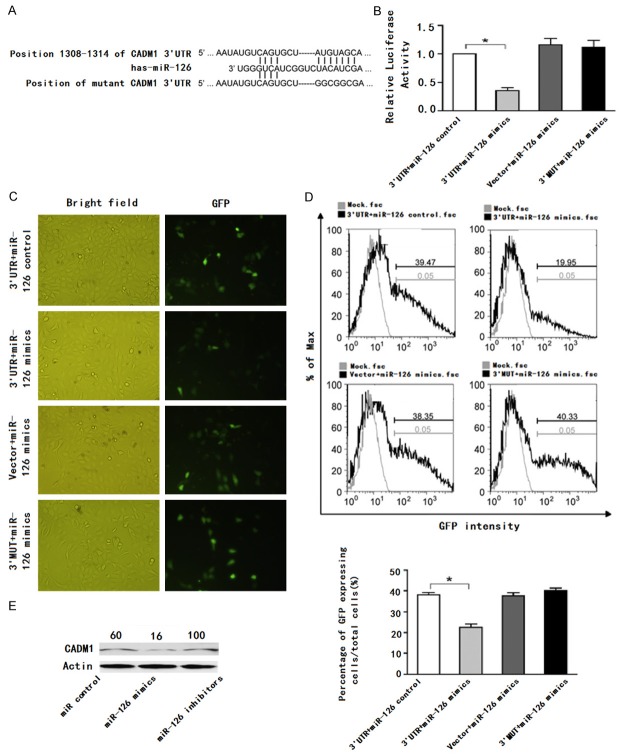
We used TargetScan (version4.2, http://www.targetscan.org/) to predict the candidate target genes of miR-126. CADM1, a tumor suppressor gene, was found to have a putative miR-126 binding sites within its 3’UTR (Figure 4A). To validate whether CADM1 is a bonafide target of miR-126, we generated two luciferase report vectors that contain the putative miR-126 binding sites within CADM1 3’UTR and mutant 3’UTR (3’MUT). As shown in Figure 4B, the relative luciferase activity was reduced following cotransfection with miR-126 mimics compared with transfection with miR-126 control. In contrast, no change of luciferase was observed in cells transfected with 3’MUT constructs or empty vectors. This result was subsequently confirmed by GFP repression experiments (Figure 4C and 4D). Furthermore, transfection of miR-126 mimics decreased CADM1 expression in SGC-7901 cells at the protein levels (Figure 4E), suggesting that CADM1 expression could be inhibited by miR-126. Together, these results suggested that CADM1 is a novel target of miR-126.
Figure 4.
CADM1 is a novel target of miRNA-126. A. Predicted consequential pairing of target 3’-UTR region of CADM1 (wild type or mutated) and miR-126 mature sequence. B. GES-1 cells were transiently cotransfected with luciferase report vectors, and either miR-126 mimics or miR-control. Luciferase activities were normalized to the activity of Renilla luciferase. C and D. GES-1 cells were transfected with the GFP report vectors and either miR-126 mimics or miR-control. E. Western blots analysis for CADM1 of SGC-7901 cells transfected with indicated oligonucleotides. Data are representative of at least three independent experiments, *P < 0.05.
Down-regulation of CADM1 enhanced migration and invasion of HCC cell lines
We next evaluated whether down-regulation of CADM1 levels might have a reverse effect on cell motility as observed following miR-126 inhibition. Transwell migration (n = 4) and invasion (n = 4) assays showed that SGC-7901 cells that were transfected with the CADM1 siRNA (200 nM) had greater invasive and migratory potentials than the control (siRNA control) (Figure 5). Also, Transwell migration (n = 4) and invasion (n = 4) assays showed that BGC-823 cells that were transfected with the CADM1 siRNA (200 nM) had greater invasive and migratory potentials than the control (siRNA control).
Figure 5.
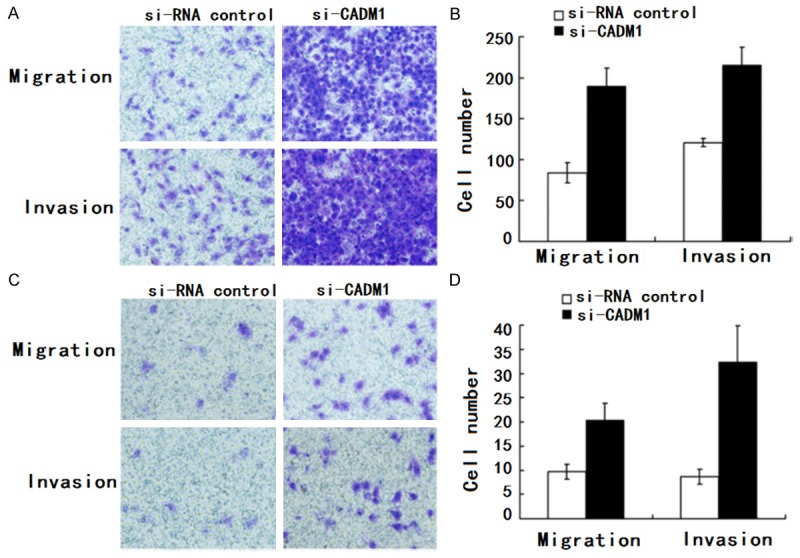
CADM1 regulated HCC cell migration and invasion. A, B. Transwell migration (n = 4) and invasion (n = 4) assays showed that SGC-7901 cells that were transfected with the CADM1 siRNA (200 nM) had greater invasive and migratory potentials than the control (siRNA control). A is a microscopic image of Crystal violet staining; B shows the statistical results. C, D. Transwell migration (n = 4) and invasion (n = 4) assays showed that BGC-823 cells that were transfected with the CADM1 siRNA (200 nM) had greater invasive and migratory potentials than the control (siRNA control). C is a microscopic image of Crystal violet staining; D shows the statistical results. Data represent the mean ± SD of four independent experiments. *P < 0.01.
Correlation between miR-126 and CADM1 expression and disease free survival (DFS) of the patients
From 2011 to 2012, 91 patients with GC got surgery in Peking Union Medical College hospital and among them only 38 had follow-up data for statistical analysis. By June 30th, 2013, 19 patients had recurrence and 11 patients died. So we didn’t perform OS. Using Cox assay to analyze the influence of miR-1246 and CADM1 on DFS, we found only TNM and pathological differentiation were statistically significantly correlated with DFS (Figure 6A). To rule out the influence of TNM on DFS, we analyzed 25 patients who were classified as stage 1 according to TNM. Patients with high miR-126 expression had DFS of 32.53 m ± 5.69 m (21.37 m-41.30 m) while patients with low miR-126 expression had DFS of 44.11 m ± 4.61 m (35.07 m-53.15 m) (P = 0.143 Figure 6B). Patients who were CADM1 positive had DFS of 48.36 m ± 4.42 m (39.69 m-57.02 m) while patients were CADM1 negative had DFS of 28.35 m ± 3.76 m (20.97-35.72) (P = 0.039 Figure 6C). Since miR-126 and CADM1 were correlated, we draw the conclusion that higher miR-126 expression combined with low CADM1 expression could serve as a risk factor for stage1 gastric cancer patients. We didn’t analyze patients in stage 2 and 3 due to the limited patient number.
Figure 6.
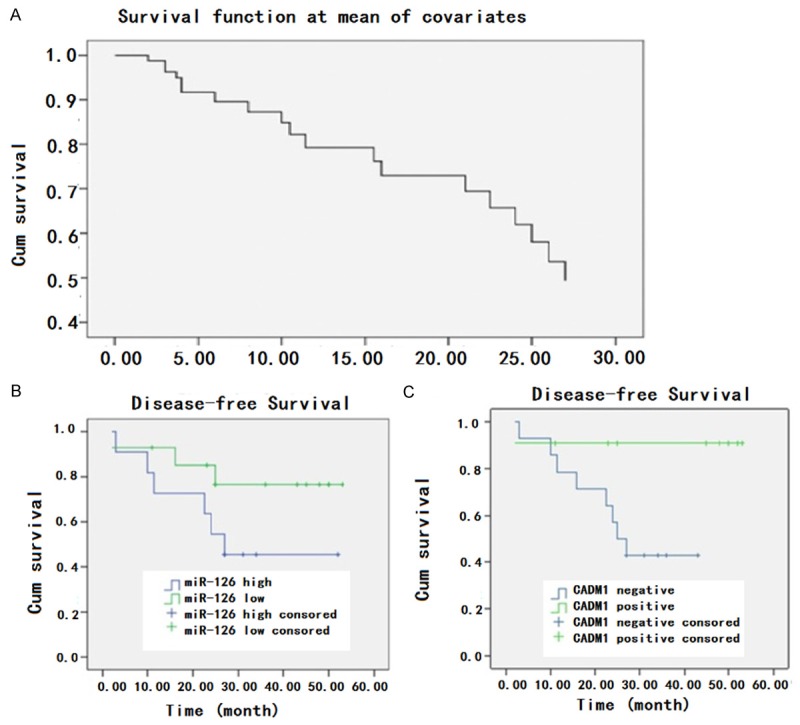
Influence of different factors on DFS of the patients. A. The DFS of all patients; B. The influence of miR-126 expression on DFS of stage I patients (P = 0.143); C. The relationship between expression of CADM1 and DFS in stage I patients (P = 0.039).
Discussion
Tumor metastasis is a complex series of steps that involve a number of influential factors. Additionally, due to tumor heterogeneity, the mechanisms underlying distal metastasis could be totally different even though primary tumors possess similar clinical manifestations and histological types [15]. Thus, the advance of detecting biomarker indicative of high-risk tumor metastasis may immensely benefit the approach of personalized cancer treatment. Lately, miRNA has been regarded as an excellent biomarker owing to several unique features: an average 22 nucleotides in length, more stable expression compared with mRNA and more likely to be detected in samples with mRNA and protein degraded. Furthermore, the convenience of synthesizing an over-expressed or an interfering sequence also made miRNA a potential candidate for novel therapeutic strategies [16].
Consistent with previous findings [17], we also found that miR-126 was highly expressed in gastric cancer. The growth potential was strongly enhanced when miR-126 were over-expressed in gastric cancer cells. Of note, deregulated cell proliferation is a key mechanism for neoplastic progression [18]. Thus, these results indicate that miR-126 in gastric cancer cells may function as oncogene by inducing an enhancement of cell proliferation. Recent reports revealed that negative regulation of p27 and p57 by miR-126 might also contribute to cell proliferation and viability [19-21]. Moreover, PTEN, as a target of miR-126, might also affect cell proliferation in gastric cancers [22,23]. In this report, we identified that CADM1 was a novel target of miR-126.
The expression level of miR-126 in GC cells is quite high [24]. Our previous study analyzed the differential expression of miRNAs between AGS and MKN-7 using microRNA microarray [25] and discovered differential expression of miR-126. To define its role, we carried out several biological function assays in different GC cell lines and found that inhibition of miR-126 in SGC-7901 and BGC-823 which have relatively high expression levels of miR-126 significantly reduce migration and invasion while over-expression of miR-126 had little effects. We speculate that this may be attributed to the abundant expression levels of miR-126 in these GC cell lines and that regulation of target genes by miR-126 may have reached the maximal extent. According to the prediction of biological databases, CADM1 might be a target gene of miR-126. CADM1, also known as TSLC1, is a well-defined tumor suppressor gene that has been discovered recently [26]. CADM1 gene encodes a 442-amino acid protein which contains an extracellular domain, a transmembrane domain and a cytoplasmic domain. Extracellular domain of CADM1 of 373 amino acids includes three Ig-like C2-type domain connected by disulfide bonds. This structure is also existed in other immunoglobulin superfamily cell adhesion molecule (IgCAM) members, which are refered to as nectins [27,28]. Therefore, CADM1 is considered to be involved in cell-cell interactions. Expression of CADM1 is lost or reduced in a variety of cancers, including nonsmall cell lung cancer (NSCLC) [29], breast cancer [30], cervix cancer [31], and GC [32]. This reduction has been associated with enhanced metastasis potential and poor prognosis. So far, it has been postulated that loss of heterozygosity (LOH) [33], promoter hypermethylation [18,19,24] and miRNA mediated regulation might be mechanisms underlying the loss of CADM1 expression. miR-10b and miR-216a are two microRNAs implicated in regulation of CADM1 in GC [23,25]. Li et al. reported that miR-10b enhances tumor invasion and metastasis through targeting CADM1. Moreover, patients with higher miR-10b expression had significantly poorer overall survival.
Although higher expression of miR-126 has been reported in the serum of tumor carrying mice [34] and oesophageal squamous cell carcinoma [35], few studies are available for interpreting miR-126’s function in tumor. Our study is the first to report miR-126 could regulate invasion and migration of GC cell via targeting CADM1. There is no doubt that CADM1 functions as a tumor suppressor gene in GC [36]. In this study, we also demonstrated that CADM1 RNA interference results in up-regulation of invasion and migration in GC cell lines. However, the mechanism underlying tumor suppression by CADM1 remains to be fully elucidated.
We confirmed that miR-126 could promote migration and invasion through CADM1 in GC cell lines. Whether miR-126 and CADM1 expression are correlated in tumor tissues is not investigated before. Here, using clinical samples from 38 patients of liver cancer, we analyzed miR-126 and CADM1 expression by RT-PCR and immunohistochemisty, respectively and found that miR-126 expression was negatively correlated to CADM1, which was of statistical significance. In 25 patients who were classified as stage 1 according to TNM, those who were CADM1 positive had long DFS while patients were CADM1 negative had short DFS and the difference was statistically significant. Patients who had high miR-126 expression had short DFS while those with low miR-126 expression had long DFS, although the difference was not statistically significant. When we analyze miR-126 expression, we use the total RNA extracted from the tumor tissues which contain not only epithelial cancer tissues, but also mesenchymal tissues. Since the proportion of epithelial cancer tissues in tumors differs between patients, analyzing miR-126 expression in total RNA might influence the results. CADM1 expression is detected by immunohistochemistry which is more accurate because pathologists can directly determine the expression of CADM1 in tumor tissues. In our study, miR-126 expression is negatively correlated with CADM1. So although the correlation between miR-126 and DFS is not statistically significant, high miR-126 expression combined with low CADM1 could still serve as a risk factor for DFS.
In this study, we showed that miR-126 is highly expressed in more metastatic GC cells and inhibition of miR-126 effectively reduced migration and invasion of GC cells by down-regulation CADM1. More importantly, we found high expression of miR-126 combined with low expression of CADM1 might serve as a risk factor for stage1 gastric cancer patients. Here, we provide new insights into the metastasis enhancer functions of miR-126 in GC. Identifying small molecules targeting miR-126 might lead to vigorous therapeutic strategies for gastric carcinoma.
Disclosure of conflict of interest
None.
References
- 1.Chen J, Chen LJ, Zhou HC, Yang RB, Lu Y, Xia YL, Wu W, Hu LW. Prognostic value of matrix metalloproteinase-9 in gastric cancer: a meta-analysis. Hepatogastroenterology. 2014;61:518–24. [PubMed] [Google Scholar]
- 2.Yang Y, Bai ZG, Yin J, Wu GC, Zhang ZT. Role of c-Src activity in the regulation of gastric cancer cell migration. Oncol Rep. 2014;32:45–9. doi: 10.3892/or.2014.3188. [DOI] [PMC free article] [PubMed] [Google Scholar]
- 3.Li Y, Tan BB, Zhao Q, Fan LQ, Wang D, Liu Y. ZNF139 promotes tumor metastasis by increasing migration and invasion in human gastric cancer cells. Neoplasma. 2014;61:291–8. doi: 10.4149/neo_2014_037. [DOI] [PubMed] [Google Scholar]
- 4.Yu SY, Li Y, Fan LQ, Zhao Q, Tan BB, Liu Y. Impact of Annexin A3 expression in gastric cancer cells. Neoplasma. 2014;61:257–64. doi: 10.4149/neo_2014_033. [DOI] [PubMed] [Google Scholar]
- 5.Oo HZ, Sentani K, Sakamoto N, Anami K, Naito Y, Uraoka N, Oshima T, Yanagihara K, Oue N, Yasui W. Overexpression of ZDHHC14 promotes migration and invasion of scirrhous type gastric cancer. Oncol Rep. 2014;32:403–10. doi: 10.3892/or.2014.3166. [DOI] [PubMed] [Google Scholar]
- 6.Li XS, Xu Q, Fu XY, Luo WS. Heat shock protein 22 overexpression is associated with the progression and prognosis in gastric cancer. J Cancer Res Clin Oncol. 2014;140:1305–13. doi: 10.1007/s00432-014-1698-z. [DOI] [PubMed] [Google Scholar]
- 7.Guan SS, Chang J, Cheng CC, Luo TY, Ho AS, Wang CC, Wu CT, Liu SH. Afatinib and its encapsulated polymeric micelles inhibits HER2-overexpressed colorectal tumor cell growth in vitro and in vivo. Oncotarget. 2014;5:4868–80. doi: 10.18632/oncotarget.2050. [DOI] [PMC free article] [PubMed] [Google Scholar]
- 8.Luo BH, Xiong F, Wang JP, Li JH, Zhong M, Liu QL, Luo GQ, Yang XJ, Xiao N, Xie B, Xiao H, Liu RJ, Dong CS, Wang KS, Wen JF. Epidermal growth factor-like domain-containing protein 7 (EGFL7) enhances EGF receptor-AKT signaling, epithelial-mesenchymal transition, and metastasis of gastric cancer cells. PLoS One. 2014;9:e99922. doi: 10.1371/journal.pone.0099922. [DOI] [PMC free article] [PubMed] [Google Scholar]
- 9.Vaiopoulos AG, Kostakis ID, Gkioka E, Athanasoula KCh, Pikoulis E, Papalambros A, Christopoulos P, Gogas H, Kouraklis G, Koutsilieris M. Detection of circulating tumor cells in colorectal and gastric cancer using a multiplex PCR assay. Anticancer Res. 2014;34:3083–92. [PubMed] [Google Scholar]
- 10.Choi MR, An CH, Chung YJ, Choi YJ, Yoo NJ, Lee SH. Mutational and expressional analysis of ERBB3 gene in common solid cancers. APMIS. 2014;122:1207–12. doi: 10.1111/apm.12286. [DOI] [PubMed] [Google Scholar]
- 11.Musiani D, Konda JD, Pavan S, Torchiaro E, Sassi F, Noghero A, Erriquez J, Perera T, Olivero M, Di Renzo MF. Heat-shock protein 27 (HSP27, HSPB1) is up-regulated by MET kinase inhibitors and confers resistance to MET-targeted therapy. FASEB J. 2014;28:4055–67. doi: 10.1096/fj.13-247924. [DOI] [PMC free article] [PubMed] [Google Scholar]
- 12.Xu L, Qu X, Li H, Li C, Liu J, Zheng H, Liu Y. Src/caveolin-1-regulated EGFR activation antagonizes TRAIL-induced apoptosis ingastric cancer cells. Oncol Rep. 2014;32:318–24. doi: 10.3892/or.2014.3183. [DOI] [PubMed] [Google Scholar]
- 13.Aprile G, Giampieri R, Bonotto M, Bittoni A, Ongaro E, Cardellino GG, Graziano F, Giuliani F, Fasola G, Cascinu S, Scartozzi M. The challenge of targeted therapies for gastric cancer patients: the beginning of a long journey. Expert Opin Investig Drugs. 2014;23:925–42. doi: 10.1517/13543784.2014.912631. [DOI] [PubMed] [Google Scholar]
- 14.Kurokawa Y, Matsuura N, Kawabata R, Nishikawa K, Ebisui C, Yokoyama Y, Shaker MN, Hamakawa T, Takahashi T, Takiguchi S, Mori M, Doki Y. Prognostic Impact of Major Receptor Tyrosine Kinase Expression in Gastric Cancer. Ann Surg Oncol. 2014;21(Suppl 4):S584–90. doi: 10.1245/s10434-014-3690-x. [DOI] [PubMed] [Google Scholar]
- 15.Nielsen TO, Friis-Hansen L, Poulsen SS, Federspiel B, Sorensen BS. Expression of the EGF family in gastric cancer: downregulation of HER4 and its activating ligand NRG4. PLoS One. 2014;9:e94606. doi: 10.1371/journal.pone.0094606. [DOI] [PMC free article] [PubMed] [Google Scholar]
- 16.Pertino MW, Lopez C, Theoduloz C, Schmeda-Hirschmann G. 1,2,3-triazole-substituted oleanolic Acid derivatives: synthesis and antiproliferative activity. Molecules. 2013;18:7661–74. doi: 10.3390/molecules18077661. [DOI] [PMC free article] [PubMed] [Google Scholar]
- 17.Rasul A, Khan M, Yu B, Ali M, Bo YJ, Yang H, Ma T. Isoalantolactone, a sesquiterpene lactone, induces apoptosis in SGC-7901 cells via mitochondrial and phosphatidylinositol 3-kinase/Akt signaling pathways. Arch Pharm Res. 2013;36:1262–9. doi: 10.1007/s12272-013-0217-0. [DOI] [PubMed] [Google Scholar]
- 18.Hong KJ, Wu DC, Cheng KH, Chen LT, Hung WC. RECK inhibits stemness gene expression and tumorigenicity of gastric cancer cells by suppressing ADAM-mediated Notch1 activation. J Cell Physiol. 2014;229:191–201. doi: 10.1002/jcp.24434. [DOI] [PubMed] [Google Scholar]
- 19.Yang B, Jing C, Wang J, Guo X, Chen Y, Xu R, Peng L, Liu J, Li L. Identification of microRNAs associated with lymphangiogenesis in human gastric cancer. Clin Transl Oncol. 2014;16:374–9. doi: 10.1007/s12094-013-1081-6. [DOI] [PubMed] [Google Scholar]
- 20.Guo LH, Li H, Wang F, Yu J, He JS. The Tumor Suppressor Roles of miR-433 and miR-127 in Gastric Cancer. Int J Mol Sci. 2013;14:14171–84. doi: 10.3390/ijms140714171. [DOI] [PMC free article] [PubMed] [Google Scholar]
- 21.Liu QS, Zhang J, Liu M, Dong WG. Lentiviral-mediated miRNA against liver-intestine cadherin suppresses tumor growth and invasiveness of human gastric cancer. Cancer Sci. 2010;101:1807–12. doi: 10.1111/j.1349-7006.2010.01600.x. [DOI] [PMC free article] [PubMed] [Google Scholar]
- 22.Kim YM, Kim IH, Nam TJ. Inhibition of AGS human gastric cancer cell invasion and proliferation by Capsosiphon fulvescens glycoprotein. Mol Med Rep. 2013;8:11–6. doi: 10.3892/mmr.2013.1492. [DOI] [PMC free article] [PubMed] [Google Scholar]
- 23.Tong F, Cao P, Yin Y, Xia S, Lai R, Liu S. MicroRNAs in gastric cancer: from benchtop to bedside. Dig Dis Sci. 2014;59:24–30. doi: 10.1007/s10620-013-2887-3. [DOI] [PubMed] [Google Scholar]
- 24.Fang Y, Shen H, Li H, Cao Y, Qin R, Long L, Zhu X, Xie C, Xu W. miR-106a confers cisplatin resistance by regulating PTEN/Akt pathway in gastric cancer cells. Acta Biochim Biophys Sin. 2013;45:963–72. doi: 10.1093/abbs/gmt106. [DOI] [PubMed] [Google Scholar]
- 25.Wu XJ, Mi YY, Yang H, Hu AK, Li C, Li XD, Zhang QG. Association of the hsa-mir-499 (rs3746444) polymorphisms with gastric cancer risk in the Chinese population. Onkologie. 2013;36:573–6. doi: 10.1159/000355518. [DOI] [PubMed] [Google Scholar]
- 26.Shiotani A, Murao T, Kimura Y, Matsumoto H, Kamada T, Kusunoki H, Inoue K, Uedo N, Iishi H, Haruma K. Identification of serum miRNAs as novel non-invasive biomarkers for detection of high risk for early gastric cancer. Br J Cancer. 2013;109:2323–30. doi: 10.1038/bjc.2013.596. [DOI] [PMC free article] [PubMed] [Google Scholar]
- 27.Yoon JH, Choi YJ, Choi WS, Nam SW, Lee JY, Park WS. Functional analysis of the NH2-terminal hydrophobic region and BRICHOS domain of GKN1. Biochem Biophys Res Commun. 2013;440:689–95. doi: 10.1016/j.bbrc.2013.09.123. [DOI] [PubMed] [Google Scholar]
- 28.Iwaya T, Fukagawa T, Suzuki Y, Takahashi Y, Sawada G, Ishibashi M, Kurashige J, Sudo T, Tanaka F, Shibata K, Endo F, Katagiri H, Ishida K, Kume K, Nishizuka S, Iinuma H, Wakabayashi G, Mori M, Sasako M, Mimori K. Contrasting expression patterns of histone mRNA and microRNA 760 in patients with gastric cancer. Clin Cancer Res. 2013;19:6438–49. doi: 10.1158/1078-0432.CCR-12-3186. [DOI] [PubMed] [Google Scholar]
- 29.Won KJ, Im JY, Yun CO, Chung KS, Kim YJ, Lee JS, Jung YJ, Kim BK, Song KB, Kim YH, Chun HK, Jung KE, Kim MH, Won M. Human Noxin is an anti-apoptotic protein in response to DNA damage of A549 non-small cell lung carcinoma. Int J Cancer. 2014;134:2595–604. doi: 10.1002/ijc.28600. [DOI] [PubMed] [Google Scholar]
- 30.Nakadate Y, Kodera Y, Kitamura Y, Tachibana T, Tamura T, Koizumi F. Silencing of poly(ADP-ribose) glycohydrolase sensitizes lung cancer cells to radiation through the abrogation of DNA damage checkpoint. Biochem Biophys Res Commun. 2013;441:793–8. doi: 10.1016/j.bbrc.2013.10.134. [DOI] [PubMed] [Google Scholar]
- 31.Shen J, Niu W, Zhou M, Zhang H, Ma J, Wang L, Zhang H. MicroRNA-410 Suppresses Migration and Invasion by Targeting MDM2 in Gastric Cancer. PLoS One. 2014;9:e104510. doi: 10.1371/journal.pone.0104510. [DOI] [PMC free article] [PubMed] [Google Scholar] [Retracted]
- 32.McLean MH, El-Omar EM. Genetics of gastric cancer. Nat Rev Gastroenterol Hepatol. 2014;11:664–74. doi: 10.1038/nrgastro.2014.143. [DOI] [PubMed] [Google Scholar]
- 33.Shin VY, Chu KM. MiRNA as potential biomarkers and therapeutic targets for gastric cancer. World J Gastroenterol. 2014;20:10432–10439. doi: 10.3748/wjg.v20.i30.10432. [DOI] [PMC free article] [PubMed] [Google Scholar]
- 34.Zhao H, Wang Y, Yang L, Jiang R, Li W. MiR-25 promotes gastric cancer cells growth and motility by targeting RECK. Mol Cell Biochem. 2014;385:207–13. doi: 10.1007/s11010-013-1829-x. [DOI] [PubMed] [Google Scholar]
- 35.Cao W, Yang W, Fan R, Li H, Jiang J, Geng M, Jin Y, Wu Y. miR-34a regulates cisplatin-induce gastric cancer cell death by modulating PI3K/AKT/survivin pathway. Tumour Biol. 2014;35:1287–95. doi: 10.1007/s13277-013-1171-7. [DOI] [PubMed] [Google Scholar]
- 36.Shen J, Niu W, Zhou M, Zhang H, Ma J, Wang L, Zhang H. MicroRNA-410 Suppresses Migration and Invasion by Targeting MDM2 in Gastric Cancer. PLoS One. 2014;9:e104510. doi: 10.1371/journal.pone.0104510. [DOI] [PMC free article] [PubMed] [Google Scholar] [Retracted]


