

Abstract
Objective: The purpose of this study was to evaluate the diagnostic efficiency of colorectal carcinoma (CRC) with the tumor markers Carcinoembryonic Antigen (CEA) and Carbohydrate Antigen 19-9 (CA 19-9), in addition to investigating whether CA 19-9 can be used to screen the disease process in patients with CRC who had no elevation of CEA levels. Methods: Serum levels of CEA and CA 19-9 were measured in: 138 patients with CRC; 111 patients with benign colorectal diseases. The diagnostic value was performed using the logistic regression equation and receiver operating characteristic curves (ROC). Results: The serum levels of CEA and CA 19-9 in the patients with CRC were significantly higher than those in the patients with benign colorectal diseases (P < 0.001). Receiver operating characteristic curves (ROC) in the patients with CRC versus those with benign colorectal disease yielded the optimal cut-off value of 3.36 ng/ml for CEA and 23.9 U/ml for CA 19-9, respectively. The area under ROC curve (AUC) was 0.789 for CEA, 0.690 for CA 19-9 and 0.900 for the combination of the two tumor markers. The combination resulted in a higher Youden index and a sensitivity of 85.3%. Conclusion: The combined detection of serum CEA and CA 19-9 could play a pivotal role in the diagnosis of CRC, and could drastically improve the sensitivity for the diagnosis of CRC. CA 19-9 might be a tumor biomarker in addition to CEA for CRC.
Keywords: Carcinoembryonic antigen, carbohydrate antigen 19-9, colorectal carcinoma, sensitivity, specificity
Introduction
Colorectal carcinoma (CRC) is one of the most frequent and deadly cancers in men and women worldwide [1]. In the United States, CRC is ranked third and ranks second to cancer of lung and bronchus cancer. It is estimated in 2015 that there will be 132,700 new cases and 49,700 deaths according to the United States Cancer Society [2]. It is widely recognized that CRC is curable if caught during the initial stage, as is so with many other cancers [3]. Thus, early diagnosis of CRC is of the utmost importance. Detection of a tumor marker is an effective and common approach to monitor CRC in that it is non-invasive, convenient and inexpensive with a high degree of accuracy.
Tumor markers are widely useful in the management of patients with tumors. CEA is a glycoprotein produced by columnar and goblet cells in the normal colon cells, as well as colonic cancer cells with a half life of 3-11 days [4]. It is commonly recommended that CEA should be most frequently detected when a case of gastrointestinal tract cancer is suspected [5]. The level of CEA more than 5 ng/ml is regarded as elevated [5]. CEA is elevated in most of the patients with CRC. CA 19-9 is present in gastrointestinal tract cancers. It is also a glycoprotein with high molecular weight, which may be detected, in human blood. CA 19-9 is utilized to diagnose pancreatic, gastric and colorectal cancer.
The aim of this retrospective study was to evaluate the diagnostic efficiency for CRC with the tumor markers CEA and CA199 and to investigate whether CA 19-9 can be used to screen the disease process in patients with CRC who had no elevation of CEA levels.
Materials and methods
Study population and blood sampling
We retrospectively analyzed the clinic pathologic data of patients with CRC and benign colorectal disorders at the Department of Oncology in affiliated Fuding Hospital, Fujian University of Traditional Chinese Medicine in China between January 2012 and December 2014. They included a group of 138 patients with CRC and a group of 111 patients with benign colorectal diseases. There were 80 males and 58 females with a mean age of 58.7 ± 11.3 years (range 30 to 84) in CRC group, 58 males and 47 females with a mean age of 56.9 ± 12.6 years (range 31 to 80) in benign colorectal disease group, respectively (Table 1).
Table 1.
Clinical parameters of CRC group and benign colorectal disease group [case (%)]
| Items | CRC group | Benign disease group | t/x2 | P-value |
|---|---|---|---|---|
|
| ||||
| (n = 138) | (n = 111) | |||
| Mean age (year) (range) | 58.7 ± 11.3 (30-84) | 56.9 ± 12.6 (31-80) | 1.220 | 0.224 |
| Gender | 0.002 | 0.960 | ||
| Male | 80 (58.0) | 64 (57.7) | ||
| Female | 58 (42.0) | 47 (42.3) | ||
| Dukes’ staging | ||||
| A | 44 | |||
| B | 29 | |||
| C | 29 | |||
| D | 36 | |||
| Benign colorectal diseases | ||||
| Hyperplastic polyps | 41 | |||
| Diverticular disease | 11 | |||
| Tubular adenoma | 24 | |||
| Melanosis coli | 3 | |||
| Colitis | 9 | |||
| Mixed conditionsΔ | 23 | |||
mixed conditions defines that one patient had two or more benign colorectal diseases.
Diagnosis for CRC was based on clinical investigations, which included laboratory tests, along with endoscopy in selected cases. After surgery resection, two pathologists confirmed the diagnosis of CRC conducted histopathological examination of the tissue specimens. Exclusion criteria of the study protocol were an operative history of any cancers, having any cancers except CRC, being a smoker who might raise CEA levels according to an investigation [6], and having pancreatitis.
All blood samples were collected from patients after fasting overnight before treatment. The local Ethics Committees had approved this study.
Methods
All fresh serum samples extracted from the enrolled participants were shipped to clot for a period of twenty minutes at 37°C. Samples were then separated by centrifugation at 3,000 RPM for 15 minutes. The supernatant sera were collected and stored at -20°C until testing. The serum levels of the tested tumor markers were assayed by an electrochemiluminescence analyzer Elecsys 2010 with supporting reagents (Roche, German). Normal reference values of CEA and CA 19-9 were < 5.0 ng/ml [5] and < 37.0 U/ml [7], respectively.
Statistical analysis
Statistical analysis was conducted using the SPSS 22.0 software package. The two tumor markers concentration distribution of patients in CRC and benign colorectal disorder were carried out by means of Kolmogorov-Sminov test, calculating the tumor marker concentration and Median (P25 and P75).
Chi-square tests were performed for a comparison of tumor marker concentration levels among the different groups of subjects included. Comparison of continuous variables between the two groups was performed using the Mann-Whitney U-test. The receiver operating characteristic (ROC) curves, which correlated true-positive (sensitivity) and false-positive (1-specificity) rates, were constructed. The areas under the ROC curve (AUC) were calculated for each tumor marker as well. The statistical significance of differences after logistic regression between the two AUCs was also determined. Statistical analysis was conducted by logistic regression, analyzing diagnosis value of single and combined detection of the tested tumor markers for CRC. The ROC curve was displayed with SPSS 22.0. In all tests, statistical significance was considered at P value less than 0.05.
The patients with CRC were categorized into 4 subgroups on the basis of the elevations of CEA and CA 19-9: (1) No elevations in either CEA or CA 19-9 (CEA-/CA 19-9-); (2) increase in CEA only but without increase in CA 19-9 (CEA+/CA 19-9-); (3) increase in CA 19-9 only but without increase in CEA (CEA-/CA 19-9+); (4) increase both in CEA and CA 19-9 (CEA+/CA 19-9+). Differences in clinical attributes of CRC between these four subgroups were analyzed using chi-square text or Fischer’s exact test when appropriate.
Results
Study population
The present study was performed on a total of 249 patients with different colorectal diseases. Table 1 shows the major attributes of the subjects enrolled.
Tumor markers Kolmogorov-Sminov test
Statistical distribution of the two tumor markers was Kolmogorov-Sminov test with the result (Z = 0.385-0.407, P < 0.001) in CRC group and the result (Z = 0.168-0.278, P < 0.001) in benign colorectal disease group, which were non-normal distributed, and non-parametric tests were used in the following statistical analysis.
Tumor marker concentrations in patients
The concentrations of CEA and CA 19-9 were statistically different among the two groups (Z = -8.826--8.609, all P < 0.001). The levels of CEA and CA 19-9 were significantly higher in CRC group than those in benign colorectal disorder group (Table 2).
Table 2.
The mean concentrations of CEA and CA 19-9 in CRC group and benign colorectal disorder group [Median (P25-P75)]
| Group | N | CEA (ng/ml) | CA 19-9 (U/ml) |
|---|---|---|---|
| CRC | 138 | 5.60 (2.08-11.25) | 21.60 (11.45-46.00) |
| Benign colorectal disorder | 111 | 1.73 (1.17-2.45) | 13.00 (7.60-19.00) |
Mann-Whitney U test was carried out between the two groups: CEA (Z = -7.843, P < 0.001), CA 19-9 (Z = -5.159, P < 0.001).
Logistic regression and ROC curve in CRC group versus benign colorectal disease group
The receiver operating characteristic curves (ROC) for analysis of single CEA ,CA 19-9 and the combination in patients with CRC in comparison with patients with benign colorectal disease were constructed. The areas under the curves of the two tumor markers were: CEA: 0.789 (95% CI (confidence interval): 0.734-0.845, P < 0.001); CA 19-9: 0.690 (95% CI: 0.625-0.755, P < 0.001); the combination: 0.799 (95% CI: 0.744-0.854, P < 0.001). Logistic regression was used of calculating the logistic regression equation of the serum concentrations of CEA and CA 19-9. Logit (P) = -1.567 + 0.403 × CEA + 0.015 × CA 19-9. The model was founded with logistic regression, and the ROC curve was fitted through the PRE of the model (Figure 1). Among the AUCs of the two tumor markers with predicted probability connected with single tumor marker and logistic regression curve, when two tumor markers were tested separately, the AUC of CEA was higher than that of CA 19-9 (P < 0.05). Yet, the two tumor markers combined in the logistic regression model was the highest among the single tumor marker tested separately.
Figure 1.
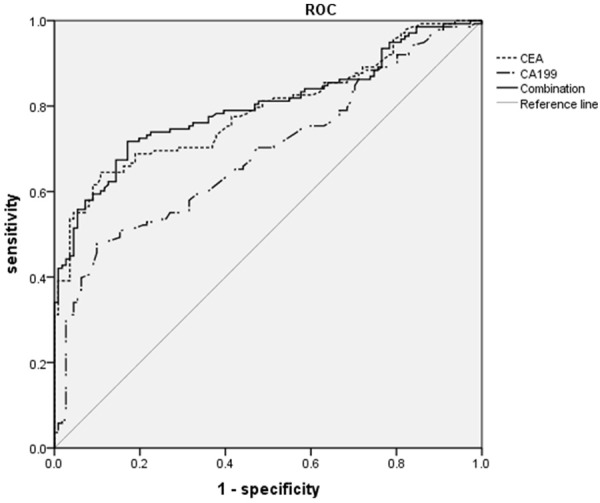
ROC curve comparing CEA and CA 19-9 levels in patients with CRC group versus patients with benign colorectal disease group. The curves show optimal cut-off value for CEA of 3.36 ng/ml and for CA 19-9 of 23.9 U/ml. The area under the ROC curve was 0.789 for CEA, 0.690 for CA 19-9 and 0.799 for the combination of the two tumor markers.
Tumor marker evaluation parameters
Sensitivity, specificity, Youden’s index (sensitivity + specificity-1) and diagnostic accuracy (Table 3) of CEA and CA 19-9 were calculated in accordance with the ROC curves and the logistic regression. Conjoint analysis: the sensitivity in combination was increased while the specificity was decreased in comparison with CEA and CA 19-9 alone evidently (Table 3).
Table 3.
The diagnosis efficiency of the conjoint analysis of tumor markers (CRC group versus benign colorectal disease group)
| Items | CEA | CA 19-9 | Combination |
|---|---|---|---|
| Optimal Cut-off | 3.36 ng/ml | 23.9 U/ml | - |
| Sensitivity (%) | 64.5 | 47.8 | 71.7 |
| Specificity (%) | 89.2 | 90.1 | 82.9 |
| Diagnostic accuracy (%) | 75.5 | 66.7 | 76.7 |
| Youden’s index (%) | 53.7 | 37.9 | 54.6 |
| SE | 0.028 | 0.033 | 0.028 |
| AUC (95% CI) | 0.789 (0.734-0.845) | 0.690 (0.625-0.755) | 0.799 (0.744-0.854) |
| Z-value# | 0.252 | 2.519 | - |
| P-value# | > 0.05 | < 0.05 | - |
comparing the area under ROC curve of combination to single tumor marker in CRC versus benign colorectal disease.
SE, standard error. AUC, area under the receiver operating characteristic. CI, confidence interval.
Attributes of four subgroups of CRC
The results of the four subgroups were shown in Figure 2 and Table 4. There was no difference of location of the primary cancer between the four subgroups of the patients with CRC. On the other hand, the patients with an advanced stage (Dukes’ Stage D) CRC were associated with an elevated levels of both tumor marker (CEA+/CA 19-9+) (Table 4).
Figure 2.
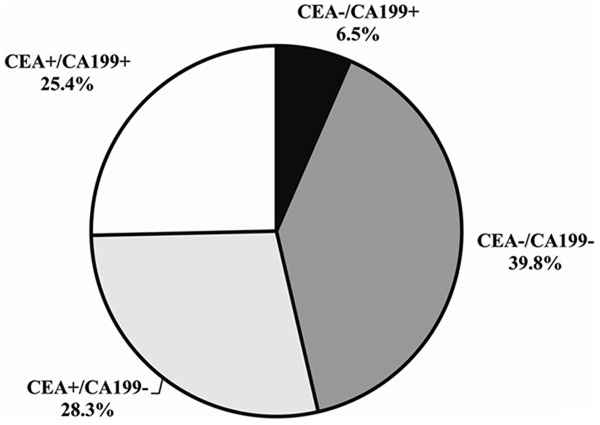
Results of the four subgroups during the course of CRC Abbreviations: CA, Carcinoma Antigen. CEA, Carcinoembryonic Antigen.
Table 4.
Clinical attributes of the four subgroups of CRC (n = 138)
| Attribute | CEA-/CA 19-9- | CEA-/CA 19-9+ | CEA+/CA 19-9- | CEA+/CA 19-9+ | P value |
|---|---|---|---|---|---|
| N | 55 | 9 | 39 | 35 | |
| Male sex | 32 | 6 | 18 | 24 | 0.248 |
| Location of primary cancer | 0.855 | ||||
| Colon | 45 | 7 | 31 | 30 | |
| Rectum | 10 | 2 | 8 | 5 | |
| Dukes classification | < 0.001 | ||||
| A | 25 | 4 | 12 | 3 | |
| B | 13 | 1 | 11 | 4 | |
| C | 12 | 2 | 10 | 5 | |
| D | 5 | 2 | 6 | 23 |
Discussion
The present study showed that the concentrations of CEA and CA 19-9 were significantly higher in patients with CRC than those with benign colorectal disease (Table 2). The ROC curve (Figure 1) of CEA in comparison with CRC versus benign colorectal disease yielded its sensitivity of 64.5%, high specificity of 89.2% and diagnostic accuracy of 75.5%. This meant that about 35% of the studied patients were negative for CRC. The sensitivity obtained from the ROC curves of circulating CEA and CA 19-9 (using the optimal cut-off values of 3.36 ng/ml and 23.9 U/ml, respectively) were 64.5% and 47.8% (Table 3). These levels were similar to those reported by Al-Shuneigat JM et al. [4], who gave a sensitivity of 56.2% for CEA and 36.4% for CA 19-9, their cut-off values of 3.56 ng/ml and 28 U/ml respectively. Whereas, the simultaneous determination of the two tested tumor biomarkers increased the sensitivity gradually up to 71.7%. The simultaneous sensitivity of 71.7% was the highest among the two tumor biomarkers alone. In a word, CA 19-9 was less sensitive than CEA in the diagnosis of CRC [4,8]. Simultaneous assessment of CA 19-9 and CEA might increase diagnostic sensitivity in CRC recognition [5].
In the current study, CEA can provide a better discrimination between patients in the two included groups than CA 19-9 (the areas under the ROC curve (AUC) were 0.789 and 0.690 for CEA and CA 19-9, respectively). The results were somewhat in agreement with LEE JH et al. [9], who reported the AUC of 0.84 for CEA and 0.74 for CA 19-9. The AUC in combination was 0.799. Table 3 showed the AUC of the combined tumor biomarkers was significantly larger than that of CA 19-9 (P < 0.05), while there is no significant difference of the AUC in combination as compared to that of CEA (P > 0.05). This suggested that CEA and CA 19-9 should be conducted simultaneously at diagnosis of CRC in order to obtain a reliable detection of CRC.
Although the tumor markers of CEA, CA 19-9 are widely used currently in diagnosing, staging and screening for CRC, all of them have low diagnostic sensitivity and positive rates [3,4,10]. In this study, 46.3% of the patients with CRC had no increase in CEA level and 68.2% had no increase in CA 19-9 level. As showed in Figure 2, 6.5% of the patients with CRC, without an elevated level of CEA, had an elevated CA 19-9 level (CEA-/CA 19-9+). This was in line with Stiksma et al. [11], who showed that 7.3% of patients with CRC had increased levels of only CA 19-9. Of all patients with CRC 25.4% had both elevated levels of the two tested tumor markers (CEA+/CA 19-9+). 39.8% of the enrolled patients did not have elevated levels of either CEA or CA 19-9 (CEA-/CA 19-9-). Hence, CA 19-9 might be a tumor biomarker in addition to CEA for CRC and might be used to screen the CRC process in people with colorectal cancer without an increase in CEA level [11].
In all, the combined detection of serum CEA and CA 19-9 could play a complementary role in the diagnosis of CRC, and could significantly improve the sensitivity for the diagnosis of CRC. CA 19-9 might be a tumor biomarker in addition to CEA for CRC.
Disclosure of conflict of interest
None.
References
- 1.Chan CC, Fan CW, Kuo YB, Chen YH, Chang PY, Chen KT, Hung RP, Chan EC. Multiple serological biomarkers for colorectal cancer detection. Int J Cancer. 2010;126:1683–90. doi: 10.1002/ijc.24912. [DOI] [PubMed] [Google Scholar]
- 2.Siegel RL, Miller KD, Jemal A. Cancer statistics, 2015. CA Cancer J Clin. 2015;65:5–29. doi: 10.3322/caac.21254. [DOI] [PubMed] [Google Scholar]
- 3.Levin TR, Jamieson L, Burley DA, Reyes J, Oehrli M, Caldwell C. Organized Colorectal Cancer Screening in Integrated Health Care Systems. Epidemiol Rev. 2011;33:101–10. doi: 10.1093/epirev/mxr007. [DOI] [PubMed] [Google Scholar]
- 4.Al-Shuneigat JM, Mahgoub SS, Huq F. Colorectal carcinoma: nucleosomes, carcinoembryonic antigen and ca 19-9 as apoptotic markers; a comparative study. J Biomed Sci. 2011;18:50. doi: 10.1186/1423-0127-18-50. [DOI] [PMC free article] [PubMed] [Google Scholar]
- 5.Swiderska M, Choromańska B, Dąbrowska E, Konarzewska-Duchnowska E, Choromańska K, Szczurko G, Myśliwiec P, Dadan J, Ladny JR, Zwierz K. The diagnostics of colorectal cancer. Contemp Oncol (Pozn) 2014;18:1–6. doi: 10.5114/wo.2013.39995. [DOI] [PMC free article] [PubMed] [Google Scholar]
- 6.Sajid KM, Parveen R, Durr-e-Sabih , Chaouachi K, Naeem A, Mahmood R, Shamim R. Carcinoembryonic antigen (CEA) levels in hookah smokers, cigarette smokers and non-smokers. J Pak Med Assoc. 2007;57:595–9. [PubMed] [Google Scholar]
- 7.Del Villano BC, Brennan S, Brock P, Bucher C, Liu V, McClure M, Rake B, Space S, Westrick B, Schoemaker H, Zurawski VR Jr. Radioimmunometric assay for a monoclonal antibody-defined tumor marker, CA 19-9. Clin Chem. 1983;29:549–52. [PubMed] [Google Scholar]
- 8.Levin B, Lieberman DA, McFarland B, Smith RA, Brooks D, Andrews KS, Brooks D, Bond J, Dash C, Giardiello FM, Glick S, Johnson D, Johnson CD, Levin TR, Pickhardt PJ, Rex DK, Smith RA, Thorson A, Winawer SJ. Screening and surveillance for the early detection of colorectal cancer and adenomatous polyps, 2008: a joint guideline from the American Cancer Society, the US Multi-Society Task Force on Colorectal Cancer, and the American College of Radiology. CA Cancer J Clin. 2008;58:130–60. doi: 10.3322/CA.2007.0018. [DOI] [PubMed] [Google Scholar]
- 9.Lee JH. Clinical Usefulness of Serum CYFRA 21-1 in Patients with Colorectal Cancer. Nucl Med Mol Imaging. 2013;47:181–7. doi: 10.1007/s13139-013-0218-4. [DOI] [PMC free article] [PubMed] [Google Scholar]
- 10.Zheng CX, Zhan WH, Zhao JZ, Zheng D, Wang DP, He YL, Zheng ZQ. The prognostic value of preoperative serum levels. World J Gastroenterol. 2001;7:431–4. doi: 10.3748/wjg.v7.i3.431. [DOI] [PMC free article] [PubMed] [Google Scholar]
- 11.Stiksma J, Grootendorst DC, van der Linden PW. CA 19-9 As a Marker in Addition to CEA to Monitor Colorectal Cancer. Clin Colorectal Cancer. 2014;13:239–44. doi: 10.1016/j.clcc.2014.09.004. [DOI] [PubMed] [Google Scholar]