

Abstract
As a negative regulatory molecule, T-cell immunoglobulin–and mucin domain-3 (Tim-3) plays a crucial role in the tumor immunological tolerance. In the present study, we aimed to determine the Tim-3 expression in gastric cancer tissue and its relationship with clinicopathological parameters and prognosis. The Tim-3 expression was assessed in 52 gastric cancer specimens and 15 gastritis tissues by flow cytometry, and gastritis tissues served as the control. As a result, we found that the Tim-3 expressions on CD4+T cells and CD8+T cells in gastric cancer tissue was significantly higher than those in gastritis tissue (P=0.022, P=0.047, respectively). The median expression level of Tim-3 on CD4+T cells were significantly correlated with clinicopathological parameters, such as tumor size, lymph node metastasis, the depth of tumor invasion and TNM staging (P=0.042, P=0.026, P=0.001, P=0.003, respectively), while it was not correlated with sex, age and histological subtype (all P>0.05). In CD8+T cells, the Tim-3 expression was relevant to tumor invasion and TNM staging (P=0.035, P=0.017, respectively), while it was irrelevant to other clinicopathological parameters (all P>0.05). Additionally, Kaplan-Meier survival curves showed that the median overall survival time of patients with lower Tim-3 expression was greater than that of patients with higher Tim-3 expression in CD4+T cells and CD8+T cells (χ2=18.036, P<0.001 and χ2=18.036, P<0.001, respectively). Moreover, the multivariate analysis revealed that the Tim-3 expression and TNM stage were independent prognostic factors for gastric cancer patients (P=0.029, P=0.043 and P=0.003, respectively). These results suggest that Tim-3 played an important role in the development and progression of gastric cancer, and it could be used as an independent prognostic factor for gastric cancer patients.
Keywords: T-cell immunoglobulin-and mucin domain-3 (Tim-3), flow cytometry, gastric cancer, prognosis
Introduction
Gastric cancer is one of the most common types of cancer worldwide in terms of incidence and mortality [1]. China is the country with the highest morbidity of gastric cancer, seriously threatening the public health. Although standardized operational technology and diversified therapies have been constantly improved, the survival rate and life quality of gastric cancer patients remain poor. Therefore, it is very urgent to seek new indicators for gastric cancer prognosis and effective therapies.
T-cell immunoglobulin-and mucin domain-3 (Tim-3) was primarily defined as the specific expression in Th1 cells. At present, the Tim-3 expression can be detected in CD8+T cells, Treg, dendritic cells (DC), Th17, natural killer (NK) cells, melanoma, monocytes, mast cells, lung cancer cells and other lymphocyte subpopulations [2-8]. In recent years, Tim-3 was regarded as a negative regulatory molecule, which plays a crucial role in anti-tumor immunity. However, its anti-tumor mechanism remains unknown. In the present study, we investigated the Tim-3 expression of 52 gastric cancer and 15 gastritis specimens by flow cytometry. We aimed to determine the Tim-3 expression in gastric cancer tissue and its relationship with clinicopathological parameters and prognosis.
Materials and methods
Selection of patients
A total of 52 gastric cancer specimens were collected in Gastrointestinal Surgery Department of the Third Affiliated Hospital of Soochow University (Jiangsu Province, China) from Oct. 2010 to Nov. 2011, and all of them were postoperatively pathologically diagnosed. Among these collected specimens, 41 were males and 11 were females. The median age of patients was 64.5 years old, ranging from 33 to 82 years old. All patients did not receive chemotherapy and other therapies before operation. In addition, 15 gastritis specimens, including 5 males and 10 females with a median age of 45 years old, were obtained from the medical outpatients at the Third Affiliated Hospital of Soochow University during September, 2011. Written informed consent was obtained from all participants, and the study protocol was approved by the Ethics Committee of the Third Affiliated Hospital of Soochow University.
Reagents and instruments
Anti-human Tim-3 was purchased from R&D Systems (USA); anti-human CD4-FITC, anti-human CD8-FITC, isotype control IgG2a-PE and IgG1-FITC were obtained from Beckman Coulter (USA); and collagenase IV, type I DNA enzyme and hyaluronidase were supplied by Sigma Company (USA). Flow cytometric analysis was performed using EPICS XL flow cytometer of Beckman Coulter (USA).
Flow cytometry analysis
Fresh tissue was cut into pieces of 1 mm3 and then added into 50 mL RPMI-1640 medium. Tissue was digested with 0.1% collagenase IV, 0.002% type I DNA enzyme and 0.01% hyaluronidase at 37°C for 45 min. Subsequently, the tissue pieces were transferred to the steel mesh, and single cell suspensions were obtained through mechanical grinding. Tim-3-PE/CD4-FITC mAb, Tim-3-PE/CD8-FITC mAb and isotype control IgG2a-PE and IgG1-FITC were respectively added to the tubes containing cells. Other experimental procedures were carried out based on the instructions, and stained cells were then subjected to flow cytometry analysis.
Statistical analysis
All data were analyzed by the SPSS software package 13.0 (SPSS, Chicago, IL). Due to non-normal distribution, the Mann-Whitney U-test was used for comparison between groups. Survival time was defined as the time from the date of diagnosis to the date of death or the date of the last follow-up. Survival curves were analyzed using Kaplan-Meier curves, and survival differences were examined using the log-rank test. The COX model was performed to evaluate the prognosis factors for gastric cancer by the univariate and multivariate analysis. P-values less than 0.05 were considered as statistically significant.
Results
Expression of Tim-3 in the tissue of gastric cancer and gastritis
Our research shows that Tim-3 was expressed on the surface of the freshly isolated CD4+T cells and CD8+T cells. Figure 1 exhibits that the Tim-3 expression on CD4+T cells in gastric cancer tissue (median of 10.85% with a range from 2.10 to 33.6%) was significantly higher than that in gastritis (median of 6.40% with a range from 1.70 to 8.30%) (P=0.022). Similarly, the expression of Tim-3 on CD8+T cells in gastric cancer tissue (median of 7.10% with a range from 0.80 to 27.10%) was also significantly increased compared with gastritis (median of 4.40% with a range from 0.50 to 10.50%) (P=0.047).
Figure 1.
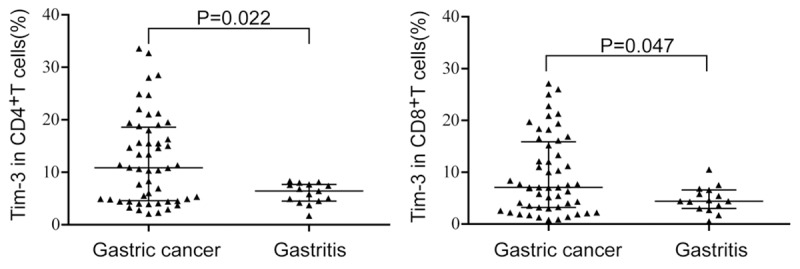
Percentage of Tim-3 expression on CD4+T cells and CD8+T cells in gastric cancer and gastritis patients.
The relationship between the Tim-3 expression and clinicopathological features in gastric cancer patients
The Tim-3 expression was correlated with clinicopathologic characteristics, such as sex, age, tumor size, histological type, lymph node metastasis, the depth of tumor invasion and TNM staging (Table 1). We found that the median expression level of Tim-3 on CD4+T cells was significantly correlated with clinicopathological parameters, including tumor size, lymph node metastasis, the depth of tumor invasion and TNM staging (P=0.042, P=0.026, P=0.001, P=0.003, respectively), while it was not correlated with sex, age and histological subtype (all P>0.05). In CD8+T cells, the Tim-3 expression was relevant to tumor invasion and TNM staging (P=0.035, P=0.017, respectively), while it was irrelevant to other clinicopathological parameters (all P>0.05).
Table 1.
The Correlation between the Tim-3 expression and clinic pathological features of patients
| Characteristics | N | Tim-3+CD4+T cells | Tim-3+CD8+T cells | ||||
|---|---|---|---|---|---|---|---|
|
|
|
||||||
| Median (range) | Z | P | Median (range) | Z | P | ||
| Sex | 1.188 | 0.235 | 0.571 | 0.568 | |||
| Female | 11 | 16.30 (2.90-22.00) | 7.10 (2.10-27.10) | ||||
| Male | 41 | 10.40 (2.10-33.60) | 7.10 (0.80-25.00) | ||||
| Age | 0.188 | 0.851 | 1.289 | 0.198 | |||
| ≤60 | 20 | 10.15 (2.10-33.60) | 5.60 (1.30-20.90) | ||||
| >60 | 32 | 10.85 (2.30-28.50) | 7.70 (0.80-27.10) | ||||
| Tumor Size | 2.036 | 0.042 | 1.916 | 0.055 | |||
| <5 cm | 29 | 6.90 (2.10-33.60) | 5.80 (0.80-27.10) | ||||
| ≥5 cm | 23 | 14.7 (2.30-28.50) | 11.00 (1.90-25.00) | ||||
| Histological Types | 0.165 | 0.869 | 0.348 | 0.728 | |||
| Differentiated | 26 | 10.45 (3.30-28.50) | 7.05 (0.80-27.10) | ||||
| Poorly Differentiated | 26 | 14.00 (2.10-33.60) | 7.40 (0.90-20.90) | ||||
| Invasion | 3.191 | 0.001 | 2.013 | 0.035 | |||
| No | 13 | 4.80 (2.80-13.40) | 4.10 (0.90-26.00) | ||||
| Yes | 39 | 14.70 (2.10-33.60) | 8.40 (1.80-27.10) | ||||
| Lymph node metastasis | 2.232 | 0.026 | 1.945 | 0.052 | |||
| No | 22 | 7.15 (2.10-28.00) | 5.60 (0.90-27.10) | ||||
| Yes | 30 | 15.25 (2.30-33.60) | 11.10 (0.80-25.00) | ||||
| TNM Staging | 2.992 | 0.003 | 2.390 | 0.017 | |||
| I+II | 23 | 5.75 (2.10-28.00) | 5.30 (0.90-27.10) | ||||
| III+IV | 29 | 15.50 (2.30-33.60) | 11.60 (0.80-25.00) | ||||
The relationship between the Tim-3 expression and prognosis
Further analysis revealed that there was a significant correlation between the survival time of gastric patients and the Tim-3 expression level. In CD4+T cells and CD8+T cells, the median overall survival time of patients with lower Tim-3 expression was greater compared with patients with higher Tim-3 expression (χ2=18.036, P<0.001 and χ2=18.036, P<0.001, respectively) (Figure 2). Table 2 shows that the tumor size, TNM staging and Tim-3 expression were significantly related to overall survival time (P=0.026, P<0.001 and P<0.001, respectively). With the adjustment of such factors, sex, age, tumor size and TNM staging, the multivariate analysis revealed that the death risk of patients with higher Tim-3 expression was significantly greater than those with lower Tim-3 expression (P=0.029 and P=0.043 for CD4+T cells and CD8+T cells, respectively). All these data indicated that the Tim-3 expression was an independent prognostic factor for patients with gastric cancer. Moreover, the TNM staging was also positively correlated with the death risk of gastric patients (P=0.003).
Figure 2.
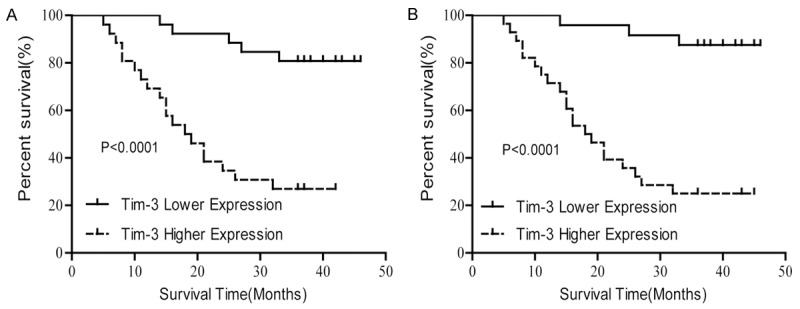
Patients with higher Tim-3 levels had a significantly lower survival rate compared with those with lower Tim-3 levels. A. The Tim-3 expression on CD4+T cells. B. The Tim-3 expression on CD8+T cells. P-Values are shown.
Table 2.
Univariate and multivariate analyses of overall survival in patients
| Clinicopathological parameters | Comparison reference | Univariate analysis | Multivariate analysis | ||
|---|---|---|---|---|---|
|
|
|
||||
| Hazard ratio (95% CI) | P value | Hazard ratio (95% CI) | P value | ||
| Tim-3 expression in CD4+T cells | Low/High | 0.153 (0.057-0.413) | <0.001 | 0.252 (0.073-0.871) | 0.029 |
| Tim-3 expression in CD8+T cells | Low/High | 0.094 (0.028-0.320) | <0.001 | 0.219 (0.050-0.950) | 0.043 |
| Gender | Female/Male | 0.957 (0.357-2.564) | 0.930 | 0.514 (0.149-1.767) | 0.291 |
| Age | <60/≥60 | 0.771 (0.330-1.803) | 0.548 | 1.680 (0.588-4.802) | 0.333 |
| Tumor size | <5 cm/≥5 cm | 0.389 (0.170-0.894) | 0.026 | 1.393 (0.514-3.777) | 0.515 |
| TNM stage | I, II/III, IV | 0.071 (0.017-0.306) | <0.001 | 0.092 (0.019-0.439) | 0.003 |
Discussion
Tim-3 refers to the membrane molecules expressed by the sub-category of some T cells. Previous studies showed that it can adjust the immune response of Th1 cells and mediate the cell immune tolerance [9,10]. Tim-3 also plays an essential role in autoimmune diseases, anaphylactic diseases, immune tolerance and even anti-tumor immunity [11-13]. When Tim-3 is interacted with its ligand, galectin-9, the Th1 responses is a blockade by negatively regulating IFN gamma secretion [10,14]. Gao et al. [15] reported that Tim-3 plays a significant role in tumor progression by maintaining the tumor immunosuppressive environment via regulatory T cells. Many recent studies indicated that Tim-3 is expressed in many types of tumor tissues, including lung cancer [3], gastric cancer [8], prostate cancer [16], ovarian cancer [17], cervical cancer [7], glioma [18], acute myeloid leukemia [19] and so on. In the present study, we investigated the Tim-3 expression on CD4+T cells and CD8+T cells of gastric cancer and gastritis tissues by flow cytometry. However, the Tim-3 expression in gastric caner tissue was distinctly higher than that in chronic gastritis tissue, suggesting that Tim-3 was involved in the pathogenesis of gastric cancer via its regulation on various immune cells.
The interaction between Tim-3 and its ligand, galectin-9, plays a negative regulatory role in the immune response mediated by Th1 cells [20]. It has been reported that the Tim-3 expression in the vascular endothelial cells can activate the interleukin-6-STAT3 pathway, leading to suppressed activation of CD4+T cells [21]. In this study, we found that the Tim-3 expression on CD4+T cells was significantly correlated with tumor size, lymph node metastasis, the depth of tumor invasion and TNM staging. Our results indicated that the Tim-3 expression could be used as a marker for the development and progression of gastric cancer by regulating CD4+T-cell subsets.
It is well known that CD8+T cells play an important role in the tumor microenvironment. Fourcade et al. [22] discovered that Tim-3 was expressed on NY-ESO-1-specific CD8+T cells in patients with advanced melanoma. They found that the blockade of both Tim-3 and PD-1 pathways can reverse tumor-induced T cell exhaustion in patients with advanced melanoma. Our results revealed that the Tim-3 expression on CD8+T cells was relevant to tumor invasion and TNM staging, which might be due to Tim-3-induced T cell exhaustion, resulting in the tumor occurrence.
Recent reports suggested that the higher expression of Tim-3 was negatively correlated with the survival time of cancer patients [3,7,8]. Our work clearly exhibited a correlation between the Tim-3 expression and survival rate of gastric cancer patients. The multivariate analysis revealed that the death risk of patients with higher Tim-3 expression was significantly greater than that of patients with lower Tim-3 expression. Our findings were in agreement with previous reports showing that the Tim-3 expression could be used as an independent prognostic factor for gastric cancer patients.
Kaori et al. [23] reported that the co-expression of Tim-3 and PD-1 can be found in the tumor infiltrating lymphocytes of the solid tumor in mice. The multi-targeted therapy of Tim-3 and PD-1 has a high vitality in controlling the tumor growth. Our work revealed that the Tim-3 expression in gastric cancer tissue was negatively correlated with clinicopathological parameters. Moreover, Our previous study indicated that as a negative regulatory molecule, PD-L1 is distinctly expressed in the gastric cancer tissue [24]. However, the underlying mechanism remains unclear. Therefore, further research should be performed on the multi-targeted therapy of Tim-3 and PD-1 for the treatment of gastric cancer.
In summary, our study showed that the Tim-3 expression was up-regulated on CD4+T cells and CD8+T cells in fresh tissue in gastric cancer. In addition, the Tim-3 expression on CD4+T cells and CD8+T cells was closely correlated with clinicopathological parameters. Our results suggested that Tim-3 was an independent prognostic factor for gastric cancer patients. However, further studies are required to understand the underlying mechanism on how Tim-3 affects the development and progression of gastric cancer.
Acknowledgements
This research project was supported by the National Natural Science Foundation of China (NSFC) (81171653, 30972703, 81302047, 81301960, 81301223) and Natural Science Foundation of Jiangsu Province (BK2011246, BK2011247, BK201340325).
Disclosure of conflict of interest
None.
References
- 1.Hartgrink HH, Jansen EP, van Grieken NC, van de Velde CJ. Gastric cancer. Lancet. 2009;374:477–490. doi: 10.1016/S0140-6736(09)60617-6. [DOI] [PMC free article] [PubMed] [Google Scholar]
- 2.Wiener Z, Kohalmi B, Pocza P, Jeager J, Tolgyesi G, Toth S, Gorbe E, Papp Z, Falus A. TIM-3 is expressed in melanoma cells and is upregulated in TGF-beta stimulated mast cells. J Invest Dermatol. 2007;127:906–914. doi: 10.1038/sj.jid.5700616. [DOI] [PubMed] [Google Scholar]
- 3.Zhuang X, Zhang X, Xia X, Zhang C, Liang X, Gao L, Ma C. Ectopic expression of TIM-3 in lung cancers: a potential independent prognostic factor for patients with NSCLC. Am J Clin Pathol. 2012;137:978–985. doi: 10.1309/AJCP9Q6OVLVSHTMY. [DOI] [PubMed] [Google Scholar]
- 4.Yan J, Zhang Y, Zhang JP, Liang J, Li L, Zheng L. Tim-3 expression defines regulatory T cells in human tumors. PLoS One. 2013;8:e58006. doi: 10.1371/journal.pone.0058006. [DOI] [PMC free article] [PubMed] [Google Scholar]
- 5.Nakayama M, Akiba H, Takeda K, Kojima Y, Hashiguchi M, Azuma M, Yagita H, Okumura K. Tim-3 mediates phagocytosis of apoptotic cells and cross-presentation. Blood. 2009;113:3821–3830. doi: 10.1182/blood-2008-10-185884. [DOI] [PubMed] [Google Scholar]
- 6.Anderson AC, Anderson DE, Bregoli L, Hastings WD, Kassam N, Lei C, Chandwaskar R, Karman J, Su EW, Hirashima M, Bruce JN, Kane LP, Kuchroo VK, Hafler DA. Promotion of tissue inflammation by the immune receptor Tim-3 expressed on innate immune cells. Science. 2007;318:1141–1143. doi: 10.1126/science.1148536. [DOI] [PubMed] [Google Scholar]
- 7.Cao Y, Zhou X, Huang X, Li Q, Gao L, Jiang L, Huang M, Zhou J. Tim-3 expression in cervical cancer promotes tumor metastasis. PLoS One. 2013;8:e53834. doi: 10.1371/journal.pone.0053834. [DOI] [PMC free article] [PubMed] [Google Scholar] [Retracted]
- 8.Jiang J, Jin MS, Kong F, Cao D, Ma HX, Jia Z, Wang YP, Suo J, Cao X. Decreased galectin-9 and increased Tim-3 expression are related to poor prognosis in gastric cancer. PLoS One. 2013;8:e81799. doi: 10.1371/journal.pone.0081799. [DOI] [PMC free article] [PubMed] [Google Scholar]
- 9.Sanchez-Fueyo A, Tian J, Picarella D, Domenig C, Zheng XX, Sabatos CA, Manlongat N, Bender O, Kamradt T, Kuchroo VK, Gutierrez-Ramos JC, Coyle AJ, Strom TB. Tim-3 inhibits T helper type 1-mediated auto- and alloimmune responses and promotes immunological tolerance. Nat Immunol. 2003;4:1093–1101. doi: 10.1038/ni987. [DOI] [PubMed] [Google Scholar]
- 10.Sabatos CA, Chakravarti S, Cha E, Schubart A, Sanchez-Fueyo A, Zheng XX, Coyle AJ, Strom TB, Freeman GJ, Kuchroo VK. Interaction of Tim-3 and Tim-3 ligand regulates T helper type 1 responses and induction of peripheral tolerance. Nat Immunol. 2003;4:1102–1110. doi: 10.1038/ni988. [DOI] [PubMed] [Google Scholar]
- 11.Simmons WJ, Koneru M, Mohindru M, Thomas R, Cutro S, Singh P, Dekruyff RH, Inghirami G, Coyle AJ, Kim BS, Ponzio NM. Tim-3+ T-bet+ tumor-specific Th1 cells colocalize with and inhibit development and growth of murine neoplasms. J Immunol. 2005;174:1405–1415. doi: 10.4049/jimmunol.174.3.1405. [DOI] [PubMed] [Google Scholar]
- 12.Hu WK, Lu XX, Yang S, Xu GP, Lan F, Chen SX, Ni W, Xiong WN, Xiong SD. Expression of the Th1-specific cell-surface protein Tim-3 increases in a murine model of atopic asthma. J Asthma. 2009;46:872–877. doi: 10.3109/02770900903199953. [DOI] [PubMed] [Google Scholar]
- 13.Wu QW, Cai PC, Wang L, Li YR, Kong LL, Hu LH. Family-based association study of Tim-1 and Tim-3 gene polymorphisms with childhood asthma in Chinese trios. Int Arch Allergy Immunol. 2009;150:252–260. doi: 10.1159/000222677. [DOI] [PubMed] [Google Scholar]
- 14.Geng H, Zhang GM, Li D, Zhang H, Yuan Y, Zhu HG, Xiao H, Han LF, Feng ZH. Soluble form of T cell Ig mucin 3 is an inhibitory molecule in T cell-mediated immune response. J Immunol. 2006;176:1411–1420. doi: 10.4049/jimmunol.176.3.1411. [DOI] [PubMed] [Google Scholar]
- 15.Gao X, Zhu Y, Li G, Huang H, Zhang G, Wang F, Sun J, Yang Q, Zhang X, Lu B. TIM-3 expression characterizes regulatory T cells in tumor tissues and is associated with lung cancer progression. PLoS One. 2012;7:e30676. doi: 10.1371/journal.pone.0030676. [DOI] [PMC free article] [PubMed] [Google Scholar]
- 16.Piao YR, Jin ZH, Yuan KC, Jin XS. Analysis of Tim-3 as a therapeutic target in prostate cancer. Tumour Biol. 2014;35:11409–11414. doi: 10.1007/s13277-014-2464-1. [DOI] [PMC free article] [PubMed] [Google Scholar] [Retracted]
- 17.Wu J, Liu C, Qian S, Hou H. The expression of Tim-3 in peripheral blood of ovarian cancer. DNA Cell Biol. 2013;32:648–653. doi: 10.1089/dna.2013.2116. [DOI] [PubMed] [Google Scholar]
- 18.Han S, Feng S, Xu L, Shi W, Wang X, Wang H, Yu C, Dong T, Xu M, Liang G. Tim-3 on peripheral CD4(+) and CD8(+) T cells is involved in the development of glioma. DNA Cell Biol. 2014;33:245–250. doi: 10.1089/dna.2013.2306. [DOI] [PubMed] [Google Scholar]
- 19.Li C, Chen X, Yu X, Zhu Y, Ma C, Xia R, Ma J, Gu C, Ye L, Wu D. Tim-3 is highly expressed in T cells in acute myeloid leukemia and associated with clinicopathological prognostic stratification. Int J Clin Exp Pathol. 2014;7:6880–6888. [PMC free article] [PubMed] [Google Scholar]
- 20.Zhu C, Anderson AC, Schubart A, Xiong H, Imitola J, Khoury SJ, Zheng XX, Strom TB, Kuchroo VK. The Tim-3 ligand galectin-9 negatively regulates T helper type 1 immunity. Nat Immunol. 2005;6:1245–1252. doi: 10.1038/ni1271. [DOI] [PubMed] [Google Scholar]
- 21.Huang X, Bai X, Cao Y, Wu J, Huang M, Tang D, Tao S, Zhu T, Liu Y, Yang Y, Zhou X, Zhao Y, Wu M, Wei J, Wang D, Xu G, Wang S, Ma D, Zhou J. Lymphoma endothelium preferentially expresses Tim-3 and facilitates the progression of lymphoma by mediating immune evasion. J Exp Med. 2010;207:505–520. doi: 10.1084/jem.20090397. [DOI] [PMC free article] [PubMed] [Google Scholar]
- 22.Fourcade J, Sun Z, Benallaoua M, Guillaume P, Luescher IF, Sander C, Kirkwood JM, Kuchroo V, Zarour HM. Upregulation of Tim-3 and PD-1 expression is associated with tumor antigen-specific CD8+T cell dysfunction in melanoma patients. J Exp Med. 2010;207:2175–2186. doi: 10.1084/jem.20100637. [DOI] [PMC free article] [PubMed] [Google Scholar]
- 23.Sakuishi K, Apetoh L, Sullivan JM, Blazar BR, Kuchroo VK, Anderson AC. Targeting Tim-3 and PD-1 pathways to reverse T cell exhaustion and restore anti-tumor immunity. J Exp Med. 2010;207:2187–2194. doi: 10.1084/jem.20100643. [DOI] [PMC free article] [PubMed] [Google Scholar]
- 24.Wu C, Zhu Y, Jiang J, Zhao J, Zhang XG, Xu N. Immunohistochemical localization of programmed death-1 ligand-1 (PD-L1) in gastric carcinoma and its clinical significance. Acta Histochem. 2006;108:19–24. doi: 10.1016/j.acthis.2006.01.003. [DOI] [PubMed] [Google Scholar]