Abstract
A 41-year-old man presented with the chief complaint of right hip pain that had persisted for 6 months. F18-fluorodeoxyglucose (FDG) positron emission tomography/computed tomography (PET/CT) imaging showed FDG accumulation in the right pubic bone. A bone biopsy specimen from the site revealed findings suggestive of a plasma cell tumor. Bone marrow examination and serum and urine immunofixation tests showed no abnormalities. Based on these findings, the patient was diagnosed as having non-secretory multiple myeloma. FDG accumulation in the right pubic bone diminished following four cycles of weekly bortezomib and concomitant dexamethasone therapy. Tandem autologous peripheral blood stem cell transplantation was performed, followed by monthly bortezomib/dexamethasone maintenance therapy. A further FDG-PET/CT scan 9 months after the start of therapy indicated that FDG accumulation in the right pubic bone had worsened. Consequently, the therapy was switched to twice-weekly bortezomib/dexamethasone as remission re-induction therapy. New FDG uptake in the right hip bone was noted after six cycles of the therapy, and plain X-ray examination revealed osteolytic changes. The patient was then administered eight cycles of combined lenalidomide-dexamethasone therapy, which resulted in a marked decrease of the FDG accumulation in the right pubic bone and disappearance of uptake in the right hip bone. There was radiographic evidence of bone formation at these sites. This is only the second reported case in which treatment with the immunomodulatory drug lenalidomide and concomitant dexamethasone has been found to induce bone formation.
Keywords: Lenalidomide, multiple myeloma, bone formation, sRANKL/OPG ratio, bortezomib
Introduction
Multiple myeloma (MM) is cancer of the plasma cells of the bone marrow, and most MM patients suffer from destructive osteolytic bone disease. A number of studies have reported the therapeutic efficacy of bortezomib for inducing bone formation in patients with MM [1-6], whereas it is generally thought that immunomodulatory drugs (IMiDs) have no osteogenetic effect [7-9]. In only two reported clinical cases, including the case described here, has treatment with the IMiDlenalidomide and concomitant dexamethasone (RD therapy) been found to induce bone formation [10]. In the previously reported case, bone formation was considered to be associated with elevation of osteogenesis biomarkers. In the present case, bone formation was considered to be associated with a decrease in bone resorption markers and depression of the serum receptor activator of nuclear factor-κb ligand (sRANKL)/osteoprotegerin (OPG) ratio; there was no elevation in the osteogenesis markers in the current case. Complex mechanisms are thought to be operative in the osteogenic response to RD therapy, and follow-up by ongoing periodic assays of various bone markers is apparently needed.
Case report
A 41-year-old man presented with the chief complaint of right hip pain of 6 months’ duration. The medical history and family history were unremarkable. Figure 1 indicates the patient’s clinical course.
Figure 1.
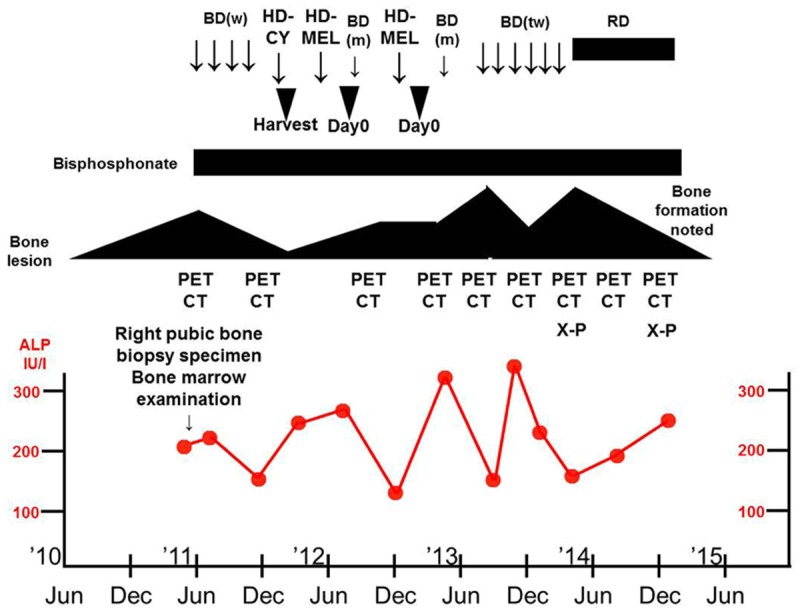
Clinical course showing improvement of the bone lesions and bone formation following treatment with lenalidomide/dexamethasone (RD). The changes in serum alkaline phosphatase (ALP) levels indicate normal range. BD (w), bortezomib/dexamethasone weekly; HD-CY, high dose cyclophosphamide; HD-MEL, high dose melphalan; BD (m), bortezomib/dexamethasone monthly; BD (tw), bortezomib/dexamethasone twice weekly; Day 0, autologous peripheral blood stem cell transplantation; PET CT, F18-fluorodeoxyglucose-positron emission tomography/computed tomography; X-P, plain X-ray imagining.
Diagnosis
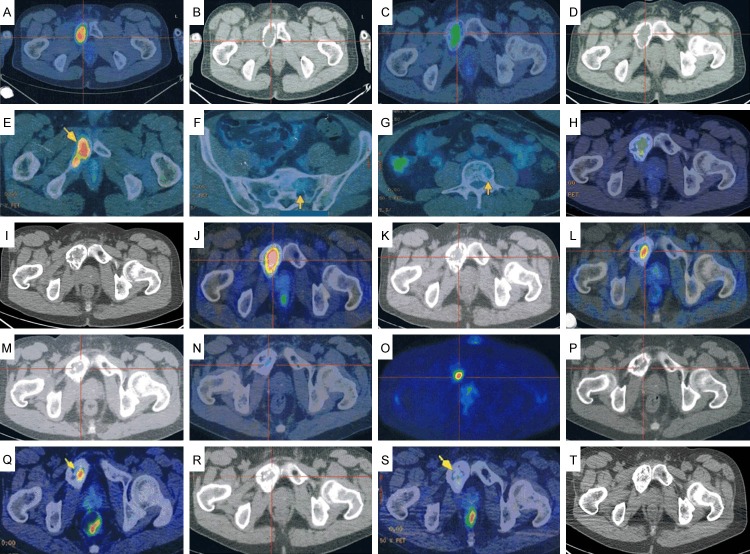
The right hip pain developed around December 2010 and gradually worsened; the patient sought medical advice at the orthopedic outpatient department of our hospital in June 2011. T1-weighted magnetic resonance imaging (MRI) of the hip joint showed a low-signal-intensity area in the right pubic bone extending from the upper to the lower limb (Figure 2A), and fat-saturation T2-weighted MRI showed inhomogeneous high-signal-intensity areas indicative of a tumorous lesion (Figure 2B). F18-fluorodeoxyglucose-positron emission tomography/computed tomography (FDG-PET/CT) (Figure 3A, 3B) showed bone expansion and thinning of the cortical bone from the right ischium to the pubic bone, with a high FDG uptake [maximum standardized uptake value (SUV max) = 9.2] in the soft tissues extending to the bone marrow. In July 2011, the patient was admitted to the orthopedic department of our hospital, and a right pubic bone biopsy revealed findings suggestive of a plasma cell tumor, IgGk type (Figure 4A-R). The patient was, therefore, transferred to the hematology department of our hospital.
Figure 2.
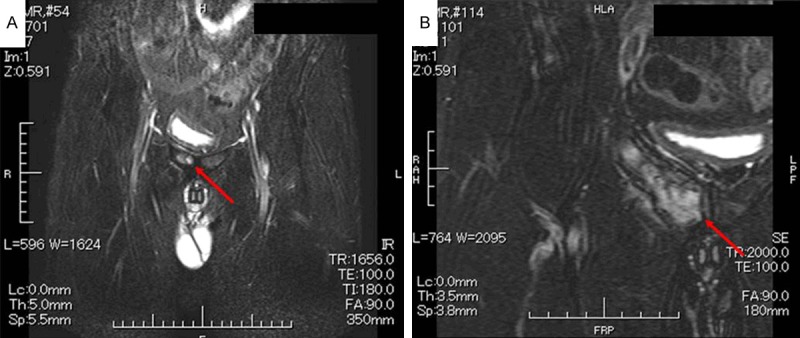
MRI of the hip joint. A: Low-signal-intensity area (red arrow) in the right pubic bone on T1-weighted image. B: Non-homogeneous high-signal-intensity area (red arrow) suggestive of a tumorous lesion on fat-saturation T2-weighted image.
Figure 3.
PET/CT images. A, B: Bone expansion and thinning of the cortical bone in the region extending from the right ischium to the pubic bone. High FDG uptake (SUV max = 9.2) is evident in the soft tissues extending into the bone marrow. C, D: Reduction in size of the tumorous lesion in the right pubic bone (SUV max = 5.5). E-G: Increased FDG accumulation in the right pubic-to-ischial lesions (arrow) (SUV max = 6.6) and new uptake in the sacrum and the first lumbar vertebra (arrows). H, I: The increased FDG accumulation in the right pubic-to-ischial lesions remains unchanged (SUV max = 6.6), whereas the uptake in the sacrum and first lumbar vertebra has decreased. J, K: Worsening of FDG accumulation in the right pubic-to-ischial lesions (SUV max = 9.4) and new uptake in the sternum and fourth lumbar vertebra (SUV max = 1.7). L, M: Diminished FDG accumulation in the right pubic bone lesion (SUV max = 5.0) and sternal lesion (SUV max = 1.4), and disappearance of uptake in the fourth lumbar vertebral lesion. N-P: FDG uptake unchanged in the right pubic bone lesion (SUV max = 4.9), but there is new uptake in the right hip bone (SUV max = 1.8). Q, R: No change in the FDG accumulation in the right pubic bone (arrow) (SUV max = 4.9), but accumulation in the right hip bone lesion has disappeared. S, T: Marked reduction in FDG accumulation in the right pubic bone (arrow) (SUV max = 2.6).
Figure 4.
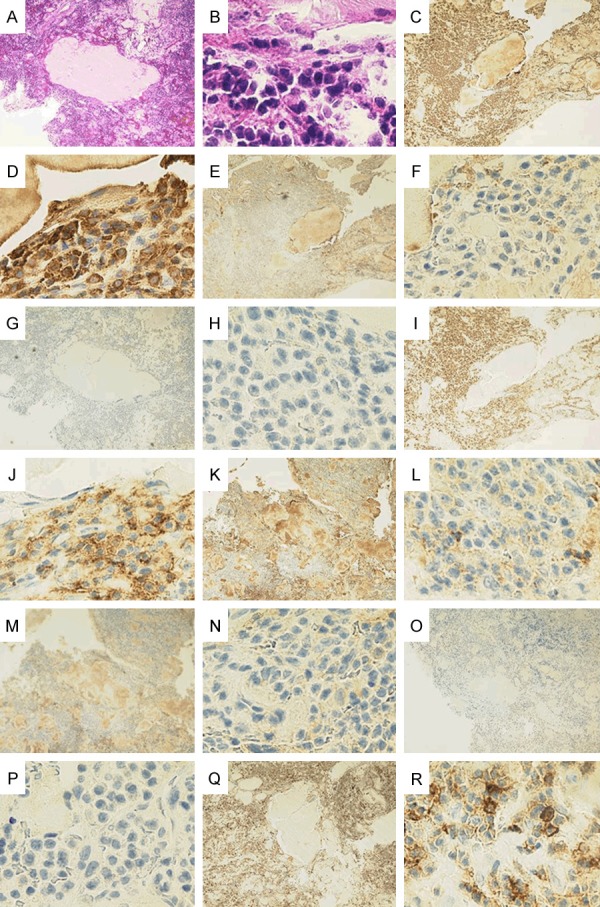
Pathologic findings of the right pubic bone tumor biopsy specimen. A: Sequesters are sporadically seen interposed with conspicuous plasma cell proliferative activity [hematoxylin and eosin stain (H&E), ×40]. B: (H&E, ×600); Conspicuous plasma cell proliferative activity is noted. C: (κ, ×40); positive. D: (κ, ×600); positive. E: (λ, ×40); negative. F: (λ, ×600); negative. G: (CD20, ×40); negative. H: (CD20, ×600); negative. I: (CD56, ×40); positive. J: (CD56, ×600); positive. K: (IgG, ×40); positive. L: (IgG, ×600); positive. M: (IgA, ×40); negative. N: (IgA, ×600); negative. O: (IgM, ×40); negative. P: (IgM, ×600); negative. Q: (CD45, ×40); positive. R: (CD45, ×600); positive.
The laboratory findings are shown in Table 1. The serum free κ/λ ratio was 0.543, which is within the reference range. No increase of the serum β2 microglobulin level (1.7 mg/dL) or decrease of the serum albumin level (4.0 g/dL) was observed. Serum and urine immunofixation tests showed no abnormalities (data not shown). Bone marrow examination did not reveal any increase in plasma cell proliferative activity (Figure 5A-C). Based on the above findings, the patient was diagnosed as having non-secretory MM (Durie and Salmon stage IIIA, International Staging System stage I).
Table 1.
Laboratory findings on admission
| Peripheral blood | |||
| WBC | 3300/μl | Neut | 54.2% |
| Ly | 34.2% | Mono | 6.0% |
| Eo | 2.5% | Ba | 0.6% |
| RBC | 428×104/μl | Hb | 13.3 g/dl ↓ |
| Ht | 40.5% | MCV | 94.7 fl |
| MCH | 31.1 pg | Plt | 24.9×10⁴/μl |
| Reti | 1.4% | ||
| Biochemistry | |||
| T.P. | 6.2 g/dl ↓ | Alb | 4.0 g/dl |
| AST | 20 IU/l | ALT | 34 IU/l |
| LDH | 140 IU/l | ALP | 220 IU/l |
| γ-GTP | 25 IU/l | T-Bil | 0.4 mg/dl |
| BUN | 19 mg/dl | Cr | 0.71 mg/dl ↓ |
| Uric acid | 4.9 mg/dl | CRP | 0.3 mg/dl |
| Bone biopsy specimen flow cytometry | |||
| CD19 | 20.3% ↑ | CD20 | 5.7% |
| CD33 | 4.3% | CD45 | 99.3% ↑ |
| CD49e | 4.1% | CD54 | 99.6% ↑ |
| CD56 | 99.4% ↑ | CD138 | 52.3% ↑ |
| MPC-1 | 100% ↑ | κ | 94.2% ↑ |
| λ | 5.7% | ||
| Bone marrow smear examination | |||
| Nucleated cells | 2.7×10⁴/μl ↓ | Megakaryocytes | 15/μl |
| M:E ratio | 2.14 | Plasma cells | 0.2% |
| Immunoserological analysis | |||
| IgG | 850 mg/dl ↓ | IgA | 107 mg/dl ↓ |
| IgM | 51 mg/dl | IgD | 2.5 mg/dl |
| Serum β2-MG | 1.7 mg/dl | Immunoelectrophoresis (specific antisera) | No significant M protein detected |
| Immunoelectrophoresis (urine) | No Bence-Jones protein detected | ANA | Negative |
| Bone marrow blood flow cytometry | |||
| CD19 | 15.6% | CD20 | 10.4% |
| CD33 | 14.1% | CD45 | 76.9% ↑ |
| CD49e | 12.9% | CD54 | 69.6% ↑ |
| CD56 | 67.1% ↑ | CD138 | 63.8% ↑ |
| MPC-1 | 68.7% ↑ | κ | 64.9% ↑ |
| λ | 11.9% | ||
| Tumor markers | |||
| AFP | 2.9 ng/ml | CEA | 1.6 ng/ml |
| CA19-9 | 4.1 U/ml | PSA | 1.131 ng/ml |
| sIL-2R | 186 U/ml | ||
Serum free κ/λ ratio was 0.543, which is within the reference range. Urinalysis revealed no abnormality. Serum and urine immunofixation tests showed no abnormalities. There were no abnormalities of the serum β2 microglobulin or albumin level. Bone marrow blood G-banding chromosome analysis: 46, XY 20/20. The amount of bone biopsy specimen was insufficient for G-banding chromosome analysis. WBC, white blood cells; Neut, neutrophils; Ly, lymphocytes; Mono, monocytes; Eo, eosinocytes; Ba, basophiles; RBC, red blood cells; Hb, hemoglobin; Ht, hematocrit; MCV, mean corpuscular cell volume; MCH, mean corpuscular cell hemoglobin; Plt, plate; Reti, reticulocytes; T.P., total protein; Alb, albumin; AST, aspartate aminotransferase; ALT, alanine aminotransferase; LDH, lactate dehydrogenase; ALP, alkaline phosphatase; γ-GTP, γ-guanosine triphosphate; T-Bil, total bilirubin; BUN, blood urea nitrogen; Cr, creatinine; CRP, C-reactive protein; CD, cluster of differentiation; M:E ratio, myeloid:erythroidratio; IgG, immunoglobulin G; IgA, immunoglobulin A; IgM, immunoglobulin M; IgD, immunoglobulin D; β2MG, β2-microglobulin; ANA, antinuclear antibody; AFP, α-fetoprotein; CEA, carcinoembryonic antigen; CA19-9, carbohydrate antigen 19-9; PSA, prostate specific antigen; sIL-2R, soluble interleukin-2 receptor;
higher than normal range;
lower than normal range.
Figure 5.

Bone marrow smear findings. A: (×40), B: (×100), C: (×400) Hypoplastic, but no evidence of cells showing overt atypia or cluster formation.
Therapy
Early in September 2011, the patient began weekly BD therapy (consisting of bortezomib 1.3 mg/m2 intravenously on days 1, 8, 15, and 22, followed by a 7-day washout period, and dexamethasone 20 mg/day orally on days 1, 2, 8, 9, 15, 16, 22, and 23, each cycle lasting for 5 weeks). The patient was also prescribed a bisphosphonate to be taken once a month along with the BD therapy. A repeat FDG-PET/CT (Figure 3C, 3D) after 4 cycles of weekly BD therapy demonstrated reduced FDG accumulation in the tumorous lesion in the right pubic bone (SUV max = 5.5).
In February 2012, autologous peripheral blood stem cells were collected (CD34-positive cell count: 13.5×10⁶/kg) using high-dose cyclophosphamide (2000 mg/m2 i.v. on days 1 and 2) in combination with granulocyte colony-stimulating factor, and in March, the first autologous peripheral blood stem cell transplantation (Auto-PBSCT) was performed with pretreatment comprising high-dose melphalan (200 mg/m2). Beginning in April 2012, the patient was given four cycles of weekly BD therapy (consisting of bortezomib 1.3 mg/m2 intravenously on day 1, followed by a 27-day washout period, and dexamethasone 20 mg/day orally on days 1 and 2, each cycle lasting for 4 weeks). In July, an FDG-PET/CT scan demonstrated increased FDG accumulation in the right pubic-to-ischial lesions (SUV max = 6.6) (Figure 3E) and new uptake in the sacrum (Figure 3F) and in the first lumbar vertebra (Figure 3G). The fifth to sixth cycles of monthly BD therapy were performed from August onward, and the second Auto-PBSCT was carried out in October. The seventh to eighth cycles of monthly BD therapy were performed from November onward.
On an FDG-PET/CT scan done in December 2012, the increased FDG accumulation in the right pubic-to-ischial lesions remained unchanged (SUV max = 6.6), whereas the uptake in the sacrum and first lumbar vertebra was noted to have diminished (Figure 3H, 3I). The 9th to 13th cycles of monthly BD therapy were undertaken beginning in January 2013. An FDG-PET/CT scan done in June 2013 showed exacerbation of the FDG accumulation in the right pubic-to-ischial lesions (SUV max = 9.4) and newly emerged uptake in the sternum and the fourth lumbar vertebra (SUV max = 1.7) (Figure 3J, 3K). In July 2013, twice-weekly BD therapy (consisting of bortezomib at 1.3 mg/m2 subcutaneously on days 1, 4, 8, and 11, followed by a 10-day washout, and dexamethasone at 20 mg/day orally on days 1, 2, 4, 5, 8, 9, 11, and 12; each cycle lasting for 3 weeks) was started as remission re-induction therapy.
Another FDG-PET/CT performed in September 2013 after completion of two cycles of twice-weekly BD therapy revealed diminished FDG accumulation in the right pubic bone lesion (SUV max = 5.0) and sternal lesion (SUV max = 1.4), and disappearance of the fourth lumbar vertebral lesion (Figure 3L, 3M). The patient received a total of six cycles of twice-weekly BD therapy. FDG-PET/CT in February 2014 revealed that the FDG accumulation in the right pubic bone lesion remained unchanged (SUV max = 4.9), and, in addition, there was new uptake in the right hip bone (SUV max = 1.8) (Figure 3N-P). Radiographic examination revealed an osteolytic lesion in the right pubic bone (Figure 6A).
Figure 6.
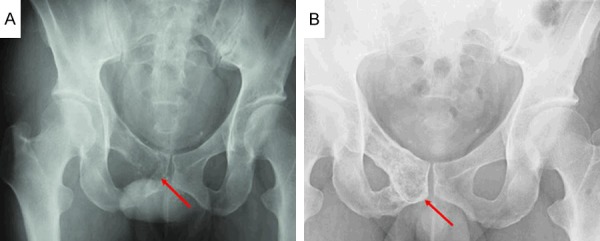
Radiograms of the pelvis. A: Osteolytic changes (red arrow) are noted in the right pubic bone. B: Bone formation (red arrow) is noted in the right pubic bone in contrast to the finding illustrated in A.
From March 2014 onward, the treatment was switched to RD therapy (i.e., lenalidomide 25 mg/day orally on days 1 to 21, followed by a 7-day washout period, and dexamethasone 40 mg orally on days 1, 8, 15, and 22, with each cycle lasting for 28 days). An FDG-PET/CT performed in July 2014 after completion of four cycles of RD therapy showed no change in the FDG accumulation value in the right pubic bone (SUV max = 4.9), but disappearance of the accumulation in the right hip bone/lesion (Figure 3Q, 3R). There was marked reduction of FDG accumulation in the right pubic bone (SUV max = 2.6) on the FDG-PET/CT performed in November 2014 after eight cycles of RD therapy (Figure 3S, 3T). Radiographic examination showed bone formation in the right pubic bone (Figure 6B) compared with the condition before the start of RD therapy (Figure 6A). The patient remains on RD therapy, and as of May 2015, is progressing favorably (Table 2).
Table 2.
Bone marker levels after eight cycles of lenalidomide/dexamethasone therapy
| Bone marker | Level after RD therapy | SRL reference range | Patients at baseline median (range) [16] | Controls median (range) [16] |
|---|---|---|---|---|
| Osteoclast regulators | ||||
| sRANKL (pg/ml) | 10,000 | ND | ND | ND |
| (pmol/l) | 160 ↑ | ND | 0.15 (ND-2.7) | 0.03 (ND-0.84) |
| OPG (pg/ml) | 69.0 | ND | ND | ND |
| (pmol/l) | 3.45 | ND | 5.2 (1.3-24.6) | 4.8 (2.1-9.4) |
| sRANKL/OPG | 46.38 ↑ | ND | 0.02 (0-0.4) | 0.004 (0-0.16) |
| Bone resorption markers | ||||
| Β-CTX (ng/ml) | Below detection limit ↓ | ND | 0.57 (ND-3.7) | 0.45 (0.02-0.9) |
| TRACP-5b (mU/dl) | 65 ↓ | 170-590 | ||
| Osteoblast inhibitors | ||||
| DKK-1 (pg/ml) | 1400 | 1357-5240 | ||
| Bone formation markers | ||||
| BAP (μg/l) | 6.3 | 3.7-20.9 | ||
| Osteocalcin (ng/ml) | 2.8 | 2.5-13 | ||
| ALP (IU/l) | 168 | 115-359 | ||
| I-PTH (pg/ml) | 49 | 10-65 |
RD, lenalidomide dexamethasone; sRANKL, serum receptor activator of nuclear factor-кB ligand; OPG, osteoprotegerin; CTX, carboxy-terminal collagen crosslinks; TRACP-5b, tartrate-resistant acid phosphatase type 5b; DKK-1, Dickkopf-related protein. 1; BAP, bone alkaline phosphatase; ALP, alkaline phosphatase; I-PTH, intact parathyroid hormone; ND, no data;
higher than normal range;
lower than normal range.
Discussion
It is generally recognized that the bone changes associated with MM arise from increased activation of osteoclasts and depressed activation of osteoblasts [11-13]. Further, sRANKL is thought to be a significant etiologic factor for this malignancy [14]. In a study of MM, the blood levels of osteoprotegerin (OPG), osteoclast differentiation inhibitory factor, were decreased compared to the normal control group, and this decrease was reportedly correlated with the osteolytic features of MM [15]. In the case described here, the serum OPG level was within the reference range, so that an OPG-improving effect of RD therapy seemed probable.
It has been reported that, in general, bortezomib does not cause elevation of the blood OPG level, but does lower the sRANKL level, thereby lowering the sRANKL/OPG ratio. In addition, bortezomib depresses other biomarkers of osteoclast activity and elevates the levels of osteogenesis biomarkers. There have been many reports of osteogenesis occurring in response to administration of bortezomib [1-6].
Some reports have stated that IMiDs such as thalidomide and pomalidomide have no effect on osteogenesis markers [7-9]; however, studies involving measurement of bone markers and evaluation of bone lesions after lenalidomidemonodrug therapy or RD therapy are few, with only seven reports in the literature, to the best of our knowledge. Therefore, much remains to be clarified. Five reports have discussed the absence of any effect of RD therapy on osteogenesis, i.e., RD therapy did not induce elevation of levels of osteogenesis markers [16] or bone formation [17] and lenalidomidemonodrug therapy lowered the levels of osteogenesis markers [18] or inhibited the production of osteoblast growth factors [19,20]. However, two reports have shown a positive effect of lenalidomide on bone lesions, i.e., the disappearance of bone lesions on PET/CT following lenalidomidemonodrug therapy in one case [21] and evidence of bone formation in response to RD therapy in another case [10]. Thus in only one case, in addition to the present case, has an osteogenetic response to lenalidomide been noted [10].
In the present case, bone formation was considered not to be ascribable to bisphosphonate therapy because the patient received bisphosphonate continuously from immediately after the diagnosis of MM. In the other case reported previously, it was considered that the RD therapy directly induced bone formation because the level of the osteogenesis marker bone-specific alkaline phosphatase (BAP) increased (Table 3) [10]. In our case, however, the BAP level remained within the reference range, as did that of osteocalcin, another osteogenesis marker (Tables 2, 3), whereas blood levels of the bone resorption markers CTX and TRACP-5b decreased (Tables 2, 3). Blood levels of osteoclastogenesis inhibitory factor OPG were within the reference range, whereas those of sRANKL increased; it was thus concluded that the sRANKL/OPG ratio tended to decrease in response to RD therapy. In fact, one report has demonstrated a decrease of the sRANKL/OPG ratio in response to lenalidomidemonodrug therapy [18]. It is therefore reasonable to suggest that the decrease in blood levels of bone resorption markers CTX and TRACP-5b and the tendency toward a decrease of the sRANKL/OPG ratio induced bone formation (although there was no increase in the blood/urine levels of osteogenesis markers).
Table 3.
Two cases showing evidence of bone formation following treatment with lenalidomide
| Age (years) | Sex | Myeloma type | ISS | Bone marker | Value | Myeloma therapy | Response | Outcome | Ref. |
|---|---|---|---|---|---|---|---|---|---|
| 67 | F | IgA/κ | III | BAP | ↑ | Systemic steroids | Remission | Alive | [10] |
| ALP | ↑ | RT/DEXA/Thal | Scheduled for HSCT | ||||||
| PTH | ↑ | ||||||||
| 41 | M | Non-secretory | I | sRANKL | ↑ | BD | Remission | Alive | Our |
| OPG | WRR | Auto-PBSCT | Remission | case | |||||
| sRANKL/OPG | ↑ | BD | DP | ||||||
| CTX | ↓ | RD | Remission | ||||||
| TRACP-5b | ↓ | ||||||||
| DKK-1 | WRR | ||||||||
| BAP | WRR | ||||||||
| Osteocalcin | WRR | ||||||||
| ALP | WRR | ||||||||
| PTH | WRR |
For the case described by Tsuda et al. [10], sRANKL, OPG, sRANKL/OPG ratio, TRACP-5b, DKK-1, and osteocalcin were not determined. IgA, immunoglobulin A; ISS, International Staging System; DKK-1, Dickkopf-related protein 1; RT, radiation therapy; DEXA, dexamethasone; thal, thalidomide; BD, bortezomib/dexamethasone; auto-PBSCT, autologous peripheral blood stem cell transplantation; DP, disease progression; HSCT, hematopoietic stem cell transplantation; WRR, within reference range; ↑, higher than normal range; ↓, lower than normal range.
As seen in the present case, it seems that elevation of the blood/urine levels of osteogenesis markers is not essential for bone formation. In addition, the sRANKL/OPG ratio does not necessarily decrease during RD therapy (because of increases in the RANKL level induced by dexamethasone) [16,22], and bone formation does not necessarily occur despite a reduction of the sRANKL/OPG ratio [8]; these facts highlight the complexity of the mechanisms underlying osteogenesis and clearly indicate that further detailed study is required.
The present case is the first reported case in which lowering of the levels of bone resorption markers and improvement of the OPG during RD therapy resulted in a relative decline of the sRANKL/OPG ratio, thereby facilitating bone formation. Further investigations in accumulated cases with periodic bone marker assays and assessments of bone lesions after lenalidomidemonodrug therapy or RD therapy are needed.
Disclosure of conflict of interest
None.
References
- 1.Terpos E, Heath DJ, Rahemtulla A, Zervas K, Chantry A, Anagnostopoulos A, Pouli A, Katodritou E, Verrou E, Vervessou EC, Dimopoulos MA, Croucher PI. Bortezomib reduces serum dickkopf-1 and receptor activator of nuclear factor-kappaB ligand concentrations and normalises indices of bone remodelling in patients with relapsed multiple myeloma. Br J Haematol. 2006;135:688–692. doi: 10.1111/j.1365-2141.2006.06356.x. [DOI] [PubMed] [Google Scholar]
- 2.Zangari M, Esseltine D, Lee CK, Barlogie B, Elice F, Burns MJ, Kang SH, Yaccoby S, Najarian K, Richardson P, Sonneveld P, Tricot G. Response to bortezomib is associated to osteoblastic activation in patients with multiple myeloma. Br J Haematol. 2005;131:71–73. doi: 10.1111/j.1365-2141.2005.05733.x. [DOI] [PubMed] [Google Scholar]
- 3.Terpos E, Christoulas D, Kokkoris P, Anargyrou K, Gavriatopoulou M, Migkou M, Tsionos K, Dimopoulos MA. Increased bone mineral density in a subset of patients with relapsed multiple myeloma who received the combination of bortezomib, dexamethasone and zoledronic acid. Ann Oncol. 2010;21:1561–1562. doi: 10.1093/annonc/mdq259. [DOI] [PubMed] [Google Scholar]
- 4.Giuliani N, Morandi F, Tagliaferri S, Lazzaretti M, Bonomini S, Crugnola M, Mancini C, Martella E, Ferrari L, Tabilio A, Rizzoli V. The proteasome inhibitor bortezomib affects osteoblast differentiation in vitro and in vivo in multiple myeloma patients. Blood. 2007;110:334–338. doi: 10.1182/blood-2006-11-059188. [DOI] [PubMed] [Google Scholar]
- 5.Heider U, Kaiser M, Müller C, Jakob C, Zavrski I, Schulz CO, Fleissner C, Hecht M, Sezer O. Bortezomib increases osteoblast activity in myeloma patients irrespective of response to treatment. Eur J Haematol. 2006;77:233–238. doi: 10.1111/j.1600-0609.2006.00692.x. [DOI] [PubMed] [Google Scholar]
- 6.Munemasa S, Sakai A, Kuroda Y, Okikawa Y, Katayama Y, Asaoku H, Kubo T, Shimose S, Kimura A. Osteoprogenitor differentiation is not affected by immunomodulatory thalidomide analogs but is promoted by low bortezomib concentration, while both agents suppress osteoclast differentiation. Int J Oncol. 2008;33:129–136. [PubMed] [Google Scholar]
- 7.Anderson G, Gries M, Kurihara N, Honjo T, Anderson J, Donnenberg V, Donnenberg A, Ghobrial I, Mapara MY, Stirling D, Roodman D, Lentzsch S. Thalidomide derivative CC-4047 inhibits osteoclast formation by down-regulation of PU. 1. Blood. 2006;107:3098–3105. doi: 10.1182/blood-2005-08-3450. [DOI] [PubMed] [Google Scholar]
- 8.Terpos E, Mihou D, Szydlo R, Tsimirika K, Karkantaris C, Politou M, Voskaridou E, Rahemtulla A, Dimopoulos MA, Zervas K. The combination of intermediate doses of thalidomide with dexamethasone is an effective treatment for patients with refractory/relapsed multiple myeloma and normalizes abnormal bone remodeling, through the reduction of sRANKL/osteoprotegerin ratio. Leukemia. 2005;19:1969–76. doi: 10.1038/sj.leu.2403890. [DOI] [PubMed] [Google Scholar]
- 9.Tosi P, Zamagni E, Cellini C, Parente R, Cangini D, Tacchetti P, Perrone G, Ceccolini M, Boni P, Tura S, Baccarani M, Cavo M. First-line therapy with thalidomide, dexamethasone and zoledronic acid decreases bone resorption markers in patients with multiple myeloma. Eur J Haematol. 2006;76:399–404. doi: 10.1111/j.0902-4441.2005.t01-1-EJH2520.x. [DOI] [PubMed] [Google Scholar]
- 10.Tsuda H, Yamasaki H, Tsuji T, Yokoo E. Therapy with lenalidomide plus dexamethasone-induced bone formation in a patient with refractory multiple myeloma. Int J Hematol. 2012;95:706–710. doi: 10.1007/s12185-012-1058-1. [DOI] [PubMed] [Google Scholar]
- 11.Terpos E, Dimopoulos MA. Myeloma bone disease: pathophysiology and management. Ann Oncol. 2005;16:1223–1231. doi: 10.1093/annonc/mdi235. [DOI] [PubMed] [Google Scholar]
- 12.Kyle RA, Gertz MA, Witzig TE, Lust JA, Lacy MQ, Dispenzieri A, Fonseca R, Rajkumar SV, Offord JR, Larson DR, Plevak ME, Therneau TM, Greipp PR. Review of 1027 patients with newly diagnosed multiple myeloma. Mayo Clin Proc. 2003;78:21–33. doi: 10.4065/78.1.21. [DOI] [PubMed] [Google Scholar]
- 13.Terpos E, Dimopoulos MA, Sezer O, Roodman D, Abildgaard N, Vescio R, Tosi P, Garcia-Sanz R, Davies F, Chanan-Khan A, Palumbo A, Sonneveld P, Drake MT, Harousseau JL, Anderson KC, Durie BG International Myeloma Working Group. The use of biochemical markers of bone remodeling in multiple myeloma: a report of the International Myeloma Working Group. Leukemia. 2010;24:1700–1712. doi: 10.1038/leu.2010.173. [DOI] [PubMed] [Google Scholar]
- 14.Roodman GD. Novel targets for myeloma bone disease. Expert Opin Ther Targets. 2008;12:1377–1387. doi: 10.1517/14728222.12.11.1377. [DOI] [PubMed] [Google Scholar]
- 15.Terpos E, Szydlo R, Apperley JF, Hatjiharissi E, Politou M, Meletis J, Viniou N, Yataganas X, Goldman JM, Rahemtulla A. Soluble receptor activator of nuclear factor kappaB ligand-osteoprotegerin ratio predicts survival in multiple myeloma: proposal for a novel prognostic index. Blood. 2003;102:1064–1069. doi: 10.1182/blood-2003-02-0380. [DOI] [PubMed] [Google Scholar]
- 16.Terpos E, Christoulas D, Kastritis E, Katodritou E, Papatheodorou A, Pouli A, Kyrtsonis MC, Michalis E, Papanikolaou X, Gkotzamanidou M, Koulieris E, Gavriatopoulou M, Zervas K, Dimopoulos MA Greek Myeloma Study Group. The combination of lenalidomide and dexamethasone reduces bone resorption in responding patients with relapsed/refractory multiple myeloma but has no effect on bone formation: final results on 205 patients of the Greek myeloma study group. Am J Hematol. 2014;89:34–40. doi: 10.1002/ajh.23577. [DOI] [PubMed] [Google Scholar]
- 17.Christoulas D. The combination of lenalidomide and dexamethasone reduces bone resorption in responding patients with relapsed/refractory multiple myeloma but has no effect on bone formation. Hematologica. 2010;95:397. doi: 10.1002/ajh.23577. [DOI] [PubMed] [Google Scholar]
- 18.Breitkreutz I, Raab MS, Vallet S, Hideshima T, Raje N, Mitsiades C, Chauhan D, Okawa Y, Munshi NC, Richardson PG, Anderson KC. Lenalidomide inhibits osteoclastogenesis, survival factors and bone-remodeling markers in multiple myeloma. Leukemia. 2008;22:1925–1932. doi: 10.1038/leu.2008.174. [DOI] [PubMed] [Google Scholar]
- 19.Bolomsky A, Schreder M, Meißner T, Hose D, Ludwig H, Pfeifer S, Zojer N. Immunomodulatory drugs thalidomide and lenalidomide affect osteoblast differentiation of human bone marrow stromal cells in vitro. Exp Hematol. 2014;42:516–525. doi: 10.1016/j.exphem.2014.03.005. [DOI] [PubMed] [Google Scholar]
- 20.De Matteo M, Brunetti AE, Maiorano E, Cafforio P, Dammacco F, Silvestris F. Constitutive down-regulation of Osterix in osteoblasts from myeloma patients: in vitro effect of Bortezomib and Lenalidomide. Leuk Res. 2010;34:243–249. doi: 10.1016/j.leukres.2009.07.017. [DOI] [PubMed] [Google Scholar]
- 21.Gozzetti A, Rossi V, Cerase A, Papini G, Defina M, Bocchia M. Single agent lenalidomide activity in multiple myeloma relapse evidenced uniquely by CT/PET. Mediterr J Hematol Infect Dis. 2012;4:e2012041. doi: 10.4084/MJHID.2012.041. [DOI] [PMC free article] [PubMed] [Google Scholar]
- 22.Hozumi A, Osaki M, Goto H, Sakamoto K, Inokuchi S, Shindo H. Bone marrow adipocytes support dexamethasone-induced osteoclast differentiation. Biochem Biophys Res Commun. 2009;382:780–784. doi: 10.1016/j.bbrc.2009.03.111. [DOI] [PubMed] [Google Scholar]


