

Abstract
We conducted this meta-analysis aimed to evaluate diagnostic accuracy of miR-210 in human cancers. A total of 673 cancer patients and 606 cancer-free individuals from 13 studies were contained in this meta-analysis. The overall diagnostic results in our study showed that the pooled sensitivity was 0.70, specificity was 0.76, and the AUC was 0.80. In addition, the PLR and NLR were 2.9 and 0.39, with DOR of 8. After the outliner exclusion detected by sensitivity analysis, these parameters had minimal change, which confirmed the stability of our work. The results in our studies showed that the miR-210 assay yielded relatively moderate accuracy in cancer patients and cancer-free individual differentiation. More basic researches are needed to highlight its role as supplement in clinical treatment.
1. Introduction
Cancer, with an estimate of millions of deaths each year, is considered as one of the highest mortalities worldwide [1–3]. The complex and progressive molecular progress involved in cancer development made it a challenge in clinic, bringing the early stage treatment to the front as it seems easier to control the disease. For example, 5-year survival rate is approximately 98% for renal cancer stage I patients, while survival drops to 50% for patients in stage III [4, 5]. For instance, 5-year survival rate of 80% for stage I but only 10% for stage IV patients with lung cancer also accounts for the importance of early detection [6, 7]. Thus, the most effective way to improve the disease outcomes and therefore reduce the worldwide health burden is the development of diagnostic tool for early detection.
Nowadays, the gold standard for cancer detection is the histological evaluation of biopsy. Though it is the most reliable way in cancer prediction with relatively high sensitivity and specificity, its usage is still restricted in clinic for the suffering of patients resulting from the invasive nature [8]. Several currently blood-based biomarkers may enhance the early cancer detection without the unpleasant procedure, including carcinoembryonic antigen (CEA), carbohydrate antigen 19-9, alphafetoprotein (AFP), and prostate specific antigen (PSA), but the low accuracy makes them minimally useful for the supplement of existing screening methods [9–12]. Therefore, although the diagnostic tool for early cancer detection could reduce the mortality, the effective biomarkers are still absent.
The discovery of microRNAs (miRNAs), a group of regulatory RNAs with 22 nucleotides in length, has opened up a new field in molecular diagnosis of cancer at early stage [13]. miRNAs have proven to be involved in the initiation and progression of human malignancy by influencing the degradation or translation of hundreds of mRNAs [13–15]. Further, their abnormally expression levels are found to be associated with a variety of diseases, including pancreatic cancer, lung cancer, and breast cancer [16–18]. What is more, miRNAs, present in human body matrix like plasma, sputum, feces, and serum, are resistant to RNase activity and keep stable even in extreme environment, which is the evidence of its stability [19, 20]. For instance, reproducibility is another advantage of miRNAs as they are stable and easy to be accessed by quantitative reverse transcription polymerase chain reaction (qTR-PCR) methods [21, 22]. Therefore, miRNAs may be the promising candidate as invasive biomarkers for early cancer detection.
MicroRNA-210 (miRNA-210, miR-210), a member of miRNAs, has been largely studied in the past several years and has been identified as a major induced miRNA under hypoxia [23, 24]. Thus, unusual expression of hypoxia-inducible miR-210 may link to cancer, as hypoxia is a common feature of the neoplastic microenvironment [25]. Since Wang et al. firstly demonstrated the miR-210 might have a prediction value for pancreatic cancer with sensitivity 0.42 and specificity 0.73, more researches have been done to explore the possible clinical usage of miR-210 [16, 26–28]. For example, Anjuman et al. found that miR-210 were present in considerably higher levels in sputum of lung cancer patients than cancer-free individuals and yielded diagnostic accuracy of 0.77 in lung cancer detection [28]. For instance, the improvement in diagnostic performance of miR-210 with sensitivity 0.84 and specificity 0.82 in the diagnosis of breast cancer was pronounced by Madhavan et al., which lightens the potential value of miR-210 with relatively better accuracy in supplement of the current screening tools [29]. Though other single studies as well investigated the important diagnostic role of miR-210 in various cancers, the limited sample size, different study design, and lack of unified standard resulted in conflicting results. And notably two meta-analyses have already been conducted to evaluate the performance of miR-210 as a prognostic factor in breast cancer, but the there is no meta-analysis focusing on the diagnostic value of miR-210 and systematically pooling all the relative published studies of miR-210 in a series of cancers [30, 31]. Thus, we performed the present meta-analysis to summarize the overall accuracy of miR-210 in cancer detection and further identify its value in clinical use.
2. Methods
2.1. Search Strategy
We conducted a literature research in database including PubMed, EMBASE, CNKI, Wan Fang library before August 6, 2014, in order to identify the relevant records about miR-210 in cancer. The key words we used in the research were “cancer” or “tumor” or “neoplasm” or “malignancy” or “neoplasia” and “microRNA-210” or “miR-210” or “has-miR-210” and “sensitivity” or “specificity” or “ROC curve” or “accuracy.”
Two reviewers checked the abstract of the studies and read the full-text if necessary to identify the final included studies based on the following included criteria: (1) studies which evaluated the diagnostic value of miR-210 for detecting cancer, (2) case-control design with control group of benign disease or healthy people, and (3) studies providing sufficient data to calculate diagnostic parameters.
2.2. Data Extraction and Quality Assessment
The necessary information of the included studies was extracted by two reviewers and filled onto standardized data forms. The data extracted were (1) first author, (2) year of publication, (3) country, (4) ethnicity, (5) number, age, and male ratio of the case and control groups, (6) cancer type, (7) specimen, and (8) the diagnostic parameters including sensitivity and specificity. We also scored each of the included studies according to the QUADAS-2 (quality assessment of diagnostic accuracy studies-2) tool. With the max score of 7, the quality of the included studies can be judged by the results.
2.3. Statistical Analysis
The random-effects model was used in our analysis to summarize the sensitivity, specificity, and other parameters [37]. The SROC curve (summary receiver operating characteristic) and its under area AUC were also gathered to evaluate the accuracy of miR-210 in cancer [38]. In addition, we performed metaregression to investigate the heterogeneity between the included studies with P < 0.05 considered statistically significant [39]. Confirming the stability of our study, we also conducted the sensitivity analysis and further performed the outliner exclusion in our work. For instance, Deeks et al.'s funnel plot was employed to assess the potential publication bias [40]. All the statistical analyses were undertaken using Stata 12.0.
3. Results
3.1. Study Research
110 manuscripts were identified from the initial search including PubMed, EMBASE, CNKI, and Wan Fang databases. After 8 records were excluded for duplications, totals of 102 records were left for the next step judgment. Then, 82 records were excluded as unrelated studies by reviewing the abstract and keywords. After full-text reading of the remaining 20 records, 8 of them were rejected due to the unavailable data. Thus, 12 records related to miR-210 in cancer detection were finally included in the meta-analysis [5, 16–18, 26–28, 32–36]. The flow diagram for literature research processes is shown in Figure 1.
Figure 1.
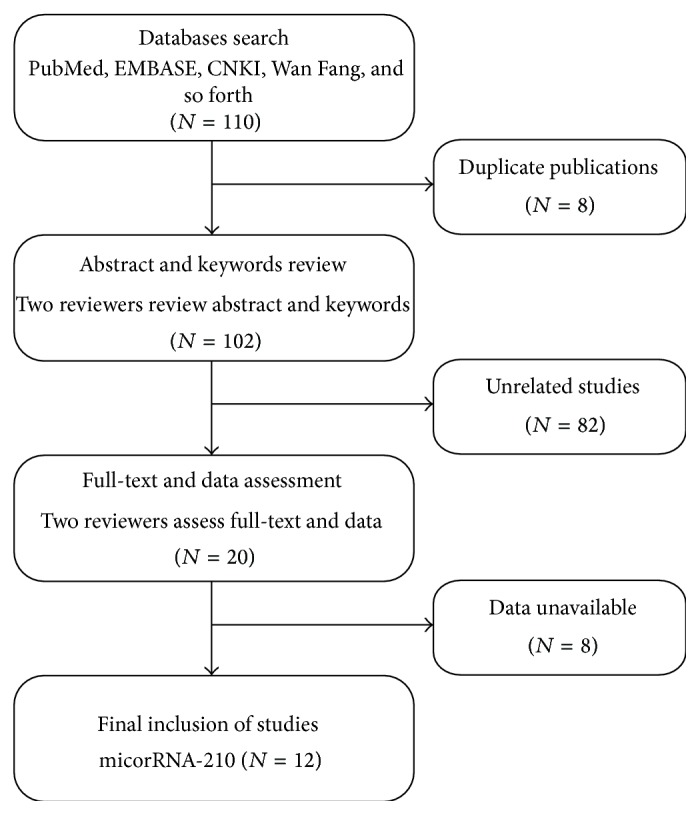
Flow diagram of publications research process.
The characteristics of studies included in this analysis are summarized in Table 1. 673 cancer patients and 606 cancer-free individuals from 13 studies published from 2009 to 2014 were contained in this meta-analysis. All the 13 studies tested miR-210s expression using qRT-PCR methods based on plasma (n = 5), sputum (n = 3), serum (n = 4), and fecal (n = 1). Six of the studies were conducted in Caucasian and African population, 4 of them conducted in Asian population, and 4 of them performed in Caucasian population. Among the 13 studies, 6 explore the association between miR-210 expression and lung cancer, 2 investigated that in breast cancer, and the other 5 focused on pancreatic cancer (n = 2), renal cancer (n = 2), and leukemia (n = 1). In addition, two reviews independently scored the included studies based on QUADAS-2 score system. All of them had relatively high quality with scores between 4 and 7 (Table 1), indicating the reliable foundation of our analysis.
Table 1.
Characteristics of the included studies.
| First author | Year | Country | Ethnicity | Sample size | Male | Cancer | Specimen | Diagnostic power | QUADAS | |||||
|---|---|---|---|---|---|---|---|---|---|---|---|---|---|---|
| Control | Case | Control | Case | TP | FP | FN | TN | |||||||
| Wang [16] | 2009 | USA | Caucasian | 44 | 34 | 0.51 | n.a. | Pancreatic cancer | Plasma | 18 | 9 | 26 | 25 | 4 |
| Xing [17] | 2010 | USA | Caucasian/African | 48 | 48 | 0.68 | 0.54 | Lung cancer | Sputum | 28 | 10 | 20 | 38 | 5 |
| Shen [18] | 2011 | USA | Caucasian/African | 76 | 80 | 0.55 | 0.63 | Lung cancer | Plasma | 43 | 22 | 33 | 58 | 5 |
| Shen [26] | 2011 | USA | Caucasian/African | 58 | 29 | 0.68 | 0.66 | Lung cancer | Plasma | 46 | 7 | 12 | 22 | 6 |
| Madhavan [32] | 2012 | Germany | Caucasian | 61 | 76 | n.a. | n.a. | Breast cancer | Plasma | 51 | 14 | 10 | 62 | 7 |
| 72 | 76 | n.a. | n.a. | Breast cancer | Plasma | 45 | 37 | 27 | 39 | |||||
| Ren [33] | 2012 | China | Asian | 29 | 13 | 0.66 | 0.62 | Pancreatic cancer | Fecal | 25 | 4 | 4 | 9 | 6 |
| Xie [27] | 2012 | China | Asian | 45 | 30 | 0.62 | 0.57 | Leukemia | Serum | 41 | 6 | 4 | 24 | 4 |
| Anjuman [28] | 2013 | USA | Caucasian/African | 39 | 42 | 0.59 | 0.61 | Lung cancer | Sputum | 27 | 10 | 12 | 32 | 5 |
| Zhao [34] | 2013 | France | Caucasian | 68 | 42 | 0.68 | 0.52 | Renal cancer | Serum | 55 | 9 | 13 | 33 | 6 |
| Iwamoto [5] | 2014 | Japan | Asian | 34 | 23 | 0.76 | 0.48 | Renal cancer | Serum | 22 | 4 | 12 | 19 | 4 |
| Li [35] | 2014 | USA | Caucasian/African | 35 | 40 | 0.63 | 0.65 | Lung cancer | Sputum | 20 | 4 | 15 | 36 | 6 |
| Shen [36] | 2014 | USA | Caucasian/African | 64 | 73 | 0.64 | 0.66 | Lung cancer | Sputum | 43 | 18 | 23 | 50 | 5 |
n.a.: not available; TP: true positive; FP: false positive; FN: false negative; TN: true negative; QUADAS: quality assessment of diagnostic accuracy studies.
3.2. Outcomes of miR-210 Assay
Considering the significant heterogeneity observed among the included studies (I 2 = 79.35% for sensitivity and I 2 = 64.95 for specificity, resp.) (Figure 2), the random-effect model was chosen in our analysis. As the SROC curve shown in Figure 3(a), the overall diagnostic results showed that the pooled sensitivity was 0.70 (95% CI: 0.62–0.78), specificity was 0.76 (95% CI: 0.70–0.81), and the AUC was 0.80 (95% CI: 0.70–0.83). The pooled positive likelihood ratios (PLR) and negative likelihood ratios (NLR) were also calculated by the bivariate meta-analysis with values of 2.9 (95% CI: 2.3–3.8) and 0.39 (95% CI: 0.29–0.52), respectively. The overall diagnostic odds ratio (DOR), ratio of PLR and NLR, was 8 (95% CI: 4–13). The results all together indicated a relatively moderate diagnostic accuracy of miR-210 in distinguishing cancer patients and cancer-free individuals.
Figure 2.

Forest plots of sensitivity (a) and specificity (b) of the overall 12 included publications.
Figure 3.

The SROC curves containing mean operating sensitivity and specificity point with AUC (a) overall and (b) after exclusion.
3.3. Metaregression and Sensitivity Analyses
In order to find potential sources of heterogeneity, we performed the metaregression based on the variables including number of case and control, age of case and control, cancer type, and specimen. The results in Figure 4 suggested that cancer type (P < 0.05) had an effect on sensitivity, while the cancer type (P < 0.05) and the specimen (P < 0.001) contributed to interstudy heterogeneity for specificity. We also conducted sensitivity analyses and further excluded 1 outliner found by influence analysis and outlier detection in Figure 5. After exclusion, the sensitivity increased from 0.70 to 0.71, specificity increased from 0.76 to 0.78, the PLR increased from 2.9 to 3.2, the NLR dropped from 0.39 to 0.37, DOR improved from 8 to 9, and AUC decreased from 0.80 to 0.79, showing minimal change with our overall analysis (Figure 3(b)). Combined with goodness of fit and bivariate normality analyses, we confirmed the robustness of our meta-analysis.
Figure 4.

Multivariable metaregression (a) sensitivity and (b) specificity.
Figure 5.

Influence analysis and outlier detection: (a) goodness of fit, (b) bivariate normality, (c) influence analysis, and (d) outlier detection.
3.4. Publication Bias
Fagan's nomogram in Figure 6 describes the association between miR-210 assays results and the probability of cancer. For instance, when miR-210 assays were tested for any people with a pretest probability of 25% to have cancer, a positive result would improve posttest probability having cancer to 50%, while a negative result would drop the posttest probability to 12%. Thus, the miR-210 may serve as a noninvasive biomarker to supply the existing diagnostic methods. In addition, we conducted Deeks et al.'s funnel plot asymmetry test and found no significant publication bias in our study with P value of 0.22 (Figure 7).
Figure 6.
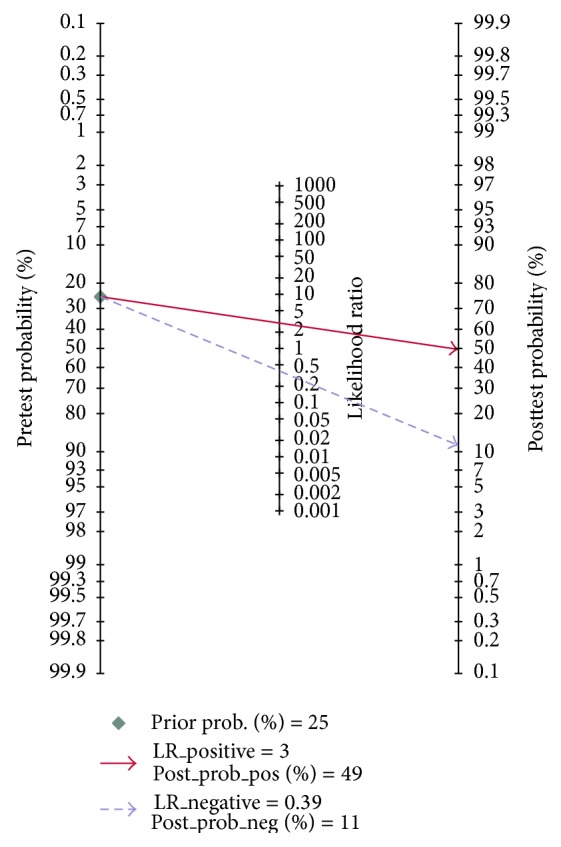
Fagan's nomogram in assessment of the test probabilities after miR-210 assay.
Figure 7.
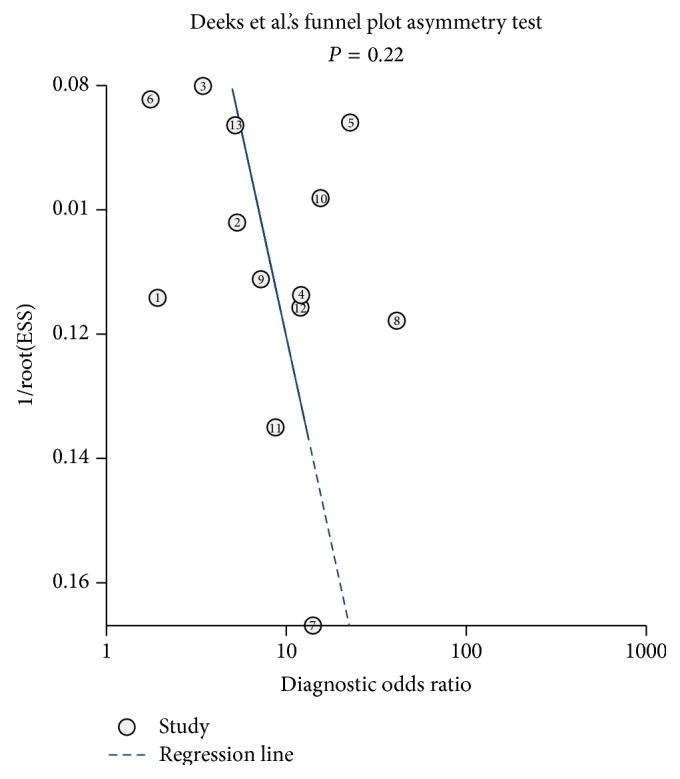
Deeks et al.'s funnel plots asymmetry test with regression line to explore publication bias.
4. Discussion
Cancer is a worldwide health problem due to the complex and progressive molecular procedure and the absence of effective diagnostic tool at cancer early stage [2]. Though the development of such invasive and effective biomarkers has been investigated for decades, little progress has been made until the discovery of miRNAs. miRNAs have been reported to associate with the development of tumor as a regulator in gene expression [13]. Large efforts have been made to investigate the link between abnormal miRNA expression and cancer, including the miR-210, the most consistently hypoxia-induced miRNA [41]. However, the diagnostic accuracy of miR-210 was inconsistent in literature due to the inescapable limitation of single study. Thus, we conducted the present meta-analysis to evaluate the diagnostic performance of miR-210 in cancer detection.
The pooled results in our study were sensitivity of 0.70 (95% CI: 0.62–0.78), specificity of 0.76 (95% CI: 0.70–0.81), and the AUC of 0.80 (95% CI: 0.70–0.83), indicating a moderate diagnostic efficiency of miR-210 in diagnosis of cancer. The pooled PLR and NLR were 2.9 (95% CI: 2.3–3.8) and 0.39 (95% CI: 0.29–0.52), respectively, with DOR of 8 (95% CI: 4–13), suggesting the relatively low level of miR-210 assay to identify or exclude cancer patients. Thus, due to the moderate accuracy, the application of miR-210 serving as a clinical biomarker still has a long way to go.
As the results in our analysis, a single miR-210 in cancer detection may lack sensitivity and specificity, but there are several areas we need to focus on in the future research in order to promote the usage of miR-210 in clinical treatment. Firstly, the mechanism of miR-210 abnormally expressed in cancer is not completely understood; more scientific and technological methods should be used in future basic research to provide better understanding of biological roles of miR-210 in cancer, hence lightening up the diagnostic value of miR-210. Recent studies suggested that hypoxic condition, which is a feature for solid tumor, may increase the level of miR-210 as miR-210 is related to the hypoxia-inducible factor- (HIF-) 1a and HIF-2a [41–43]. Although such connection of miR-210 and cancer highlights the function of miR-210 in cancer detection, the exact mechanism of it in tumor development needs further investigation.
Secondly, plenty of studies have demonstrated the advantages of multiple miRNAs combined assays, which may be the solution for the lack of accuracy of miR-210 in our analysis. For example, Shen et al. explored the prediction ability of miR-210 and miR-31 for lung cancer; combined use of the two miRNAs yielded 65.2% sensitivity and 89.7% specificity versus sensitivity of 67.2% and specificity of 31.5% of single miR-210 assay [36]. Not happening singly but in pairs, Anjuman et al. also found that single miR-210 test generated 0.77 accuracy in diagnosis of lung cancer, while the combined analysis of miR-210 and miR-31 had a better overall diagnostic performance with 0.83 [28]. For instance, we know that single miR-210 can cover a broad spectrum of cancers and the combination of miR-210 and other miRNAs may contribute to the accuracy improvement, but the combination way, as well as the unique group for specific cancer, needs to be further clarified.
Thirdly, although the ethnicity is not the source of heterogeneity according to the metaregression in the present analysis, cancer prediction based on population is still an important task in the future as different ethic patient may have specific characteristics of their tumors. What is more, the sample size was too small in our study with only 3 studies focused on the miR-210 expression in cancer in Asian population and no study explored the miR-210 function in only African populations, which resulted in unavoidable limitations. Actually, the included studies showed that the serum-based miR-210 assay in renal cancer yielded 81% sensitivity and 79.4% specificity in Caucasian populations but 65% sensitivity and 83% specificity in Asian populations [5, 34]. Thus, more fundamental research with long follow-up period should pay attention to the heterogeneity of miR-210 in cancer based on populations.
Fourthly, data normalization is currently a problem we need to deal with. For example, when we demonstrated that miR-210 was highly expressed in cancer, infeasible comparison can be done between studies as no reference substance can be found in the existing included studies, such as a miRNA sharing the same expression in cancer patients and cancer-free individuals. In addition, the cut-off values of miR-210 were varied in different studies and different cancers, which may result in the higher accuracy from lower cut-off value. Therefore, the standard should be set up in order to avoid the systemic differences.
5. Conclusion
In conclusion, the results in current meta-analysis showed that the application of miR-210 as the first-line screening tool in clinical treatment was immature due to lack of accuracy. However, the miR-210 assay showed potential used as a supplement for the existing diagnostic methods to improve accuracy. What is more, future research should focus on the combined usage of miR-210 with other miRNAs and make improvement in technic consensus such as data normalization.
Conflict of Interests
The authors declare that there is no conflict of interests regarding the publication of this paper.
References
- 1.Jemal A., Siegel R., Ward E., et al. Cancer statistics, 2008. CA: A Cancer Journal for Clinicians. 2008;58(2):71–96. doi: 10.3322/ca.2007.0010. [DOI] [PubMed] [Google Scholar]
- 2.Li X., Wu K., Fan D. CIAPIN1 as a therapeutic target in cancer. Expert Opinion on Therapeutic Targets. 2010;14(6):603–610. doi: 10.1517/14728221003774127. [DOI] [PubMed] [Google Scholar]
- 3.Jemal A., Bray F., Center M. M., Ferlay J., Ward E., Forman D. Global cancer statistics. CA: A Cancer Journal for Clinicians. 2011;61(2):69–90. doi: 10.3322/caac.20107. [DOI] [PubMed] [Google Scholar]
- 4.Motzer R. J., Mazumdar M., Bacik J., Berg W., Amsterdam A., Ferrara J. Survival and prognostic stratification of 670 patients with advanced renal cell carcinoma. Journal of Clinical Oncology. 1999;17(8):2530–2540. doi: 10.1200/JCO.1999.17.8.2530. [DOI] [PubMed] [Google Scholar]
- 5.Iwamoto H., Kanda Y., Sejima T., Osaki M., Okada F., Takenaka A. Serum miR-210 as a potential biomarker of early clear cell renal cell carcinoma. International Journal of Oncology. 2014;44(1):53–58. doi: 10.3892/ijo.2013.2169. [DOI] [PubMed] [Google Scholar]
- 6.Frost J. K., Ball W. C., Jr., Levin M. L., et al. Early lung cancer detection: results of the initial (prevalence) radiologic and cytologic screening in the Johns Hopkins Study. American Review of Respiratory Disease. 1984;130(4):549–554. doi: 10.1164/arrd.1984.130.4.549. [DOI] [PubMed] [Google Scholar]
- 7.Hirsch F. R., Franklin W. A., Gazdar A. F., Bunn P. A. Jr. Early detection of lung cancer: clinical perspectives of recent advances in biology and radiology. Clinical Cancer Research. 2001;7(1):5–22. [PubMed] [Google Scholar]
- 8.Wittmann J., Jäck H.-M. Serum microRNAs as powerful cancer biomarkers. Biochimica et Biophysica Acta—Reviews on Cancer. 2010;1806(2):200–207. doi: 10.1016/j.bbcan.2010.07.002. [DOI] [PubMed] [Google Scholar]
- 9.Lumachi F., Brandes A. A., Ermani M., Bruno G., Boccagni P. Sensitivity of serum tumor markers CEA and CA 15–3 in breast cancer recurrences and correlation with different prognostic factors. Anticancer Research. 2000;20(6C):4751–4755. [PubMed] [Google Scholar]
- 10.Schneider J., Velcovsky H.-G., Morr H., Katz N., Neu K., Eigenbrodt E. Comparison of the tumor markers Tumor M2-PK, CEA, CYFRA 21-1, NSE and SCC in the diagnosis of lung cancer. Anticancer Research. 2000;20(6 D):5053–5058. [PubMed] [Google Scholar]
- 11.Dbouk H. A., Tawil A., Nasr F., et al. Significance of CEA and VEGF as diagnostic markers of colorectal cancer in Lebanese patients. The Open Clinical Cancer Journal. 2007;1:1–5. doi: 10.2174/1874189400701010001. [DOI] [PMC free article] [PubMed] [Google Scholar]
- 12.Hanash S. M., Baik C. S., Kallioniemi O. Emerging molecular biomarkers-blood-based strategies to detect and monitor cancer. Nature Reviews Clinical Oncology. 2011;8(3):142–150. doi: 10.1038/nrclinonc.2010.220. [DOI] [PubMed] [Google Scholar]
- 13.Hutvágner G., Zamore P. D. A microRNA in a multiple-turnover RNAi enzyme complex. Science. 2002;297(5589):2056–2060. doi: 10.1126/science.1073827. [DOI] [PubMed] [Google Scholar]
- 14.Esquela-Kerscher A., Slack F. J. Oncomirs—microRNAs with a role in cancer. Nature Reviews Cancer. 2006;6(4):259–269. doi: 10.1038/nrc1840. [DOI] [PubMed] [Google Scholar]
- 15.Zhang B., Pan X., Cobb G. P., Anderson T. A. microRNAs as oncogenes and tumor suppressors. Developmental Biology. 2007;302(1):1–12. doi: 10.1016/j.ydbio.2006.08.028. [DOI] [PubMed] [Google Scholar]
- 16.Wang J., Chen J., Chang P., et al. MicroRNAs in plasma of pancreatic ductal adenocarcinoma patients as novel blood-based biomarkers of disease. Cancer Prevention Research. 2009;2(9):807–813. doi: 10.1158/1940-6207.CAPR-09-0094. [DOI] [PMC free article] [PubMed] [Google Scholar]
- 17.Xing L., Todd N. W., Yu L., Fang H., Jiang F. Early detection of squamous cell lung cancer in sputum by a panel of microRNA markers. Modern Pathology. 2010;23(8):1157–1164. doi: 10.1038/modpathol.2010.111. [DOI] [PubMed] [Google Scholar]
- 18.Shen J., Liu Z., Todd N. W., et al. Diagnosis of lung cancer in individuals with solitary pulmonary nodules by plasma microRNA biomarkers. BMC Cancer. 2011;11, article 374 doi: 10.1186/1471-2407-11-374. [DOI] [PMC free article] [PubMed] [Google Scholar]
- 19.Mitchell P. S., Parkin R. K., Kroh E. M., et al. Circulating microRNAs as stable blood-based markers for cancer detection. Proceedings of the National Academy of Sciences of the United States of America. 2008;105(30):10513–10518. doi: 10.1073/pnas.0804549105. [DOI] [PMC free article] [PubMed] [Google Scholar]
- 20.Weber J. A., Baxter D. H., Zhang S., et al. The microRNA spectrum in 12 body fluids. Clinical Chemistry. 2010;56(11):1733–1741. doi: 10.1373/clinchem.2010.147405. [DOI] [PMC free article] [PubMed] [Google Scholar]
- 21.Chen X., Ba Y., Ma L., et al. Characterization of microRNAs in serum: a novel class of biomarkers for diagnosis of cancer and other diseases. Cell Research. 2008;18(10):997–1006. doi: 10.1038/cr.2008.282. [DOI] [PubMed] [Google Scholar]
- 22.Turchinovich A., Weiz L., Langheinz A., Burwinkel B. Characterization of extracellular circulating microRNA. Nucleic Acids Research. 2011;39(16):7223–7233. doi: 10.1093/nar/gkr254. [DOI] [PMC free article] [PubMed] [Google Scholar]
- 23.Kulshreshtha R., Ferracin M., Wojcik S. E., et al. A microRNA signature of hypoxia. Molecular and Cellular Biology. 2007;27(5):1859–1867. doi: 10.1128/MCB.01395-06. [DOI] [PMC free article] [PubMed] [Google Scholar]
- 24.Osman A. MicroRNAs in health and disease—basic science and clinical applications. Clinical Laboratory. 2012;58(5-6):393–402. [PubMed] [Google Scholar]
- 25.Crosby M. E., Devlin C. M., Glazer P. M., Calin G. A., Ivan M. Emerging roles of microRNAs in the molecular responses to hypoxia. Current Pharmaceutical Design. 2009;15(33):3861–3866. doi: 10.2174/138161209789649367. [DOI] [PubMed] [Google Scholar]
- 26.Shen J., Todd N. W., Zhang H., et al. Plasma microRNAs as potential biomarkers for non-small-cell lung cancer. Laboratory Investigation. 2011;91(4):579–587. doi: 10.1038/labinvest.2010.194. [DOI] [PMC free article] [PubMed] [Google Scholar]
- 27.Xie H., Chu Z., Wang H. Serum microRNA expression profile as a biomarker in diagnosis and prognosis of acute myeloid leukemia. Journal of Clinical Pediatric Dentistry. 2012;30(5):421–424. [Google Scholar]
- 28.Anjuman N., Li N., Guarnera M., Stass S. A., Jiang F. Evaluation of lung flute in sputum samples for molecular analysis of lung cancer. Clinical and Translational Medicine. 2013;2, article 15 doi: 10.1186/2001-1326-2-15. [DOI] [PMC free article] [PubMed] [Google Scholar]
- 29.Madhavan D., Cuk K., Burwinkel B., Yang R. Cancer diagnosis and prognosis decoded by blood-based circulating micro RNA signatures. Frontiers in Genetics. 2013;4(article 116) doi: 10.3389/fgene.2013.00116. [DOI] [PMC free article] [PubMed] [Google Scholar]
- 30.Hong L., Yang J., Han Y., Lu Q., Cao J., Syed L. High expression of miR-210 predicts poor survival in patients with breast cancer: a meta-analysis. Gene. 2012;507(2):135–138. doi: 10.1016/j.gene.2012.07.025. [DOI] [PubMed] [Google Scholar]
- 31.Li Y., Ma X., Zhao J., Zhang B., Jing Z., Liu L. microRNA-210 as a prognostic factor in patients with breast cancer: meta-analysis. Cancer Biomarkers. 2013;13(6):471–481. doi: 10.3233/CBM-130385. [DOI] [PMC free article] [PubMed] [Google Scholar]
- 32.Madhavan D., Zucknick M., Wallwiener M., et al. Circulating miRNAs as surrogate markers for circulating tumor cells and prognostic markers in metastatic breast cancer. Clinical Cancer Research. 2012;18(21):5972–5982. doi: 10.1158/1078-0432.ccr-12-1407. [DOI] [PubMed] [Google Scholar]
- 33.Ren Y., Gao J., Liu J.-Q., et al. Differential signature of fecal microRNAs in patients with pancreatic cancer. Molecular Medicine Reports. 2012;6(1):201–209. doi: 10.3892/mmr.2012.862. [DOI] [PubMed] [Google Scholar]
- 34.Zhao A., Li G., Péoc'h M., Genin C., Gigante M. Serum miR-210 as a novel biomarker for molecular diagnosis of clear cell renal cell carcinoma. Experimental and Molecular Pathology. 2013;94(1):115–120. doi: 10.1016/j.yexmp.2012.10.005. [DOI] [PubMed] [Google Scholar]
- 35.Li N., Ma J., Guarnera M. A., Fang H., Cai L., Jiang F. Digital PCR quantification of miRNAs in sputum for diagnosis of lung cancer. Journal of Cancer Research and Clinical Oncology. 2014;140(1):145–150. doi: 10.1007/s00432-013-1555-5. [DOI] [PMC free article] [PubMed] [Google Scholar]
- 36.Shen J., Liao J., Guarnera M. A., et al. Analysis of microRNAs in sputum to improve computed tomography for lung cancer diagnosis. Journal of Thoracic Oncology. 2014;9(1):33–40. doi: 10.1097/jto.0000000000000025. [DOI] [PMC free article] [PubMed] [Google Scholar]
- 37.Vamvakas E. C. Meta-analyses of studies of the diagnostic accuracy of laboratory tests: a review of the concepts and methods. Archives of Pathology & Laboratory Medicine. 1998;122(8):675–686. [PubMed] [Google Scholar]
- 38.Mitchell A. J., Vaze A., Rao S. Clinical diagnosis of depression in primary care: a meta-analysis. The Lancet. 2009;374(9690):609–619. doi: 10.1016/S0140-6736(09)60879-5. [DOI] [PubMed] [Google Scholar]
- 39.Dinnes J., Deeks J., Kirby J., Roderick P. A methodological review of how heterogeneity has been examined in systematic reviews of diagnostic test accuracy. Health Technology Assessment. 2005;9(12):1–113. doi: 10.3310/hta9120. [DOI] [PubMed] [Google Scholar]
- 40.Deeks J. J., Macaskill P., Irwig L. The performance of tests of publication bias and other sample size effects in systematic reviews of diagnostic test accuracy was assessed. Journal of Clinical Epidemiology. 2005;58(9):882–893. doi: 10.1016/j.jclinepi.2005.01.016. [DOI] [PubMed] [Google Scholar]
- 41.Devlin C., Greco S., Martelli F., Ivan M. MiR-210: more than a silent player in hypoxia. IUBMB Life. 2011;63(2):94–100. doi: 10.1002/iub.427. [DOI] [PMC free article] [PubMed] [Google Scholar]
- 42.Wenger R. H., Gassmann M. Oxygen(es) and the hypoxia-inducible factor-1. Biological Chemistry. 1997;378(7):609–616. [PubMed] [Google Scholar]
- 43.Neal C. S., Michael M. Z., Rawlings L. H., van der Hoek M. B., Gleadle J. M. The VHL-dependent regulation of microRNAs in renal cancer. BMC Medicine. 2010;8, article 64 doi: 10.1186/1741-7015-8-64. [DOI] [PMC free article] [PubMed] [Google Scholar]