

To the Editor:
RNA-seq is eclipsing microarray techniques to measure gene expression in tissues (1) because of several factors including reduced costs, increased sensitivity (1, 2), and the ability to detect splice variants (1) and nonhuman sequences in the sample (3). We investigated the use of RNA-seq to assess the transcriptome of three types of tissues relevant to pulmonary research: bronchial brushes obtained from healthy volunteers, normal human bronchial epithelial (NHBE) cells cultured at the air–liquid interface, and healthy whole-lung samples obtained from the Lung Tissue Research Consortium (LTRC). Our analysis suggests that 40–60 million reads are sufficient to assess the majority of the host transcriptome in these samples, whereas higher depths are needed for very low expressed genes or rare splice variants. We also analyzed read depths of human bronchial epithelial (HBE) cells treated with IL-13 or IL-17 to determine whether inflammation affects the parameters. Treatment with IL-13 or IL-17 showed no significant effect on the results, suggesting that 40 million reads is adequate to assess the transcriptome of HBE cells in either resting or cytokine-stimulated conditions.
Methods
RNA sample collection and isolation
Healthy control participants were recruited as part of the National Heart Lung and Blood Institute’s Severe Asthma Research Program (4). Healthy controls were defined as healthy atopic or nonatopic individuals with normal lung function and without a history of chronic respiratory conditions, including rhinitis requiring topical corticosteroid treatment. A demographics table is included as Table E1 in the online supplement.
Bronchial brushings were obtained from the fourth- to sixth-generation airways, as previously described (5). Bronchial brushings were placed directly into ice-cold Qiazol (Qiagen, Valencia, CA) during the bronchoscopy to ensure minimal RNA degradation, after which samples were stored at −80°C until RNA isolation, using Qiagen RNeasy isolation kit (Qiagen). RNA was quantitated using nanodrop, and integrity was determined with a total RNA nano chip (Agilent Technologies).
The National Heart, Lung, and Blood Institute LTRC obtained lung biopsies from patients with chronic obstructive pulmonary disease undergoing lung volume reduction surgery, transplantation, or resection for malignancies. In the latter case, tissue from nontumorous portions were collected. Patient phenotyping was determined by various methods including medical questionnaires, chest computed tomography scans, spirometry, 6-minute-walk tests, cardiopulmonary exercise tests, lung volume measurements, arterial blood gas, and diffusing capacity of carbon monoxide. Taking all of this information into account, the final diagnosis was rendered by the Clinical Center Site Principal Investigator.
Normal human bronchial/tracheal epithelial cells with retinoic acid from healthy nonsmoking adults were purchased commercially (Lonza, Allendale, NJ), subcultured to P2, and seeded on permeable supports. They were grown in hormonally defined media at the air–liquid interface for 2–4 weeks before use. Cells were stimulated basolaterally with IL-17 or IL-13 (10–100 ng/ml) or vehicle control for 48 hours before harvesting. Total RNA was collected using Qiagen’s RNEasy Kit after passing whole-cell lysates through a Qiashredder column.
RNA-seq analysis
The RNA-seq analysis methodology was adapted from the previously published study on human B-cells by Toung and colleagues (6). The full methodology including library preparation is included in the supplemental materials.
Results and Conclusions
The percentage of total reads aligning to the human genome (National Center for Biotechnology Information 37.2) and the percentage of uniquely mapped reads varied slightly across the six different data sets (Table 1), whereas alignment rates remained constant across sequencing depths within each data set. The numbers of genes and gene isoforms detected are listed in Table E2. To investigate the effect of sequencing depth on the detection of genes and isoforms, the full read set was assumed to reflect the complete collection and best expression estimates of genes and isoforms within the data set, and then the number of genes and isoforms detected at various fractions of the full read set was assessed. As expression levels are a critical outcome measure for RNA-seq studies, genes and transcripts that were within 10% of their final (full read set) expression level were assayed across various sequencing depths (Figures 1A–1H). The lines track the results obtained at different depths of sequencing, and the color intensities of the gray lines reflect ranges of gene and transcript abundance (determined by fragments per kilobase of transcript per million mapped reads [FPKM] value). For example, the lightest gray line shows the performance of genes and transcripts with FPKM values higher than 60, whereas the darkest gray line represents rare genes and transcripts with FPKM values between 0.1 and 3.74.
Table 1.
Total Number of Reads, Percentage of Total Mapped Reads, and Percentage of Uniquely Mapped Reads as a Percentage of Total Mapped Reads in Each Pooled Sample
| Pooled Sample | Total Reads | Total Mapped Reads (%) | Uniquely Mapped Reads (% of Total Mapped) |
|---|---|---|---|
| Bronchial brushes | 88 million | 90.6 | 86.7 |
| NHBE | 258 million | 96.8 | 85.1 |
| IL-13–treated HBE | 170 million | 96.1 | 84.1 |
| IL-17–treated HBE | 40 million | 95.1 | 89.9 |
| LTRC (healthy) | 107 million | 94.1 | 86.9 |
Definition of abbreviations: HBE = human bronchial epithelial cells; LTRC = Lung Tissue Research Consortium; NHBE = normal HBE.
Figure 1.
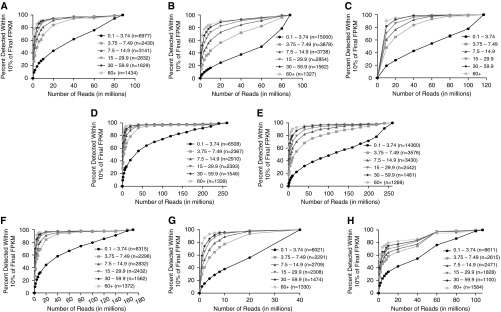
The number of genes and transcripts detected in the pooled data sets were assumed to be “final” values. The percentages of these “final” values detected at different sequencing depths were determined. (A) Detection of genes that are within 10% of final expression levels in the pooled 88-million-read bronchial brush data set. More than 95% of moderately to highly expressed genes (fragments per kilobase of transcript per million mapped reads [FPKM] higher than 3.74) that are within 10% of final expression levels are detected with 40 million reads in bronchial brushes. (B) Detection of transcripts that are within 10% of final expression levels in the pooled bronchial brush data set. The lines are shifted down and to the right compared with those in A, suggesting that deeper sequencing is required for the detection of transcripts at relative rates of detection in A. (C) Paired-end data analysis for the detection of genes that are within 10% of final expression levels in bronchial brushes. Shown are mean ± SD FPKM values of two bronchial brush samples. More than 90% of moderately to highly expressed genes (FPKM higher than 3.74) that are within 10% of final expression levels are detected with 60 million reads. (D) Detection of genes that are within 10% of final expression levels in the pooled 258-million-read normal human bronchial epithelial (NHBE) cell data set. More than 95% of moderately to highly expressed genes (FPKM higher than 3.74) that are within 10% of final expression levels are detected with 60 million reads in the pooled NHBE cell data set. (E) Detection of transcripts that are within 10% of final expression levels in the pooled NHBE cell data set. (F) Detection of genes that are within 10% of final expression levels in the pooled 170-million-read IL-13–treated human bronchial epithelial (HBE) cell data set. (G) Detection of genes that are within 10% of final expression levels in the pooled 40-million-read IL-17–treated HBE cell data set. (H) Detection of genes that are within 10% of final expression levels in the pooled 107-million-read Lung Tissue Research Consortium healthy whole-lung tissue data set.
In the bronchial brush data set, we detected 18,443 genes and 28,359 of their alternatively spliced transcripts. Consistent with its lower FPKM value, the darkest line is shifted slightly downward and to the right (Figure 1A), demonstrating that for the detection of very low expressed genes, the relationship between detection and sequencing depth is nearly linear. However, 95% of genes with FPKM values higher than 3.74 that are within 10% of final expression levels were detected with 40 million reads. Detection of transcripts (which includes splice variants) required greater read depths compared with genes. For example, 80 million reads were needed to detect more than 95% of alternatively spliced transcripts with FPKM higher than 3.74 that are within 10% of final expression levels (Figure 1B). As this analysis was with single-read data, we also analyzed two bronchial brush data sets subjected to paired-end 150-bp sequencing with more than 100 million reads per sample (Figure 1C). The results were very similar, in that more than 95% of genes with FPKM values higher than 3.74 that are within 10% of final expression levels were detected with 60 million reads, and genes with a FPKM values higher than 7.5 were detected with 40 million reads. Moreover, one of the paired-end bronchial brush data sets was from a male sample (Figure E1A), whereas the other was from a female sample (Figure E1B). We observed similar results in both samples with a very small standard deviation (Figure 1C). We also repeated the analysis, using a different reference genome (Figure E2). We mapped the single-read data of the bronchial brush sample to an Ensembl reference genome (release 76) and found that at 20 million reads, approximately 60% of genes with FPKM higher than 3.74 were detected using the Ensembl annotation, whereas more than 80% of genes were detected using the National Center for Biotechnology Information annotation. The variation in the results can be attributed to differences in the annotation of the two databases. Both reference genomes yielded the detection of approximately 90% of genes with FPKM higher than 3.74 at the depth of 60 million reads.
In the NHBE cell data set, 17,063 genes and 26,557 of their alternatively spliced transcripts were detected. More than 95% of genes with FPKM higher than 3.74 that were within 10% of final expression levels were detected with approximately 40 million reads in the NHBE cells (Figure 1D). Again, the detection of transcripts required greater read depths (Figure 1E). Cytokine treatment of NHBE cells with IL-17 or IL-13 did not significantly affect the results (Figures 1F and 1G). Analysis of LTRC healthy whole lung indicated that approximately 60 million reads were needed to detect more than 95% of genes with FPKM higher than 3.74 that were within 10% of final expression levels (Figure 1G). This greater read depth may reflect a greater diversity of cell types in whole-lung tissue. Furthermore, while we used the threshold of 10% of final expression levels as our criterion for gene and transcript detection, we also analyzed the results of the NHBE cell data set at a 5% threshold. We found that at 60 million reads, approximately 80% of moderately to highly expressed genes (FPKM higher than 3.74) were detected at the 5% threshold (Figure E3), whereas approximately 95% were detected at the 10% threshold (Figure 1C). As expected, the stricter the threshold, the lower the percentage of detection.
Overall, our results show that modest depths of sequencing are sufficient for the detection of the majority of genes and alternatively spliced transcripts in the sample types that were analyzed in this study. Reads depths of 40 million were adequate to detect the majority of genes in bronchial brush and NHBE samples. Although modest sequencing is sufficient for the detection of genes and transcripts, our data suggest that deeper sequencing is required for the accurate quantification of genes that are expressed at low levels or rare splice isoforms. We have shown in prior studies that RNA-seq has a much greater dynamic range than hybridization-based microarrays (2), and this study suggests that 40–60 million mappable reads is a reasonable target for polyA+ libraries for bronchial brushes, HBE cells, and normal whole-lung tissue to assess gene expression. Moreover, this analysis only assessed host transcripts, so for studies involving nonhost RNAs or noncoding RNAs, read depths would need to be determined. Lastly, we used FPKM as a means to quantify gene abundance. The FPKM measure has been critiqued, particularly when mapping efficiency varies across samples (7), and thus other units of measurement have been recommended to quantify transcript abundance (8). To this end, we have deposited our raw data in the short read archive (PRJNA275422) to allow alternative analysis. Although the depth of sequencing will ultimately be determined by the goal of a project, the analysis presented here provides guidelines that are useful in defining parameters for RNA-seq experiments that in turn have the potential to improve the efficiency and cost-effectiveness of sequencing-based studies of these types of samples.
Acknowledgments
Acknowledgment
The authors acknowledge support through R01-HL69174 and the University of Pittsburgh Clinical & Translational Science Institute UL1 RR024153. This study used biological specimens and data provided by the Lung Tissue Research Consortium supported by the National Heart, Lung, and Blood Institute.
Footnotes
Author Contributions: Conception and design: A.R., J.L.K., S.W., and J.K.K.; analysis and interpretation: M.R., J.P.M., D.M.R., M.S.F., P.P.C, W.C., W.H., and J.K.K; patient accrual and compilation of demographic data: M.F.; drafting the manuscript for important intellectual content: M.R., J.P.M., D.M.R., G.T.-N., K.C., A.R., S.W., and J.K.K.
This letter has an online supplement, which is accessible from this issue's table of contents at www.atsjournals.org
Author disclosures are available with the text of this letter at www.atsjournals.org.
References
- 1.Mutz KO, Heilkenbrinker A, Lönne M, Walter JG, Stahl F. Transcriptome analysis using next-generation sequencing. Curr Opin Biotechnol. 2013;24:22–30. doi: 10.1016/j.copbio.2012.09.004. [DOI] [PubMed] [Google Scholar]
- 2.Chen K, Pociask DA, McAleer JP, Chan YR, Alcorn JF, Kreindler JL, Keyser MR, Shapiro SD, Houghton AM, Kolls JK, et al. IL-17RA is required for CCL2 expression, macrophage recruitment, and emphysema in response to cigarette smoke. PLoS ONE. 2011;6:e20333. doi: 10.1371/journal.pone.0020333. [DOI] [PMC free article] [PubMed] [Google Scholar]
- 3.Handley SA, Thackray LB, Zhao G, Presti R, Miller AD, Droit L, Abbink P, Maxfield LF, Kambal A, Duan E, et al. Pathogenic simian immunodeficiency virus infection is associated with expansion of the enteric virome. Cell. 2012;151:253–266. doi: 10.1016/j.cell.2012.09.024. [DOI] [PMC free article] [PubMed] [Google Scholar]
- 4.Moore WC, Bleecker ER, Curran-Everett D, Erzurum SC, Ameredes BT, Bacharier L, Calhoun WJ, Castro M, Chung KF, Clark MP, et al. National Heart, Lung, Blood Institute’s Severe Asthma Research Program. Characterization of the severe asthma phenotype by the National Heart, Lung, and Blood Institute’s Severe Asthma Research Program. J Allergy Clin Immunol. 2007;119:405–413. doi: 10.1016/j.jaci.2006.11.639. [DOI] [PMC free article] [PubMed] [Google Scholar]
- 5.Balzar S, Fajt ML, Comhair SA, Erzurum SC, Bleecker E, Busse WW, Castro M, Gaston B, Israel E, Schwartz LB, et al. Mast cell phenotype, location, and activation in severe asthma: data from the Severe Asthma Research Program. Am J Respir Crit Care Med. 2011;183:299–309. doi: 10.1164/rccm.201002-0295OC. [DOI] [PMC free article] [PubMed] [Google Scholar]
- 6.Toung JM, Morley M, Li M, Cheung VG. RNA-sequence analysis of human B-cells. Genome Res. 2011;21:991–998. doi: 10.1101/gr.116335.110. [DOI] [PMC free article] [PubMed] [Google Scholar]
- 7.Wagner GP, Kin K, Lynch VJ. Measurement of mRNA abundance using RNA-seq data: RPKM measure is inconsistent among samples. Theory Biosci. 2012;131:281–285. doi: 10.1007/s12064-012-0162-3. [DOI] [PubMed] [Google Scholar]
- 8.Lee S, Seo CH, Lim B, Yang JO, Oh J, Kim M, Lee S, Lee B, Kang C, Lee S. Accurate quantification of transcriptome from RNA-Seq data by effective length normalization. Nucleic Acids Res. 2011;39:e9. doi: 10.1093/nar/gkq1015. [DOI] [PMC free article] [PubMed] [Google Scholar]