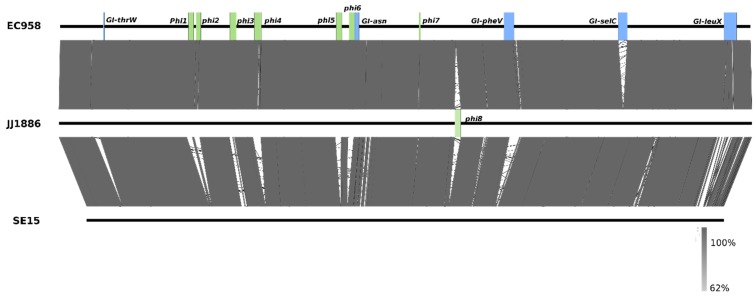
Figure 2.
BLASTn pairwise comparison of the genome sequences of EC958, JJ1886 (both clade C) and SE15 (Clade A). Major regions of variation in the structure and location of genomic islands (green) and prophage elements (blue) are indicated. Grey shading indicates nucleotide identity between sequences (62%–100%). Figure prepared using Easyfig [27].

