

Abstract
A wealth of physical interaction data between transcription factors (TFs) and DNA has been generated, but these interactions often do not have apparent regulatory consequences. Thus, equating physical interaction data with gene regulatory networks (GRNs) is problematic. Here, we comprehensively assay TF activity, rather than binding, to construct a network of gene regulatory interactions in the C. elegans intestine. By manually observing the in vivo tissue-specific knockdown of 921 TFs on a panel of 19 fluorescent transcriptional reporters, we identified a GRN of 411 interactions between 19 promoters and 177 TFs. This GRN shows only modest overlap with physical interactions, indicating that many regulatory interactions are indirect. We applied nested effects modeling to uncover information flow between TFs in the intestine that converges on a small set of physical TF-promoter interactions. We found numerous cell nonautonomous regulatory interactions, illustrating tissue-to-tissue communication. Altogether, our study illuminates the complexity of gene regulation in the context of a living animal.
Graphical abstract

Introduction
The correct expression of genes in space and time plays a critical role not only during development, but also in maintaining homeostasis and adapting to changing environmental or dietary conditions. The regulation of gene expression is accomplished, at a first level, by transcription factors (TFs) that physically bind regulatory sequences upstream within the promoter of their target genes, or at distal sites in enhancers. It is widely believed that the regulation of most metazoan genes occurs through the combined action of multiple TFs that work coordinately in complex gene regulatory networks (GRNs) to deliver proper gene expression programs.
The last decade has seen the generation of genome-scale data of physical interactions between TFs and regulatory DNA elements in a number of model organisms as well as in human cells. For instance, chromatin immunoprecipitation (ChIP) has been used extensively to obtain genome-wide interaction data for individual TFs in human cultured cells, yeast, flies and worms (e.g., Araya et al., 2014; Bernstein et al., 2012; Harbison et al., 2004; Sandmann et al., 2006; Tabuchi et al., 2011; Whittle et al., 2009). Other methods that have been used for the large-scale mapping of physical TF-DNA interactions include high-throughput yeast one-hybrid (Y1H) assays that identify the repertoire of TFs that can interact with individual regulatory elements of interest in a single experiment (e.g., Deplancke et al., 2006; Fuxman Bass et al., 2015; Gaudinier et al., 2011; Hens et al., 2011; Reece-Hoyes et al., 2013). Several studies suggest that many physical TF-DNA interactions lack an apparent regulatory consequence on gene expression (Hu et al., 2007; Jakobsen et al., 2007; Kemmeren et al., 2014; Sandmann et al., 2006; Vokes et al., 2008). Thus, equating TF binding with gene regulation, as has been done in numerous studies, is questionable, and it is critical that changes in gene expression resulting from loss of TF activity need to be identified and integrated with physical interaction networks (Walhout, 2011).
Large-scale efforts to generate TF-activity-driven regulatory networks in complex organisms lag behind the identification of physical TF-DNA interactions. Available regulatory interaction studies in yeast (Kemmeren et al., 2014), and in multicellular organisms such as the nematode C. elegans (Gracida and Eckmann, 2013; Kouns et al., 2011; Murphy et al., 2003; Quach et al., 2013) are TF-centered as they focus on gene expression changes elicited by the perturbation of individual TFs. However, since a major goal in systems biology is to understand the regulation of each gene in a genome of interest, it is remarkable that large-scale gene-centered studies that determine the repertoire of regulatory interactions for individual genes are not yet available.
We reasoned that using promoter reporters for multiple co-expressed genes together with TF RNAi in a single tissue in living animals may provide a first step toward the delineation of a GRN that is based on TF activity rather than binding and that is, therefore, truly regulatory in nature. We selected C. elegans as a model system because it is a multicellular organism that is amenable to large-scale RNAi screening for phenotypic characterizations (Kamath et al., 2003) and for detection of tissue-specific changes in reporter gene expression in living animals (Watson et al., 2013). We focused on the C. elegans intestine, a highly dynamic organ that serves not only to digest food, but also to fine tune metabolic processes and to respond to pathogenic insults. In addition, the intestine provides a technical advantage, as it is robustly sensitive to RNAi and easy to see by light microscopy, enabling visual screening.
Using 19 intestinal gene promoters, we delineate an in vivo TF activity based GRN comprising 411 interactions involving 177 TFs, indicating pervasive transcriptional regulation in the C. elegans intestine (Figure 1A, B). Interactions discovered by RNAi screening can be direct or indirect. We identify those interactions that are likely to be direct by comparing the regulatory interactions detected by RNAi to physical interaction data for the same promoters. In agreement with prior studies in other organisms (Hu et al., 2007; Jakobsen et al., 2007; Kemmeren et al., 2014; Sandmann et al., 2006; Vokes et al., 2008) we find limited overlap between regulatory and physical TF interactions for the same promoters, suggesting that many regulatory interactions are indirect. Cellular proteins often function in the context of complex signaling pathways and perturbation of genes that function within a pathway will result in similar regulatory effects on downstream genes. Indirect regulatory effects may therefore arise when TFs that regulate the expression of genes within a signaling pathway are perturbed. We applied nested effects modeling to the GRN to generate a hierarchical TF model that illuminates (indirect) information flow. We validate and refine this model by identifying cell-autonomous and nonautonomous effects, as well as several feedforward loops (FFL). Altogether, our findings indicate that regulatory networks may be wired via a complex hierarchy involving TFs and other types of regulators to maintain intestinal homeostasis.
Figure 1. Study Design.
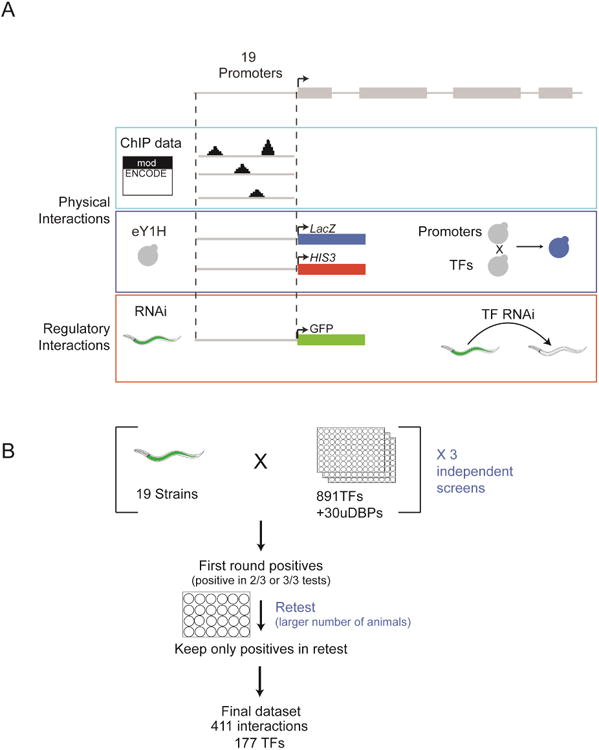
(A) 19 genes were selected for interaction mapping. The same promoters were used to identify regulatory and physical interactions. Physical interactions were curated from ModEncode data and obtained by eY1H screening. Regulatory interactions were obtained using fluorescent transcriptional reporters and knocking down individual TFs by RNAi followed by examining changes in fluorescent reporter protein levels in the intestine.
(B) Outline of RNAi screen. Each screen was performed in triplicate. Interactions that were recovered in at least 2 out of 3 screens were retested with a larger number of animals. See also Figure S1.
Results
A Tissue-Specific, Gene-Centered GRN Derived in Living Animals
We first generated a near-complete RNAi library of 921 C. elegans TFs that contains 891 of the 934 predicted TFs (95%) as well as 30 unconventional DNA binding proteins (uDBPs)(Table S1). As a starting point for in vivo GRN mapping, we selected 19 transgenic C. elegans strains in which GFP is expressed in the intestine. These strains were selected because they express sufficiently high levels of GFP to enable visual screening by light microscopy. Overall, the set of transgenes represents different aspects of intestinal biology, including responses to diet, oxidative stress, and the unfolded protein response and include promoters of both protein-coding and microRNA genes. While all strains express GFP (or wCherry) in the gut, most also exhibit GFP expression in other tissues (Figure S1).
We decided to perform a visual, qualitative screen in which we assessed changes in fluorescent protein levels upon TF perturbation at the L4/young adult stage of development. We performed a qualitative screen because we aimed to delineate interactions in a single tissue in living animals. There are no methods available to quantify GFP levels in only one tissue when the fluorescent protein is also expressed in other tissues. Since the reporters used express GFP in multiple tissues, GFP quantification in whole animals would be misleading. For instance, if GFP goes down 50% in the gut but is also expressed in another tissue where it does not change, whole-animal quantification would be meaningless. Finally, since RNAi may not result in a complete knockdown it would be challenging to interpret quantitative data.
To ensure high quality GRN data, we performed the screens blindly, three independent times. Interactions detected at least twice were extensively retested on larger plates with a greater number of animals. To ensure a low rate of false positives, only interactions that were confirmed during retesting were kept in the final dataset (Figure 1B).
We combined all regulatory interactions into a first-level, TF-activity-driven GRN comprising 411 interactions between 19 gene promoters and 177 TFs (Figure 2A, Table S2). Most (87%) interactions are activating (GFP down after RNAi), suggesting that transcriptional activation is more prominent in the C. elegans intestine than repression, or that activation may be more readily identified by our visual screening method. The number of regulatory interactions observed per promoter ranges from 10 to 55 and the median is 18 TFs. Thus, all promoters receive regulatory input through the activity of multiple TFs, either directly or indirectly.
Figure 2. A TF-Activity-Based C. elegans GRN.
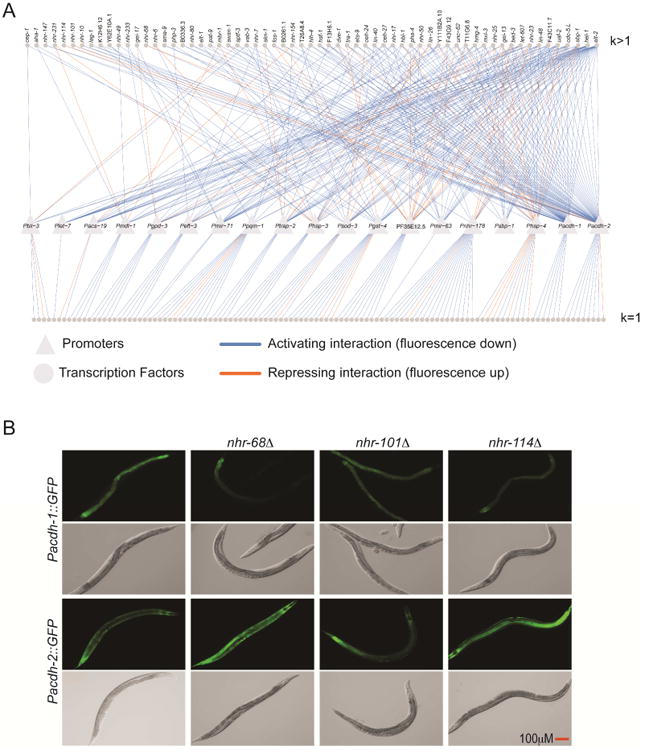
(A) GRN depicting regulatory interactions identified by TF RNAi. Triangles indicate the 19 target promoters. Circles indicate the TFs regulating these promoters in the intestine. k indicates the out-degree, or the number of promoters regulated by each TF in the intestine. Blue edges are activating interactions (intestinal GFP down upon TF RNAi) and orange edges are repressive interactions (intestinal GFP up upon TF RNAi). TFs regulating a single target gene (bottom row) are not labeled.
(B) Validation of regulatory interactions. Changes in GFP expression in Pacdh-1∷GFP and Pacdh-2∷GFP animals following knockdown of a family of closely related NHRs was validated by crossing nhr-68, nhr-101 or nhr-114 deletion mutations into Pacdh-1∷GFP or Pacdh-2∷GFP strains. Based on the RNAi screen, we expected loss-of-function mutations in each of the three TFs to decrease GFP expression driven by Pacdh-1 and increase expression driven by Pacdh-2, in the intestine.
To validate the RNAi approach, we used mutants of three highly similar nuclear hormone receptor (NHR) paralogs, nhr-68, nhr-101 and nhr-114, which have identical regulatory interaction profiles in the GRN (Table S2). We crossed each mutation into reporter strains where GFP expression is driven by the acdh-1 promoter (Pacdh-1∷GFP) or the acdh-2 promoter (Pacdh-2∷GFP), and observed very similar effects as we did by RNAi—namely, decreased fluorescence of Pacdh-1∷GFP and increased fluorescence of Pacdh2∷GFP (Figure 2B). These results demonstrate that the interactions detected by RNAi were not the result of off-target effects.
Assessing Cell-Autonomous Gene Regulation
Many of the 177 TFs in the GRN are expressed in the intestine, especially those that regulate two or more promoters (Figure S2). However, several TFs are not expressed in the gut, but did affect promoter activity in this tissue (Table S3). For instance, LIN-26 is expressed in the hypodermis, and not in the intestine, and its perturbation confers hypodermal phenotypes (Labouesse et al., 1994). The observation that intestinal expression of five target promoters is decreased following lin-26 knockdown suggests that LIN-26 regulates one or more genes in the hypodermis that, directly or indirectly, propagate(s) a signal to the intestine to which intestinal genes respond.
To distinguish cell-autonomous from cell non-autonomous effects, we examined the consequences of knocking down TFs only in the intestine. We used an rde-1 mutant strain that is RNAi defective, but in which rde-1 has been rescued only in the intestine (Espelt et al., 2005). As a result, these animals are refractory to RNAi in all tissues, except the intestine. We crossed one of the most extensively regulated promoters, Pacdh-1∷GFP, into this strain and performed RNAi on 44 of the TFs that regulate this promoter in wild type animals. Knockdown of 28 of these TFs resulted in reduction in intestinal GFP levels as in wild type animals, indicating that they function cell-autonomously to regulate Pacdh-1∷GFP (Figure 3A). In this experiment, the other 16 TFs, including LIN-26, did not affect this promoter (Figure 3A). Although we cannot discount differences in RNAi efficiency in wild type and rde-1-rescued animals, this suggests that these TFs may function cell non-autonomously to regulate Pacdh-1∷GFP.
Figure 3. Identifying Cell-Autonomous Regulatory Interactions.
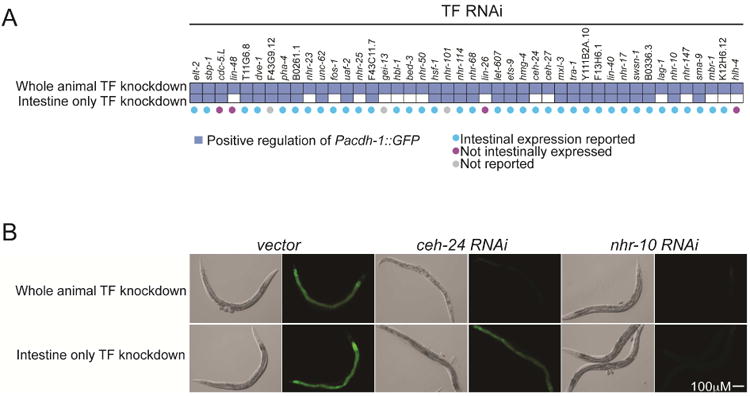
(A) Matrix indicates effects of whole animal (top row) and intestine-specific knockdown (bottom row) on GFP expression in Pacdh-1∷GFP transgenic animals. Reported expression of TFs knocked down is indicated below matrix. ‘Not reported’ indicates that TF expression was not reported in large-scale intestine-specific expression profiling and a transcriptional reporter for TF expression has not been described.
(B) GFP expression in Pacdh-1∷GFP animals is shown following knockdown of the indicated TFs (vector indicates negative control) either in the whole animal (top row) or by intestine-specific knockdown (bottom row). As an example, nhr-10 RNAi effects are cell autonomous, whereas ceh-24 RNAi affects Pacdh-1∷GFP through a non-cell autonomous mechanism. Matching differential interference contrast (DIC) images are shown to the left of fluorescent images.
Knockdown of some of these TFs may confer phenotypes that in turn induce changes in acdh-1 promoter activity. For instance, whole-animal knockdown of ceh-24 caused animals to become paralyzed and dramatically decreased acdh-1 promoter activity. However, intestine-specific ceh-24 knockdown affected neither movement nor acdh-1 promoter activity (Figure 3B). Whole animal knockdown of ceh-24 likely affects the ability of the animal to eat and induces a starvation state, which is known to result in decreased acdh-1 promoter activity (MacNeil et al., 2013). Indeed, knockdown of ceh-24 also affected levels of GFP expressed from two other starvation-response promoters, Pacdh-2∷GFP and Psod-3∷GFP (Table S2).
Modest Overlap Between Regulatory and Physical Interactions
To determine which of the regulatory interactions are likely direct, we compared the GRN to physical interactions between TFs and gene promoters detected by ChIP by the modENCODE project (Gerstein et al., 2014), by previously reported Y1H assays (Arda et al., 2010) or newly identified by enhanced Y1H assays (Reece-Hoyes et al., 2011)(Table S2). In agreement with previous observations (Kemmeren et al., 2014; Yang et al., 2006), we found that only a small subset of physical interactions had an apparent regulatory consequence in the intestine. However, it is important to note that physical interactions may confer a regulatory effect in tissues that were not examined in this study or at developmental times not examined.
We also found that the majority of regulatory interactions detected by RNAi do not have an apparent physical basis (Figure 4A). While missed interactions (false-negatives) in Y1H assays or ChIP may potentially explain some of this (Walhout, 2011), it is unlikely the full explanation because many of the TFs involved in these regulatory interactions were detected in physical interaction screens. Instead, these observations indicate that many regulatory interactions in the GRN are indirect. Indeed, TF cascades or hierarchies have been reported in a number of systems (Jothi et al., 2009; Martinez-Antonio et al., 2012; Yu and Gerstein, 2006). In such hierarchies, the perturbation of a TF that resides high in the hierarchy would affect the expression or activity of TFs in lower tiers.
Figure 4. A Hierarchical TF Model of Information Flow in the C. elegans intestine.

(A) Overlap between regulatory and physical interactions. Green indicates TFpromoter interactions that are both physical and regulatory. Physical interactions were obtained from Y1H screens performed here and reported elsewhere and from ChIP experiments from the modENCODE project. Top bars represent overlap in all tested interactions. Bottom bars represent interactions involving only TFs that produced positive interactions in both assays. P-values (hypergeometric) are shown.
(B) Cartoon depicting the principle of nested effects modeling followed by transitive reduction. Example interaction data is shown with the resulting predicted model. Note that the model includes only TFs and not the target genes. Targets of TF3 are nested within the targets of TF2, whose targets are in turn nested within the targets of TF1, resulting in the model shown.
(C) Hierarchical TF model generated by nested effects modeling using regulatory interactions identified by RNAi. Larger nodes represent super-nodes that include more than one TF.
(D) Removal of all regulatory interactions involving any individual promoter does not greatly affect the hierarchical TF model. Interactions recovered for each individual target were removed and the hierarchical TF model was recalculated by nested effects modeling. The fraction of edges maintained in these models, relative to the complete model is shown.
(E) TF pairs connected by an edge in the hierarchical TF model exhibit greater co-expression across a large panel of expression profiling experiments than unconnected TF pairs (p<0.003, rank-sum test). See also Figure S2.
(F) Fraction of TFs in leaves or central nodes (non-leaves) in network displaying lethal phenotypes.
Inferring Gene Regulatory Information Flow by Nested Effects Modeling
To elucidate the flow of information between TFs, we used nested effects modeling (Markowetz et al., 2007)(Figures 4B and 4C). This approach leverages high-dimensional phenotype data for a set of mutants (here changes in fluorescent protein levels in the 19 reporter strains caused by TF knockdown) to infer hierarchical relationships (here among TFs) and results in a ‘hierarchical TF model’. Briefly, the hierarchy is built by analyzing the overlap in effects caused by perturbation of each TF; TFs that have a larger set of target genes are assumed to be at the top of the hierarchy (Figure 4B). TFs are connected by an edge when the targets of that TF are contained or ‘nested’ within the targets of the TF higher in the hierarchy. The modeling can only robustly place TFs that regulate two or more target genes in the hierarchy (62 of the 177, Figure 4C). TFs that were indistinguishable in their regulatory interaction profile were collapsed into ‘super-nodes’ (Figure 4C).
An important question is whether only using 19 target promoters is sufficient to obtain reliable information about regulatory information flow in the C. elegans intestine. We first addressed this question by testing the overall stability of the hierarchical TF model. We removed each individual promoter and its interactions from the GRN, regenerated the hierarchical TF model by nested effects modeling, and compared the fraction of edges maintained relative to the complete model (Figure 4D). In all cases, the majority of edges were retained, indicating that the hierarchical TF model can tolerate minor variations in the set of interactions used to construct it, and that only using 19 promoters generates a robust model.
Large-scale computational methods have been used extensively to infer regulatory networks based on co-expression of a TF and its target genes. We used co-expression scores of TF pairs across a large panel of expression profiling data (Reece-Hoyes et al., 2013), to examine co-expression of TFs and target genes as well as between TFs connected in the hierarchical TF model. We did not observe significant co-expression between TFs and the target genes in the GRN. However, we did find that TFs connected by edges in the hierarchical TF model are more co-expressed than TFs that are not connected (Figure 4E, p < 0.003, rank sum test), suggesting that the TF hierarchical model predicted meaningful relationships between TFs.
Finally, perturbation of nodes at the top of the hierarchy would be expected to have more detrimental effects than the disruption of TFs at the bottom layers. Indeed, the master regulator of intestinal development and gene expression, ELT-2 (McGhee et al., 2009), activates all 19 promoters and is placed at the top of the TF hierarchy (Figure 4C). Further, TFs that do not connect to downstream TFs (the ‘leaves’) are depleted in lethal phenotypes (p< 0.01, Figure 4F, Table S4). Altogether these observations indicate that, by using only 19 test promoters we robustly captured information flow between a subset of intestinal TFs.
A Complex Regulatory Path Inferred From the Hierarchical TF Model
To further validate the hierarchical TF model, we focused on the path that connects CDC-5.L to the super-node harboring NHR-68 via SBP-1 and Y111B2A.10, an uncharacterized C2H2 zinc finger TF (Figure 5A). The sbp-1 promoter was part of the 19 test promoters and indeed, we found that it is activated by CDC-5.L (Figure 5B). Nested effects modeling does not consider the identity of promoters used. Therefore, this observation provides validation of the regulatory interaction predicted by the hierarchical TF model. We further explored the phenotype of CDC-5.L given that our GRN and nested effects modeling implicated this uncharacterized gene as an important regulator of intestinal gene expression. Of the 13 promoters regulated by CDC-5.L, eleven are also regulated by SBP-1, suggesting that these TFs have similar effects on gene expression and, perhaps, physiology (Table S2).
Figure 5. Validation of the Hierarchical TF Model.
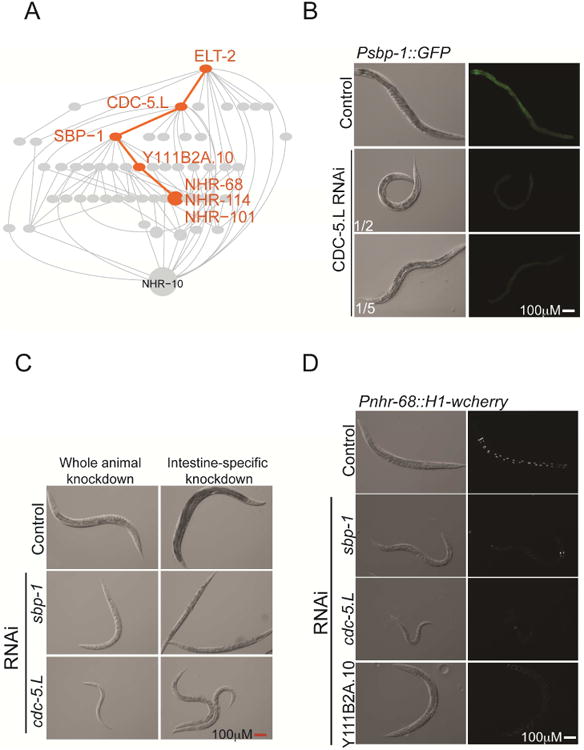
(A) A path (highlighted in orange) in the predicted hierarchical TF model (grey) was selected for validation.
(B) CDC-5.L activates the sbp-1 promoter. Fractions indicate dilution of bacteria producing double stranded cdc-5.L RNA with bacteria producing vector alone (to circumvent lethality). DIC images are shown to the left of fluorescent images.
(C) Systemic knockdown of cdc-5.L causes dramatic effects on growth and development (left) whereas intestine-specific cdc-5.L knockdown results in a less severe phenotype that phenocopies sbp-1, consistent with cdc-5.L functioning in the intestine to regulate SBP-1 but also playing roles outside of the intestine.
(D) Knockdown of TFs in a Pnhr-68 reporter strain that expresses nuclear cherry fluorescent protein. Matching DIC photos are shown to the left of fluorescent images.
We performed RNAi of cdc-5.L in the intestine, which resulted in thin and pale animals, phenocopying sbp-1 knockdown (Figure 5C). While cdc-5.L expression in the intestine was not reported (Table S3), its intestine-specific knockdown affects the acdh-1 promoter, and results in dramatic phenotypic consequences, indicating that it does function within the gut (Figure 3A). Indeed, a recent study detects cdc-5.L mRNA in the intestine, albeit at low levels (Blazie et al., 2015).
Using Pnhr-68∷H1wcherry as a reporter (Murray et al., 2012), we found that RNAi of either cdc-5.L, sbp-1 or Y111B2A.10 resulted in reduced fluorescent protein expression (Figure 5D), which, together with the above described regulation of Psbp-1∷GFP by CDC-5.L, supports the regulatory path predicted by the hierarchical TF model.
NHR-10 Functions in the Context of Feed-Forward Loops
Next we focused on NHR-10, which directly binds to and activates Pacdh-1 (Arda et al., 2010; MacNeil et al., 2013, this study). Intestine-specific nhr-10 knockdown reduced acdh-1 promoter activity (Figure 6A), indicating that this TF does function within the gut. The hierarchical TF model places most other TFs that regulate acdh-1 in the intestine upstream of NHR-10. To test whether these TFs regulate acdh-1 indirectly by activating nhr-10, we first generated a Pnhr-10∷GFP reporter strain. In agreement with the observation that NHR-10 functions within the intestine, we observed that its promoter drives GFP expression in the gut, as well as in other tissues (Figure S3).
Figure 6. NHR-10 is Involved in Feed-Forward Loops.

(A) Matrix indicating the TFs that regulate acdh-1, acdh-2 and nhr-10 promoters. Regulation of Pacdh-1∷GFP in the absence of NHR-10 is shown at the bottom.
(B) Examples of feedforward loops involving NHR-10. See also Figure S3.
We knocked down the 27 TFs that regulate acdh-1 in the intestine and found that 13 TFs also activate the nhr-10 promoter (Figures 6A and S3), suggesting that they may function indirectly to activate the acdh-1 promoter by regulating nhr-10 (Figure S2). One of these TFs, B0336.3, was placed with NHR-10 in a super-node, but can now be placed upstream.
To test whether the 13 TFs that regulate both acdh-1 and nhr-10 require NHR-10 to regulate Pacdh-1, we crossed the Pacdh-1∷GFP transgene into an nhr-10 deletion (null) mutant (tm4695). Notably, knockdown of each of these 13 TFs reduced GFP expression in the intestine in the absence of NHR-10 (Figure 6A), strongly suggesting that they function in the context of FFLs together with NHR-10 to regulate acdh-1 expression (Figure 6B). Nested-effects models are not designed to identify FFLs and we suspect there are many instances of FFLs connecting TFs at the top of the hierarchy to other TFs as well as to the target promoters. For instance, ELT-2 physically binds and activates many intestinal gene promoters, including TFs (McGhee et al., 2007, this study) and is therefore also a component of numerous FFLs.
Terminal Nodes in the TF Hierarchy Often Correspond to Physical Interactions
TFs can regulate other TFs by directly regulating their expression, but also indirectly by affecting the expression of other genes that influence the activity or stability of the TF (Figure 7A). In this study, we used gene promoters to identify regulators of gene expression, which ultimately will occur through a physical interaction with a TF. Thus, we predicted that hierarchical TF network paths would terminate at physical interactions between the TFs and promoters.
Figure 7. Integrating Regulatory and Physical interactions.

(A) Cartoon depicting a hypothetical cellular pathway (left), the regulatory interactions it would confer (middle), and the resulting predicted hierarchy with terminal nodes (right).
(B) Paths leading to physical interactions displayed by promoter. Only promoters for which we identified interactions that were both physical and regulatory in the Intestinal Hierarchical TF model are shown. Color indicates target gene, colored lines indicate regulatory paths in the model that include TFs that physically interact with the target promoter. All TFs connected by a colored line act as regulators of the indicated (by color) target genes. TFs that represent the last node in a regulatory path to the target gene (terminal nodes) are boxed. Not all paths leading to the NHR-10 super-node are colored for visual clarity (some red and orange lines have been removed).
Indeed, TF-promoter regulatory interactions of terminal nodes (defined here as the last node in a path that regulates a target gene) are 2.5 times more likely to overlap with physical protein-DNA interactions than non-terminal nodes (p = 0.01) (Figures 7A and 7B, Table S5). However, TF-TF edges within the hierarchical model do not significantly overlap with physical interactions between TFs and TF-promoters. Thus, TF-TF edges in the hierarchical model can either be explained by transcriptional regulation or largely involve indirect, posttranscriptional regulation through other regulatory moieties such as RNA binding proteins, kinases or phosphatases.
Conclusion
Here we show that combining TF perturbations with promoter reporter strains and nested effects modeling enables the first-pass delineation of the structure of GRNs that control gene expression in a tissue of interest. Applying nested effects modeling to the GRN unveiled a complex information flow between intestinal TFs that likely includes non-transcriptional regulatory mechanisms. By integrating physical TF-promoter interactions, GRN building blocks such as FFLs can be incorporated into the networks.
We could only place the TFs that regulate multiple promoters in the model. Therefore, we anticipate that future experiments with additional transgenes will further expand and refine both the GRN and the TF hierarchy. Future RNAi screens with additional types of regulators such as signaling molecules or RNA binding proteins will provide more insight into the detailed mechanisms of indirect regulation for the genes tested. Altogether, RNAi in living animals with specific sets of gene promoters, combined with nested effects modeling provides a powerful method to derive tissue-specific GRNs and TF hierarchies that connect specific regulatory elements to TF functionality.
Methods
TF RNAi library construction
The C. elegans genome encodes 934 TFs (Reece-Hoyes et al., 2005) as well as 30 unconventional DNA binding proteins (Deplancke et al., 2006) (uDBPs), proteins that have been retrieved in Y1H assays but that do not possess a recognizable DNA binding domain. For simplicity, we refer to these combined as TFs. We generated a comprehensive TF RNAi library containing 891 TFs (95%) and all uDBPs.
The TF RNAi library was constructed using open reading frame (ORF) clones from the C. elegans ORFeome (Reboul et al., 2003), supplemented with cloned ORFs that were generated in-house. ORFs were cloned into the L4440-Dest-RNAi vector by Gateway LR cloning (Walhout et al., 2000). Plasmids containing TF ORFs were purified and transformed into E. coli HT115 bacteria, grown in Luria broth (LB)+ 15 mg/mL tetracycline + 50 mg/mL ampicillin and frozen in 5% glycerol in 96-well plates. 71 clones were obtained from the Ahringer RNAi library (Kamath et al., 2003) and five were obtained from the ORFeome RNAi library (Rual et al., 2004). GFP- or mCherry-containing clones (positive controls) and empty L4440 vector (negative control) were included in each plate for screening.
C. elegans strains
We used 19 transgenic strains that express a fluorescent protein in the intestine as a starting point for in vivo GRN mapping. These strains harbor gene promoters that drive expression in the intestine; some reporters are predominantly intestinal while others exhibit a broader expression pattern that includes the gut (Figure S1). Pbli-3∷GFP, Pnhr-10∷GFP, Pgpd-3∷GFP and Pacs-19∷GFP were constructed by gateway cloning of promoterome clones into pDEST-DD04 (Dupuy et al., 2004). Pgpd-3 is the promoter for mai-1, gpd-2 and gpd-3, which reside together in an operon. The final constructs express GFP from the promoter of interest and contain a wild type unc-119 ORF. These constructs were introduced into unc-119(ed2) worms by biolistic bombardment (Praitis et al., 2001). The Pnhr-10∷GFP transgene was integrated into the genome by UV irradiation (Evans, 2006) and outcrossed three times with N2. nhr-101(gk586) and nhr-114(gk849) were obtained from the CGC and outcrossed three times with N2. Following outcrossing, both alleles were crossed to VL749 and VL750 to generate VL1126 [nhr-101(gk586); wwIs24[Pacdh-1∷GFP + unc-119(+)], VL1127 [nhr-114(gk849); wwIs24[Pacdh-1∷GFP + unc-119(+)], VL1124 [nhr-101(gk586); wwIs25[Pacdh-2∷GFP + unc-119(+)], and VL1125 [nhr-114(gk849); wwIs25[Pacdh-2∷GFP + unc-119(+)]]. nhr-68(gk708); wwIs24[Pacdh-1∷GFP + unc-119(+)] was described previously (Watson et al., 2013). RW10732, which carries the nhr-68∷H1-wCherry transgene (stIs10507[nhr-68∷H1-wCherry +unc-119(+)]) was obtained from the CGC. All other strains are described elsewhere.
Strains for intestine-specific RNAi were generated by crossing Pacdh-1∷GFP males with VP303 rde-1(ne219);kbIs7[nhx-2p∷rde-1 + rol-6(su1006)] hermaphrodites (Espelt et al., 2005). To select for the rde-1 mutation, F1 animals were placed on lin-26 RNAi. lin-26 RNAi results in completely penetrant larval arrest and lethality when a wild type copy of rde-1 is present in the hypodermis. Thus, viable GFP-positive adult rollers selected in the F2 generation are animals that carry the rde-1 mutation, and also carry the intestine-specific rde-1 as marked by the rol-6 dominant mutant transgene. Pacdh-1∷GFP and the rde-1; rol-6 array were homozygosed. The resulting strain, VL1097 [kbIs7[nhx-2p∷rde-1 + rol-6(su1006)]; wwIs24[Pacdh-1∷GFP + unc-119(+)] was again verified for resistance to lin-26 RNAi.
RNAi screening
We knocked down each individual TF in all strains in three independent experiments. We visually scored increases or decreases in fluorescent protein expression in the intestine at the L4 larvae/young adult stages. Thus altogether, we tested 17,499 potential TF-promoter interactions in triplicate. Interactions that were found two or three times were retested and only those interactions that retested were kept in the final dataset.
Bacteria harboring TF RNAi clones were inoculated into LB + 50 μg/mL ampicillin in 96-well deep-well dishes and grown overnight at 37°C. The following day, fresh cultures were inoculated in 96-well deep-well dishes with 50 μL of overnight culture in 1 mL of LB + ampicillin. Cultures were grown for 6 hours (to an OD600 of approximately 0.8) and bacteria were pelleted and resuspended in 1/10 of the original volume in M9 buffer. 10 μL of the bacterial suspension was added to each well of a 96-well Nematode Growth Media (NGM) agar plate containing 5 mM Isopropyl β-D-thiogalactopyranoside (IPTG) and 50 μg/mL ampicillin. Plates were dried and seeded with 20-30 eggs per well. When wells contained a mix of L4 and young adults, animals were screened visually on a fluorescence-enabled dissection microscope for increases or decreases in fluorescence in the intestine. Knockdowns were scored as positive if most animals in the well displayed a change in intestinal GFP or mCherry expression. Changes in expression in other tissues were not recorded. Each transgenic strain was screened three independent times. For each individual screen, bacterial cultures were grown independently and wells were scored in an unbiased manner, i.e., without knowledge of the results of previous screens. All interactions detected in at least two of three independent screens were tested a fourth time in 24-well plates using 50 animals per well. Clones that failed to pass this retest were not considered true hits. Following the first round of screening, we collected those RNAi clones that regulated two or more transgenes and rescreened all 19 transgenic strains following knockdown of these factors in 24-well dishes to generate a high-confidence dataset. All RNAi clones included in the final dataset were sequence-verified.
Using eggs as a starting point in the screens enabled us to circumvent embryonic lethality. Nevertheless, knockdown of several TFs resulted in larval arrest or severe sickness. In order to include these TFs in our screens, we performed serial dilution of bacteria carrying dsRNA delivery vectors for elt-2, sbp-1, uaf-2, hel-1, let-607, hbl-1, nhr-23, bed-3, cdc-5.L and lin-26 with bacteria containing the vector alone. By doing so, we were able to observe changes in GFP expression in adult animals.
eY1H assays
eY1H assays were performed as described (Reece-Hoyes et al., 2011). ELT-2 binding to each of the 19 gene promoters was assayed by transforming haploid yeast bait strains with a construct encoding an AD-ELT-2 prey, as we have found that GATA factors are frequently missed in mating-based eY1H assays.
ChIP data
ChIP data were obtained from the modENCODE website (www.modencode.org) and interactions were included as positive if the ChIP peak region observed was within the promoter sequence used in our analysis.
Intestinally expressed TFs
The list of TFs expressed in the intestine was compiled using available data (McGhee et al., 2007; Pauli et al., 2005). From the McGhee data we selected those genes with two or more SAGE counts. Additional intestinal expression information was obtained by manual curation of expression patterns available in WormBase (www.wormbase.org) and other published reports. TFs were considered intestinally expressed if they were retrieved in either gene expression dataset or if an expression pattern was reported that included the intestine. TFs were considered ‘not intestinal’ if an expression pattern was reported that did not include the intestine.
Lethal phenotypes
Lethal phenotypes were curated based on data reported by wormbase (www.wormbase.org). Genes annotated with the following phenotypes were considered to confer a lethal phenotype: larval lethal, lethal, embryonic lethal.
Generation of hierarchical TF models
Models were generated using the nested effects modeling algorithm (Markowetz et al., 2007) using a false positive (FP) rate of 0.01 and a false negative (FN) rate of 0.469. These rates were determined based on the reproducibility of interactions across individual screens. Briefly, we considered as “gold standard” those RNAi interactions that were found in at least two of the three replicate screens. These gold standard interactions could then be used to estimate the FP and FN rate for each individual RNAi screen. Specifically, interactions that were only detected in one of the replicates are considered FP and interactions that were missed in one of the replicates but found in the other two are designated FN. The FP and FN estimates were then averaged across the three screens to derive average perscreen FP and FN rates. To estimate the FP and FN rates in the final dataset, i.e., after requiring the interactions to appear in 2 of the 3 initial screens as well as the retest (see above), we calculated the probability of observing false negatives or false positives based on the per-screen quality estimates, assuming independence of the 3 screens and retest, which resulted in final FP and FN rates of 0.0005 and 0.469, respectively. It is important to note that the true, biological false negative rate is likely to be lower than this estimate, since the final retest involved a matrix experiment in which each transgenic strain was tested versus RNAi of each the 63 TFs that regulate at least two promoters (see above). We used a conservative FP estimate of 0.01 for the nested effects modeling in order to make the modeling process more flexible. Additionally, the “triples_threshold” parameter was set to 0.95 to ensure a small degree of flexibility during modeling. We performed a transitive reduction of edges to facilitate the visual interpretation of the resulting hierarchical network model. The model was generated by using data from all TFs with at least two RNAi interactions (except hel-1 which likely regulates RNA export) (MacMorris et al., 2003). Importantly, the resulting model is highly robust because the global structure is largely maintained at a range of different error rates (i.e., more than 85% of the edges are included). Further, at different FN rates (0.45, 0.40, 0.30, 0.20) we consistently observed enriched coexpression between TFs connected by an edge in the hierarchical models, as well as an enrichment of lethal phenotypes in non-terminal TFs. Thus, our results are not sensitive to the selected parameter settings used in the modeling.
Terminal node analysis
We hypothesized that TFs lower in the hierarchy may be more likely to affect the expression of reporters by direct physical binding, whereas TFs placed higher in the hierarchy would be more likely affecting the target genes indirectly, through a cascade of interactions with TFs in lower levels. To test this hypothesis, we contrasted the overlap of RNAi interactions with protein-DNA interactions between terminal and non-terminal nodes of the intestine-specific TF hierarchical model. For each of the reporters, we defined a sub-graph of the TF model consisting of TFs that reported a RNAi interaction with that reporter. In each sub-graph, we defined as terminal nodes those that did not have any outgoing edge (i.e., the leaves of the sub-graph) and the remaining nodes as non-terminal (Table S5). Sub-graphs containing only a single node were not included. Next, we calculated the total number of RNAi interactions that overlapped with physical interactions for terminal and nonterminal nodes across the subgraphs and performed a hypergeometric test to evaluate if the overlap was significantly higher among terminal nodes.
Supplementary Material
Acknowledgments
We thank members of the Walhout laboratory and Sander van den Heuvel for discussions and critical reading of the manuscript. Some nematode strains were provided by the Caenorhabditis Genetics Center (CGC), which is funded by the NIH Office of Research Infrastructure Programs (P40 OD010440). This work was supported by NIH grant GM082971 to A.J.M.W. and C.L.M. and a CIHR post-doctoral fellowship to L.T.M.
Footnotes
Author contributions. L.T.M. and A.J.M.W. designed the study. L.T.M. and E.A. generated strains and performed the Pacdh-1∷GFP screen. G.G. integrated the Pnhr-10∷GFP transgene into the genome. All other experiments were performed by L.T.M. C.P. performed all modeling, under supervision from C.L.M. L.T.M. and A.J.M.W. wrote the paper. All authors discussed the results and edited the manuscript prior to submission.
The authors declare no competing financial interests.
Publisher's Disclaimer: This is a PDF file of an unedited manuscript that has been accepted for publication. As a service to our customers we are providing this early version of the manuscript. The manuscript will undergo copyediting, typesetting, and review of the resulting proof before it is published in its final citable form. Please note that during the production process errors may be discovered which could affect the content, and all legal disclaimers that apply to the journal pertain.
References
- Araya CL, Kawli T, Kundaje A, Jiang L, Wu B, Vafeados D, Terrell R, Weissdepp P, Gevirtzman L, Mace D, et al. Regulatory analysis of the C. elegans genome with spatiotemporal resolution. Nature. 2014;512:400–405. doi: 10.1038/nature13497. [DOI] [PMC free article] [PubMed] [Google Scholar]
- Arda HE, Taubert S, Conine C, Tsuda B, Van Gilst MR, Sequerra R, Doucette-Stam L, Yamamoto KR, Walhout AJM. Functional modularity of nuclear hormone receptors in a C. elegans gene regulatory network. Molecular Systems Biology. 2010;6:367. doi: 10.1038/msb.2010.23. [DOI] [PMC free article] [PubMed] [Google Scholar]
- Bernstein BE, Birney E, Dunham I, Green ED, Gunter C, Snyder M. An integrated encyclopedia of DNA elements in the human genome. Nature. 2012;489:57–74. doi: 10.1038/nature11247. [DOI] [PMC free article] [PubMed] [Google Scholar]
- Blazie SM, Babb C, Wilky H, Rawls A, Park JG, Mangone M. Comparative RNA-Seq analysis reveals pervasive tissue-specific alternative polyadenylation in Caenorhabditis elegans intestine and muscles. BMC Biol. 2015;13:4. doi: 10.1186/s12915-015-0116-6. [DOI] [PMC free article] [PubMed] [Google Scholar]
- Deplancke B, Mukhopadhyay A, Ao W, Elewa AM, Grove CA, Martinez NJ, Sequerra R, Doucette-Stam L, Reece-Hoyes JS, Hope IA, et al. A gene-centered C. elegans protein-DNA interaction network. Cell. 2006;125:1193–1205. doi: 10.1016/j.cell.2006.04.038. [DOI] [PubMed] [Google Scholar]
- Dupuy D, Li Q, Deplancke B, Boxem M, Hao T, Lamesch P, Sequerra R, Bosak S, Doucette-Stam L, Hope IA, et al. A first version of the Caenorhabditis elegans promoterome. Genome Res. 2004;14:2169–2175. doi: 10.1101/gr.2497604. [DOI] [PMC free article] [PubMed] [Google Scholar]
- Espelt MV, Estevez AY, Yin X, Strange K. Oscillatory Ca2+ signaling in the isolated Caenorhabditis elegans intestine: role of the inositol-1,4,5-trisphosphate receptor and phospholipases C beta and gamma. J Gen Physiol. 2005;126:379–392. doi: 10.1085/jgp.200509355. [DOI] [PMC free article] [PubMed] [Google Scholar]
- Evans TC. Transformation and microinjection. Wormbook 2006 [Google Scholar]
- Fuxman Bass JI, Sahni N, Shrestha S, Garcia-Gonzalez A, Mori A, Bhat N, Yi S, Hill DE, Vidal M, Walhout AJ. Human gene-centered transcription factor networks for enhancers and disease variants. Cell. 2015;161:661–673. doi: 10.1016/j.cell.2015.03.003. [DOI] [PMC free article] [PubMed] [Google Scholar]
- Gaudinier A, Zhang L, Reece-Hoyes JS, Taylor-Teeples M, Pu L, Liu Z, Breton G, Pruneda-Paz JL, Kim D, Kay SA, et al. Enhanced Y1H assays to elucidate Arabidopsis gene regulatory networks. Nature Methods. 2011;8:1053–1055. doi: 10.1038/nmeth.1750. [DOI] [PMC free article] [PubMed] [Google Scholar]
- Gerstein MB, Rozowsky J, Yan KK, Wang D, Cheng C, Brown JB, Davis CA, Hillier L, Sisu C, Li JJ, et al. Comparative analysis of the transcriptome across distant species. Nature. 2014;512:445–448. doi: 10.1038/nature13424. [DOI] [PMC free article] [PubMed] [Google Scholar]
- Gracida X, Eckmann CR. Fertility and germline stem cell maintenance under different diets requires nhr-114/HNF4 in C. elegans. Current biology. 2013;23:607–613. doi: 10.1016/j.cub.2013.02.034. [DOI] [PubMed] [Google Scholar]
- Harbison CT, Gordon DB, Lee TI, Rinaldi NJ, Macisaac KD, Danford TW, Hannett NM, Tagne JB, Reynolds DB, Yoo J, et al. Transcriptional regulatory code of a eukaryotic genome. Nature. 2004;431:99–104. doi: 10.1038/nature02800. [DOI] [PMC free article] [PubMed] [Google Scholar]
- Hens K, Feuz JD, Iagovitina A, Massouras A, Bryois J, Callaerts P, Celniker S, Deplancke B. Automated protein-DNA interaction screening of Drosophila regulatory elements. Nat Methods. 2011;8:1065–1070. doi: 10.1038/nmeth.1763. [DOI] [PMC free article] [PubMed] [Google Scholar]
- Hu Z, Killion PJ, Iyer VR. Genetic reconstruction of a functional transcriptional regulatory network. Nat Genet. 2007;39:683–687. doi: 10.1038/ng2012. [DOI] [PubMed] [Google Scholar]
- Jakobsen JS, Braun M, Astorga J, Gustafson EH, Sandmann T, Karzynski MM, Carlson P, Furlong EE. Temporal ChIP-on-chip reveals Biniou as a universal regulator of the visceral muscle transcriptional network. Genes Dev. 2007;21:2448–2460. doi: 10.1101/gad.437607. [DOI] [PMC free article] [PubMed] [Google Scholar]
- Jothi R, Balaji S, Wuster A, Grochow JA, Gsponer J, Przytycka TM, Aravind L, Babu MM. Genomic analysis reveals a tight link between transcription factor dynamics and regulatory network architecture. Mol Syst Biol. 2009;5:294. doi: 10.1038/msb.2009.52. [DOI] [PMC free article] [PubMed] [Google Scholar]
- Kamath RS, Fraser AG, Dong Y, Poulin G, Durbin R, Gotta M, Kanapin A, Le Bot N, Moreno S, Sohrmann M, et al. Systematic functional analysis of the Caenorhabditis elegans genome using RNAi. Nature. 2003;421:231–237. doi: 10.1038/nature01278. [DOI] [PubMed] [Google Scholar]
- Kemmeren P, Sameith K, van de Pasch LA, Benschop JJ, Lenstra TL, Margaritis T, O'Duibhir E, Apweiler E, van Wageningen S, Ko CW, et al. Large-scale genetic perturbations reveal regulatory networks and an abundance of gene-specific repressors. Cell. 2014;157:740–752. doi: 10.1016/j.cell.2014.02.054. [DOI] [PubMed] [Google Scholar]
- Kouns NA, Nakielna J, Behensky F, Krause MW, Kostrouch Z, Kostrouchova M. NHR-23 dependent collagen and hedgehog-related genes required for molting. Biochem Biophys Res Commun. 2011;413:515–520. doi: 10.1016/j.bbrc.2011.08.124. [DOI] [PMC free article] [PubMed] [Google Scholar]
- Labouesse M, Sookhareea S, Horvitz HR. The Caenorhabditis elegans gene lin-26 is required to specify the fates of hypodermal cells and encodes a presumptive zinc-finger transcription factor. Development. 1994;120:2359–2368. doi: 10.1242/dev.120.9.2359. [DOI] [PubMed] [Google Scholar]
- MacMorris M, Brocker C, Blumenthal T. UAP56 levels affect viability and mRNA export in Caenorhabditis elegans. RNA. 2003;9:847–857. doi: 10.1261/rna.5480803. [DOI] [PMC free article] [PubMed] [Google Scholar]
- MacNeil LT, Watson E, Arda HE, Zhu LJ, Walhout AJM. Diet-induced developmental acceleration independent of TOR and insulin in C. elegans. Cell. 2013;153:240–252. doi: 10.1016/j.cell.2013.02.049. [DOI] [PMC free article] [PubMed] [Google Scholar]
- Markowetz F, Kostka D, Troyanskaya OG, Spang R. Nested effects models for high-dimensional phenotyping screens. Bioinformatics. 2007;23:i305–312. doi: 10.1093/bioinformatics/btm178. [DOI] [PubMed] [Google Scholar]
- Martinez-Antonio A, Velazquez-Ramirez DA, Sanchez-Mondragon J, Santillan M. Hierarchical dynamics of a transcription factors network in E. coli. Mol Biosyst. 2012;8:2932–2936. doi: 10.1039/c2mb25236h. [DOI] [PubMed] [Google Scholar]
- McGhee JD, Fukushige T, Krause MW, Minnema SE, Goszczynski B, Gaudet J, Kohara Y, Bossinger O, Zhao Y, Khattra J, et al. ELT-2 is the predominant transcription factor controlling differentiation and function of the C. elegans intestine, from embryo to adult. Developmental biology. 2009;327:551–565. doi: 10.1016/j.ydbio.2008.11.034. [DOI] [PMC free article] [PubMed] [Google Scholar]
- McGhee JD, Sleumer MC, Bilenky M, Wong K, McKay SJ, Goszczynski B, Tian H, Krich ND, Khattra J, Holt RA, et al. The ELT-2 GATA-factor and the global regulation of transcription in the C. elegans intestine. Developmental biology. 2007;302:627–645. doi: 10.1016/j.ydbio.2006.10.024. [DOI] [PubMed] [Google Scholar]
- Murphy CT, McCarroll SA, Bargmann CI, Fraser A, Kamath RS, Ahringer J, Li H, Kenyon C. Genes that act downstream of DAF-16 to influence the lifespan of Caenorhabditis elegans. Nature. 2003;424:277–283. doi: 10.1038/nature01789. [DOI] [PubMed] [Google Scholar]
- Murray JI, Boyle TJ, Preston E, Vafeados D, Mericle B, Weisdepp P, Zhao Z, Bao Z, Boeck M, Waterston RH. Multidimensional regulation of gene expression in the C. elegans embryo. Genome Res. 2012;22:1282–1294. doi: 10.1101/gr.131920.111. [DOI] [PMC free article] [PubMed] [Google Scholar]
- Pauli F, Liu Y, Kim YA, Chen PJ, Kim SK. Chromosomal clustering and GATA transcriptional regulation of intestine-expressed genes in C. elegans. Development. 2005;133:287–295. doi: 10.1242/dev.02185. [DOI] [PMC free article] [PubMed] [Google Scholar]
- Praitis V, Casey E, Collar D, Austin J. Creation of low-copy integrated transgenic lines in Caenorhabditis elegans. Genetics. 2001;157:1217–1226. doi: 10.1093/genetics/157.3.1217. [DOI] [PMC free article] [PubMed] [Google Scholar]
- Quach TK, Chou HT, Wang K, Milledge GZ, Johnson CM. Genome-wide microarrray analysis reveals roles for the REF-1 family member HLH-29 in ferritin synthesis and peroxide stress response. PLoS One. 2013;8:e59719. doi: 10.1371/journal.pone.0059719. [DOI] [PMC free article] [PubMed] [Google Scholar]
- Reboul J, Vaglio P, Rual JF, Lamesch P, Martinez M, Armstrong CM, Li S, Jacotot L, Bertin N, Janky R, et al. C. elegans ORFeome version 1.1: experimental verification of the genome annotation and resource for proteome-scale protein expression. Nat Genet. 2003;34:35–41. doi: 10.1038/ng1140. [DOI] [PubMed] [Google Scholar]
- Reece-Hoyes JS, Deplancke B, Shingles J, Grove CA, Hope IA, Walhout AJM. A compendium of C. elegans regulatory transcription factors: a resource for mapping transcription regulatory networks. Genome Biol. 2005;6:R110. doi: 10.1186/gb-2005-6-13-r110. [DOI] [PMC free article] [PubMed] [Google Scholar]
- Reece-Hoyes JS, Diallo A, Kent A, Shrestha S, Kadreppa S, Pesyna C, Lajoie B, Dekker J, Myers CL, Walhout AJM. Enhanced yeast one-hybrid (eY1H) assays for high-throughput gene-centered regulatory network mapping. Nature Methods. 2011;8:1059–1064. doi: 10.1038/nmeth.1748. [DOI] [PMC free article] [PubMed] [Google Scholar]
- Reece-Hoyes JS, Pons C, Diallo A, Mori A, Shrestha S, Kadreppa S, Nelson J, DiPrima S, Dricot A, Lajoie BR, et al. Extensive rewiring and complex evolutionary dynamics in a C. elegans multiparameter transcription factor network. Mol Cell. 2013;51:116–127. doi: 10.1016/j.molcel.2013.05.018. [DOI] [PMC free article] [PubMed] [Google Scholar]
- Rual JF, Ceron J, Koreth J, Hao T, Nicot AS, Hirozane-Kishikawa T, Vandenhaute J, Orkin SH, Hill DE, van den Heuvel S, et al. Toward improving Caenorhabditis elegans phenome mapping with an ORFeome-based RNAi library. Genome Res. 2004;14:2162–2168. doi: 10.1101/gr.2505604. [DOI] [PMC free article] [PubMed] [Google Scholar]
- Sandmann T, Jensen LJ, Jakobsen JS, Karzynski MM, Eichenlaub MP, Bork P, Furlong EE. A temporal map of transcription factor activity: mef2 directly regulates target genes at all stages of muscle development. Dev Cell. 2006;10:797–807. doi: 10.1016/j.devcel.2006.04.009. [DOI] [PubMed] [Google Scholar]
- Tabuchi T, Deplancke B, Osato N, Zhu LJ, Barrasa MI, Harrison MM, Horvitz HR, Walhout AJM, Hagstrom K. Chromosome-biased binding and gene regulation by the Caenorhabditis elegans DRM complex. PLoS Genet. 2011;7:e1002074. doi: 10.1371/journal.pgen.1002074. [DOI] [PMC free article] [PubMed] [Google Scholar]
- Vokes SA, Ji H, Wong WH, McMahon AP. A genome-scale analysis of the cisregulatory circuitry underlying sonic hedgehog-mediated patterning of the mammalian limb. Genes & development. 2008;22:2651–2663. doi: 10.1101/gad.1693008. [DOI] [PMC free article] [PubMed] [Google Scholar]
- Walhout AJM. What does biologically meaningful mean? A perspective on gene regulatory network validation. Genome Biol. 2011;12:109. doi: 10.1186/gb-2011-12-4-109. [DOI] [PMC free article] [PubMed] [Google Scholar]
- Walhout AJM, Temple GF, Brasch MA, Hartley JL, Lorson MA, van den Heuvel S, Vidal M. GATEWAY recombinational cloning: application to the cloning of large numbers of open reading frames or ORFeomes. Methods in enzymology: “Chimeric genes and proteins”. 2000;328:575–592. doi: 10.1016/s0076-6879(00)28419-x. [DOI] [PubMed] [Google Scholar]
- Watson E, MacNeil LT, Arda HE, Zhu LJ, Walhout AJM. Integration of metabolic and gene regulatory networks modulates the C. elegans dietary response. Cell. 2013;153:253–266. doi: 10.1016/j.cell.2013.02.050. [DOI] [PMC free article] [PubMed] [Google Scholar]
- Whittle CM, Lazakovitch E, Gronostajski RM, Lieb JD. DNA-binding specificity and in vivo targets of Caenorhabditis elegans nuclear factor I. Proc Natl Acad Sci U S A. 2009;106:12049–12054. doi: 10.1073/pnas.0812894106. [DOI] [PMC free article] [PubMed] [Google Scholar]
- Yang A, Zhu Z, Kapranov P, McKeon F, Church GM, Gingeras TR, Struhl K. Relationships between p63 binding, DNA sequence, transcription activity, and biological function in human cells. Mol Cell. 2006;24:593–602. doi: 10.1016/j.molcel.2006.10.018. [DOI] [PubMed] [Google Scholar]
- Yu H, Gerstein M. Genomic analysis of the hierarchical structure of regulatory networks. Proc Natl Acad Sci U S A. 2006;103:14724–14731. doi: 10.1073/pnas.0508637103. [DOI] [PMC free article] [PubMed] [Google Scholar]
Associated Data
This section collects any data citations, data availability statements, or supplementary materials included in this article.