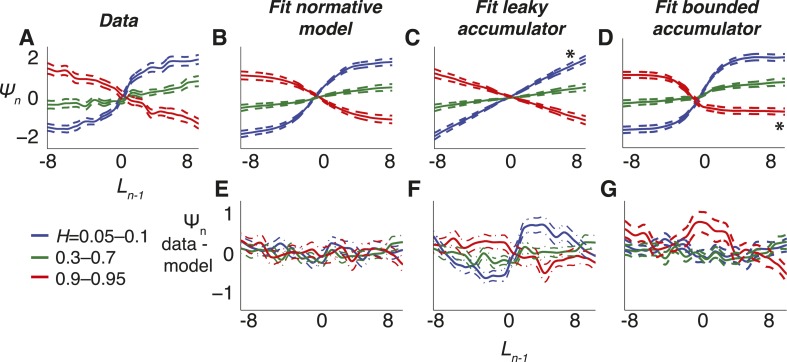
Figure 6. Belief dynamics estimated directly from the data and compared to predictions from the normative model and two suboptimal approximations (Figure 3).
(A–D) Estimates of the log prior-odds on a given trial as a function of belief on the previous trial (compare to Figure 1B) computed for each experimental block, grouped by objective H, as indicated in the legend below panel A. Solid lines are across-block means, and dashed lines are sem. (A) Data. (B) Fit normative model. (C) Fit hazard-dependent leaky accumulator. (D) Fit model with perfect accumulation to a hazard-dependent stabilizing boundary. Asterisks in panels C and D indicate hazard-rate regimes in which estimates from the corresponding model prediction differed significantly from data estimates using Hotelling's t-test with a Bonferroni corrected p < 0.05. (E–G) Hazard-specific differences between the data estimates and model predictions.

