Abstract
Heat shock transcription factors (Hsfs), which act as important transcriptional regulatory proteins, play crucial roles in plant developmental processes, and stress responses. Recently, the genome of the shrub willow Salix suchowensis was fully sequenced. In this study, a total of 27 non-redundant Hsf genes were identified from the S. suchowensis genome. Phylogenetic analysis revealed that the members of the SsuHsf family can be divided into three groups (class A, B, and C) based on their structural characteristics. Promoter analysis indicated that the SsuHsfs promoters included various cis-acting elements related to hormone and/or stress responses. Furthermore, the expression profiles of 27 SsuHsfs were analyzed in different tissues and under various stresses (heat, drought, salt, and ABA treatment) using RT-PCR. The results demonstrated that the SsuHsfs were involved in abiotic stress responses. Our results contribute to a better understanding of the complexity of the SsuHsf gene family, and will facilitate functional characterization in future studies.
Keywords: abiotic stresses, gene expression, gene family, Hsf, Salix suchowensis, transcription factor
Introduction
As sessile organisms, plants constantly experience complex, and variable stresses in their natural environment. Therefore, plants have evolved a series of protective mechanisms for survival and reproduction. Among these protective mechanisms, the heat shock response (HSR) is a conserved cellular defense mechanism. It can be activated by a variety of cytotoxic stimuli and promotes the rapid expression of heat shock proteins (Hsps) (Morimoto et al., 1994; Schöffl et al., 1998). Hsps play crucial roles in protein folding and unfolding, the assembly of protein complexes, and protecting cells against stress (Zhang et al., 2013).
As the key regulators of Hsps, heat shock transcription factors (Hsfs) act in the upstream signal transduction pathway to activate genes in response to various abiotic/biotic stresses (Nover et al., 2001). Under normal conditions, Hsfs are blocked by molecular chaperones and maintained in a monomeric form. When exposed to stress conditions, such as heat stress, Hsfs trimerize into an active form through oligomerization domains. To promote the expression of Hsf-responsive genes, Hsfs bind to heat shock elements (HSEs), which are characterized by the conserved motif “nGAAnnTTCn,” in the promoter region (Bienz and Pelham, 1987).
The structure of Hsfs is modular, including a conserved DNA binding domain (DBD) in the N-terminus and an activation domain (AHA) in the C-terminus. The DBD is the common core structure in Hsfs, and is composed of a helix-turn-helix motif and an adjacent hydrophobic heptad repeat oligomerization domain (HR-A/B) (Nover et al., 2001). Other Hsf functional modules include a nuclear localization signal (NLS) and nuclear export signal (NES) (Kotak et al., 2004). Based on their structural characteristics, plant Hsfs can be grouped into three conserved classes (Nover et al., 2001). Among the three classes (A, B, and C), only class A members contain the AHA domain exclusively.
Compared with other eukaryotes that have 1–3 Hsfs, the plant Hsf family shows striking multiplicity, with more than 20 members (Von Koskull-Döring et al., 2007). As more and more whole genomic sequences of plant organisms have been released, the Hsf family has been analyzed extensively in many plant species (Guo et al., 2008; Lin et al., 2011; Giorno et al., 2012; Zhang et al., 2015).
Recently, willows (genus Salix) have become a focus of research as a potential source of sustainable and renewable biomass for bioenergy and biofuel (Hanley and Karp, 2013). Salix suchowensis is a native shrub willow species distributed in the north of China. It has a much smaller body size and relatively shorter juvenile period in comparison with many other tree species. The full genome sequence of S. suchowensis has now been published (Dai et al., 2014), which makes it possible to identify the willow Hsf gene family and analyze its evolutionary history in this bioenergy plant. Hsfs have been implicated in different aspects of plant life including developmental processes and abiotic/biotic stress tolerance (Kotak et al., 2007; Giorno et al., 2010). Therefore, the Hsf family represents a critical class of transcriptional factors to investigate. Here, we identified 27 genes encoding Hsf proteins in the S. suchowensis genome. To analyze the functions of the different members of this family, the expression patterns of all SsuHsf genes were investigated in various organs/tissues and under various abiotic stresses. These results provide a foundation for functional studies of the SsuHsfs in the future.
Materials and methods
Identification and classification of Hsfs in S. suchowensis
Sequencing of the S. suchowensis genome was completed recently, and filtered protein and coding sequences have also become available (http://115.29.234.170/cgi-bin/gbrowse/gbrowse/Ssuchowensis4/) (Dai et al., 2014). Initially, the Hsf protein sequences of Arabidopsis thaliana (Hübel and Schöffl, 1994) and Populus trichocarpa (Zhang et al., 2015) were used as queries to perform a BLASTP search against the S. suchowensis genome. Additionally, the Hsf domain numbered PF00447 obtained from the Pfam database (Punta et al., 2012) was used as a query to identify all possible homologs in S. suchowensis using BLASTP. Furthermore, the candidate sequences were analyzed in the Pfam database. The SMART program (Letunic et al., 2012) was used to detect the Hsf-type DBD domain and the coiled-coil structure.
Phylogenetic analysis, gene structure, and domain prediction
Alignments of the full SsuHsf proteins were performed using Clustal X 2.1 (Larkin et al., 2007). Phylogenetic trees were constructed by the neighbor-joining (NJ) method in MEGA (version 5.0) (Tamura et al., 2011) with bootstrap values from 1000 replicates indicated at each node. To identify signature domains, the SsuHsf protein sequences were compared with the Hsf proteins of A. thaliana and P. trichocarpa. We named the SsuHsfs based on the subfamily classification and their phylogenetic relationships with the AtHsfs and PtHsfs. For example, the three SsuHsf members in Class A1 were named SsuHsf-A1a, SsuHsf-A1b, and SsuHsf-A1c. The pairwise comparison of Hsf amino acids was performed using MEGA (version 5.0) (Tamura et al., 2011).
The exon and intron structures were examined using the Gene Structure Display Server (GSDS) (Hu et al., 2014) by aligning the cDNA sequences with the corresponding genomic DNA sequences. The domain analysis programs MARCOIL (Delorenzi and Speed, 2002), PredictNLS (Cokol et al., 2000), and NetNES (La Cour et al., 2004) were used to predict the coiled-coil domain, NLS, and NES, respectively. In addition, the conserved motifs were defined by MEME (Bailey et al., 2009).
In silico analysis of regulatory elements in the promoter regions of SsuHsf genes
The elements in the promoter fragments of the SsuHsf genes (1500 bp upstream of the translation initiation sites) were identified using the program PlantCARE online (Lescot et al., 2002).
Plant growth conditions and treatments
Four-week-old seedlings of S. suchowensis clones were grown in a growth chamber under long-day conditions (16 h light/8 h dark) at 23°C. Various tissues, including the shoot tip (ST), young leaf (YL), mature leaf (ML), primary stem (PS), secondary stem (SS), root (R), and female catkin (FC) were collected from the S. suchowensis seedlings. For abiotic stress and hormone treatments, the seedlings were treated with 37°C (for heat stress), 20% polyethylene glycol (PEG, for drought stress), 150 mM NaCl (for salt stress), or 100 μM abscisic acid (ABA). The dosages of the abiotic stresses and hormone treatment were determined based on treatments in poplar (Shao et al., 2011; Zhang et al., 2015), and were confirmed by preliminary experiments in S. suchowensis. During the treatments, four time points (0, 1, 6, and 24 h) were selected for sample collection. The samples were harvested, frozen immediately in liquid nitrogen, and stored at −80°C for further analysis. Three biological replicates were performed using three completely separate sets of RNA samples from different sets of tissues for both tissue-specific experiments and stress experiments.
RNA isolation and RT-PCR
Total RNA was extracted using the RNeasy Plant Mini Kit (Qiagen) according to the instructions. First-strand cDNA synthesis was carried out with ~2 μg RNA using the SuperScript III reverse transcription kit (Invitrogen) according to the manufacturer's procedure. Gene specific primers with melting temperatures of 58–62°C and amplicon lengths of 150–260 bp were designed using the Primer3 software (http://frodo.wi.mit.edu/primer3/input.htm). The semi-quantitative RT-PCRs were performed as follows: a pre-cycling step of 94°C for 5 min, followed by 35 (for SsuHsf-A6a, -A6b, -A9, -B3, -B4a, -B5a) or 30 (for other SsuHsfs and the internal control SsuActin) cycles of 94°C for 30 s, 58°C for 30 s, and 72°C for 45 s, and then a final extension at 72°C for 5 min. The 20 μl reaction system contained 10 μl Takara Premix Taq™ (Takara, Dalian, China), 1 μl of cDNA template, 1 μl of each primer, and 7 μl of ddH2O. The PCR products (10 μl) were electrophoresed in a 1.5% agarose gel. The SsuActin gene was used as an internal control. For quantitation of PCR products, the ImageJ program (NIH Image, Bethesda, MD, USA) was used to calculate relative units to indicate the fold difference between stress treatments and the control after normalization with SsuActin. All experiments were repeated at least three times with similar results. The fold change values were log2 transformed and the average value from three replicates were used to generate a heat map.
Results
Genome-wide identification and phylogenetic analysis of the Hsf gene family in S. suchowensis
To identify Hsf genes in S. suchowensis, we performed a BLASTP search against the S. suchowensis genome using Hsf protein sequences from Arabidopsis and Populus as queries. After removing the incomplete sequences lacking the DBD domain and/or the other functional domains, 27 non-redundant SsuHsf proteins were identified and described (Table 1). The SsuHsfs were distributed across 25 scaffolds of the willow genome, and two Hsf genes each were detected on scaffolds 10 and 25 (Table 1).
Table 1.
The Hsf genes identified from the S. suchowensis.
| Gene name | Transcrit ID | Map position (bp) | Length (aa) | MW (kDa)/pI | A. thaliana ortholog locus | P. trichocarpa ortholog locus |
|---|---|---|---|---|---|---|
| SsuHsf-A1a | willow_GLEAN_10025706 | scaffold25:1497258-1497907(+) | 497 | 54.3/4.68 | AT1G32330.1 | Potri.003G095000.1 |
| SsuHsf-A1b | willow_GLEAN_10004399 | scaffold185:94000-96478(+) | 476 | 52.8/5.39 | AT5G16820.1 | Potri.013G079800.1 |
| SsuHsf-A1c | willow_GLEAN_10014876 | scaffold79:510224-511723(+) | 508 | 55.7/4.83 | AT1G32330.1 | Potri.001G138900.1 |
| SsuHsf-A2 | willow_GLEAN_10026187 | scaffold19:533642-535574(+) | 374 | 42/4.85 | AT2G26150.1 | Potri.006G226800.1 |
| SsuHsf-A3 | willow_GLEAN_10026517 | scaffold18:2169295-2172020(+) | 519 | 57.9/4.85 | AT5G03720.1 | Potri.006G115700.1 |
| SsuHsf-A4a | willow_GLEAN_10005943 | scaffold181:32748-37435(+) | 406 | 45.9/5.09 | AT4G18880.1 | Potri.011G071700.1 |
| SsuHsf-A4b | willow_GLEAN_10018721 | scaffold69:816974-819687(−) | 444 | 50.8/5.65 | AT4G18880.1 | Potri.014G141400.1 |
| SsuHsf-A4c | willow_GLEAN_10017256 | scaffold71:700318-701359(−) | 407 | 46.5/5.42 | AT4G18880.1 | Potri.004G062300.1 |
| SsuHsf-A5 | willow_GLEAN_10019246 | scaffold66:357257-358822(+) | 489 | 54.7/6.01 | AT4G13980.1 | Potri.001G320900.1 |
| SsuHsf-A6a | willow_GLEAN_10021781 | scaffold41:90931-92291(−) | 362 | 41.6/4.98 | AT3G22830.1 | Potri.010G082000.1 |
| SsuHsf-A6b | willow_GLEAN_10003707 | scaffold205:80301-82019(−) | 368 | 42/5.05 | AT3G22830.1 | Potri.008G157600.1 |
| SsuHsf-A7a | willow_GLEAN_10001664 | scaffold01442:1030-2689(+) | 361 | 40.9/6.64 | AT3G22830.1 | Potri.005G214800.1 |
| SsuHsf-A7b | willow_GLEAN_10022356 | scaffold25:386922-388292(+) | 360 | 41.1/5.51 | AT3G22830.1 | Potri.002G048200.1 |
| SsuHsf-A8a | willow_GLEAN_10010667 | scaffold143:390791-392136(+) | 402 | 46.1/4.89 | AT1G67970.1 | Potri.010G104300.1 |
| SsuHsf-A8b | willow_GLEAN_10021820 | scaffold37:1365061-1368951(−) | 391 | 44.6/4.74 | AT1G67970.1 | Potri.010G104300.1 |
| SsuHsf-A9 | willow_GLEAN_10020699 | scaffold56:263821-265104(+) | 555 | 61.7/4.78 | AT2G26150.1 | Potri.006G148200.1 |
| SsuHsf-B1 | willow_GLEAN_10004276 | scaffold10:3329791-3332899(+) | 275 | 30/5.1 | AT4G36990.1 | Potri.007G043800.1 |
| SsuHsf-B2a | willow_GLEAN_10009738 | scaffold10:2825166-2826872(+) | 314 | 34.8/5.41 | AT5G62020.1 | Potri.015G141100.1 |
| SsuHsf-B2b | willow_GLEAN_10004530 | scaffold183:89947-91189(+) | 352 | 37.9/4.98 | AT4G11660.1 | Potri.001G108100.1 |
| SsuHsf-B3 | willow_GLEAN_10014050 | scaffold8:1488988-1490578(+) | 204 | 23.8/7.66 | AT2G41690.1 | Potri.016G056500.1 |
| SsuHsf-B4a | willow_GLEAN_10009316 | scaffold3:4044788-4049120(−) | 189 | 21.5/5.17 | AT1G46264.1 | Potri.002G124800.1 |
| SsuHsf-B4b | willow_GLEAN_10024472 | scaffold13:1822238-1824250(−) | 271 | 31.2/6.9 | AT1G46264.1 | Potri.009G068000.1 |
| SsuHsf-B4c | willow_GLEAN_10004301 | scaffold192:153539-154003(+) | 377 | 42.1/8.64 | AT1G46264.1 | Potri.014G027100.1 |
| SsuHsf-B4d | willow_GLEAN_10011830 | scaffold85:641587-647118(−) | 270 | 30.9/6.59 | AT1G46264.1 | Potri.001G273700.1 |
| SsuHsf-B5a | willow_GLEAN_10017386 | scaffold1:81191-83601(+) | 180 | 20.4/9.77 | AT4G17750.1 | Potri.004G042600.1 |
| SsuHsf-B5b | willow_GLEAN_10010880 | scaffold2:3463989-3465649(−) | 203 | 23.2/7.77 | AT1G32330.1 | Potri.011G051600.1 |
| SsuHsf-C1 | willow_GLEAN_10010554 | scaffold177:244037-245200(−) | 316 | 34.9/5.3 | AT3G24520.1 | Potri.T137400.1 |
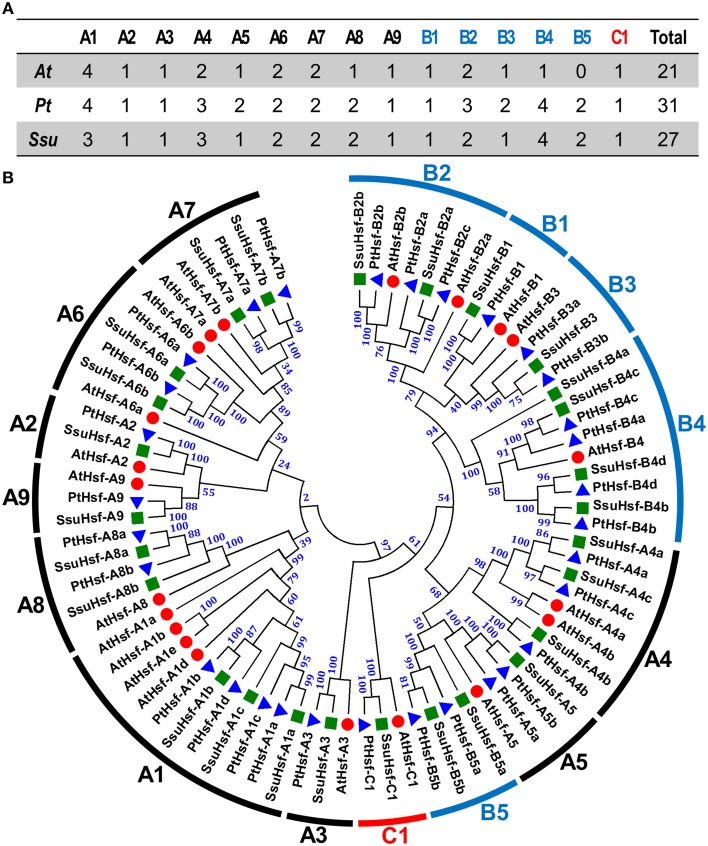
Based on the multiple sequence alignment of the DBD and HR-A/B, the 27 SsuHsfs were grouped into Class A (16 genes), Class B (10 genes), and Class C (one gene) (Table 1 and Figure 1A). The SsuHsf protein lengths ranged from 180 to 555 amino acids, and their predicted isoelectric points ranged from 4.68 to 9.77 (Table 1).
Figure 1.
Hsf family members (A) and their phylogenetic relationships (B) from S. suchowensis, P. trichocarpa, and A. thaliana. Multiple alignment was performed using Clustal X 2.1. Phylogenetic tree was constructed by the neighbor-joining (NJ) method with 1000 bootstrap replicates. Bootstrap support values are indicated on each node. The three major groups are marked with different colors. The complete sequences of identified Hsfs are listed in Table S1. Hsfs in S. suchowensis, P. trichocarpa, and A. thaliana were marked with green squares, blue triangles, and red circles, respectively.
To investigate the evolutionary relationships of the Hsfs, an unrooted phylogenetic tree was generated using the full length protein sequences of the 27 S. suchowensis Hsfs (SsuHsfs), 31 P. trichocarpa Hsfs (PtHsfs), and 21 A. thaliana Hsfs (AtHsfs) (Table 2). As shown in Figure 1B, the Hsfs of the three species were distinctly classified into three classes (A, B, and C). The Class C Hsfs from the three plant species constituted a distinct clade. The size of the Class A1, A5, B2, and B3 SsuHsfs were smaller than those in P. trichocarpa. We named the SsuHsfs based on the subfamily classification and their phylogenetic relationships with the AtHsfs and PtHsfs. For example, three SsuHsf members in Class A1 were named SsuHsf-A1a, SsuHsf-A1b, and SsuHsf-A1c.
Table 2.
Comparison of Hsf members in S. suchowensis, P. trichocarpa, and A. thaliana.
| Hsfs | S. suchowensis | P. trichocarpa | A. thaliana | ||
|---|---|---|---|---|---|
| 27 | 31 | 21 | |||
| Type A | A1 | A1a | willow_GLEAN_10025706 | Potri.003G095000.1 | At4g17750.1 |
| A1b | willow_GLEAN_10004399 | Potri.013G079800.1 | At5g16820.1 | ||
| A1c | willow_GLEAN_10014876 | Potri.001G138900.1 | At1g32330.1 | ||
| A1d | Potri.019G050400.1 | At3g02990.1 | |||
| A2 | A2 | willow_GLEAN_10026187 | Potri.006G226800.1 | At2g26150.1 | |
| A3 | A3 | willow_GLEAN_10026517 | Potri.006G115700.1 | At5g03720.1 | |
| A4 | A4a | willow_GLEAN_10005943 | Potri.011G071700.1 | At4g18880.1 | |
| A4b | willow_GLEAN_10018721 | Potri.014G141400.1 | At5g45710.1 | ||
| A4c | willow_GLEAN_10017256 | Potri.004G062300.1 | |||
| A5 | A5a | willow_GLEAN_10019246 | Potri.017G059600.1 | At4g13980.1 | |
| A5b | Potri.001G320900.1 | ||||
| A6 | A6a | willow_GLEAN_10021781 | Potri.010G082000.1 | At5g43840.1 | |
| A6b | willow_GLEAN_10003707 | Potri.008G157600.1 | At3g22830.1 | ||
| A7 | A7a | willow_GLEAN_10001664 | Potri.005G214800.1 | At3g51910.1 | |
| A7b | willow_GLEAN_10022356 | Potri.002G048200.1 | At3g63350.1 | ||
| A8 | A8a | willow_GLEAN_10010667 | Potri.008G136800.1 | At1g67970.1 | |
| A8b | willow_GLEAN_10021820 | Potri.010G104300.1 | |||
| A9 | A9 | willow_GLEAN_10020699 | Potri.006G148200.1 | At5g54070.1 | |
| Type B | B1 | B1 | willow_GLEAN_10004276 | Potri.007G043800.1 | At4g36990.1 |
| B2 | B2a | willow_GLEAN_10009738 | Potri.012G138900.1 | At5g62020.1 | |
| B2b | willow_GLEAN_10004530 | Potri.001G108100.1 | At4g11660.1 | ||
| B2c | Potri.015G141100.1 | ||||
| B3 | B3a | willow_GLEAN_10014050 | Potri.006G049200.1 | At2g41690.1 | |
| B3b | Potri.016G056500.1 | ||||
| B4 | B4a | willow_GLEAN_10009316 | Potri.002G124800.1 | At1g46264.1 | |
| B4b | willow_GLEAN_10024472 | Potri.009G068000.1 | |||
| B4c | willow_GLEAN_10004301 | Potri.014G027100.1 | |||
| B4d | willow_GLEAN_10011830 | Potri.001G273700.1 | |||
| B5 | B5a | willow_GLEAN_10017386 | Potri.004G042600.1 | ||
| B5b | willow_GLEAN_10010880 | Potri.011G051600.1 | |||
| Type C | C1 | C1 | willow_GLEAN_10010554 | Potri.T137400.1 | At3g24520.1 |
Structural analysis of Hsfs in S. suchowensis
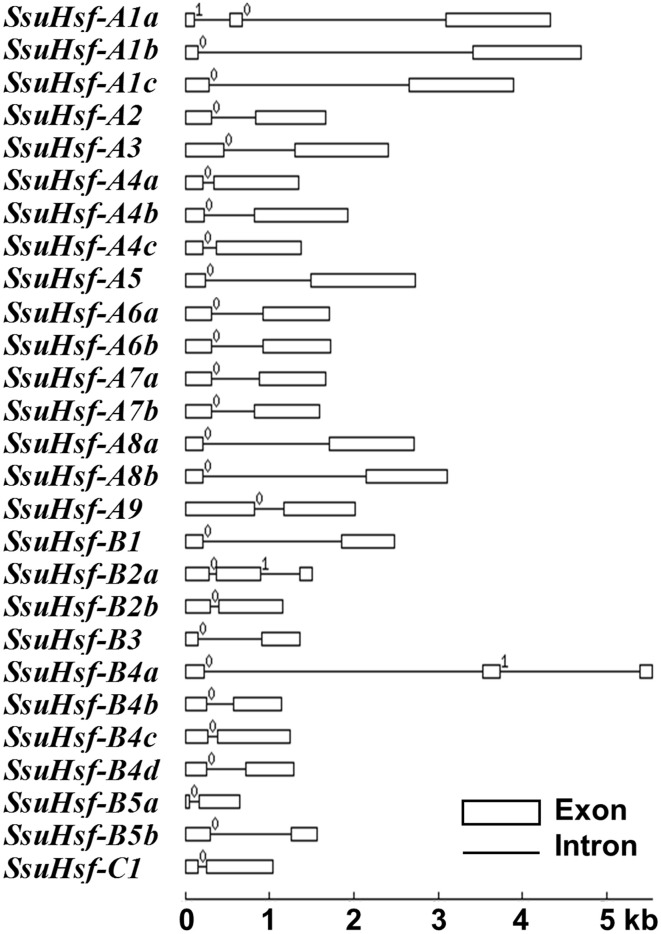
To evaluate the structural diversity of the SsuHsf genes, the full-length cDNA sequences were compared with the corresponding genomic DNA sequences to determine the numbers and positions of exons and introns within each gene (Figure 2). Exon/intron structural divergence within a gene family plays a critical role during evolution. In general, paralogous genes are highly conserved in gene structure and this conservation is sufficient to reveal their evolutionary relationships (Hardison, 1996). Most SsuHsf genes included only one intron, except for SsuHsf-A1a, SsuHsf-B2a, and SsuHsf-B4a, which included two introns. The intron phases were remarkably well-conserved among family members (Figure 2).
Figure 2.
Gene structures of SsuHsf genes. Boxes represent exons and lines represent introns. The numbers indicate the splicing phases of the SsuHsfs: 0, phase 0; 1, phase 1; and 2, phase 2.
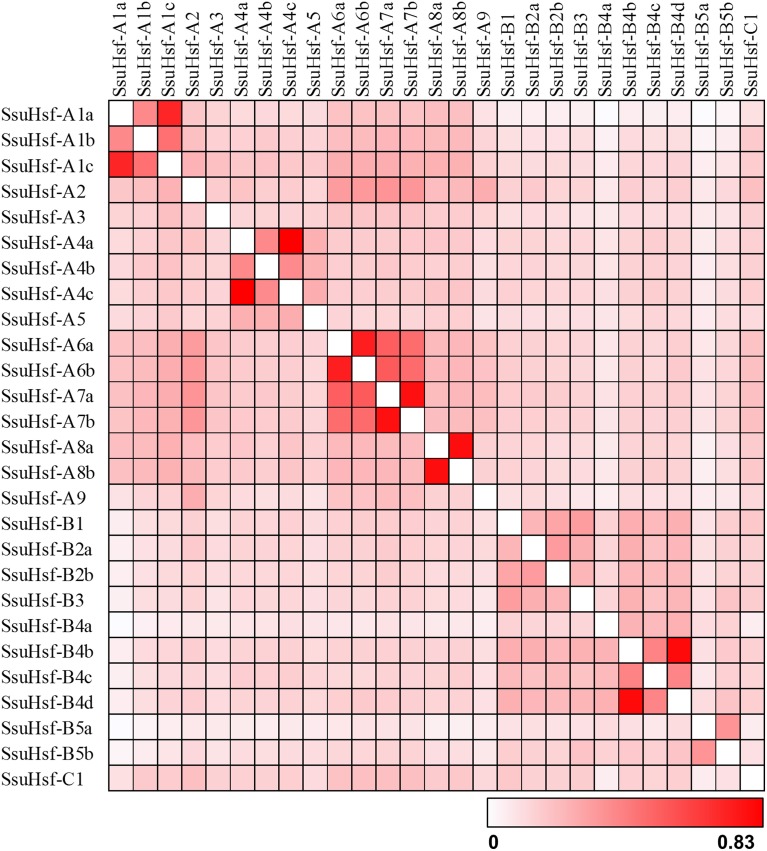
The sequence conservation among SsuHsf proteins was also supported by their identity at the amino acid level (0.023–0.83, Figure 3). Six pairs of SsuHsfs (A1a-A1c, A4a-A4c, A6a-A6b, A7a-A7b, A8a-A8b, and B4b-B4d) exhibited high sequence identity. Detailed information on the identity among SsuHsf, PtHsf, AtHsf amino acid sequences is shown in Figure S1.
Figure 3.
Sequence identity of SsuHsf proteins. Amino acid identity among SsuHsf proteins was analyzed in pairwise fashion.
Duplication of Hsfs in S. suchowensis
Based on the phylogenetic relationships and gene structures of the SsuHsf genes (Figures 1, 2), we found that all five SsuHsf paralogous gene pairs were generated by duplication events (Table 3). To verify whether Darwinian positive selection was involved in the SsuHsf genes' divergence after duplication, the substitution rate ratio of non-synonymous (Ka) vs. synonymous (Ks) substitutions was calculated for the SsuHsf gene pairs. In general, Ka/Ks ratio implies different selection types: positive selection (>1), neutral selection (= 1), or purifying selection (< 1) (Hurst, 2002). As shown in Table 3, the Ka/Ks ratios of all five SsuHsf gene pairs were less than 0.4; thus, it can be concluded that the SsuHsf gene family has undergone great purifying selection pressure with limited functional divergence after duplication. Notably, the average values of Ka and Ks in S. suchowensis Hsf gene pairs were larger than those in P. trichocarpa (Ka was ~0.1084 in SsuHsf pairs and ~0.0702 in PtHsf pairs, Ks was ~0.3305 in SsuHsf pairs and ~0.2699 in PtHsf pairs) (Zhang et al., 2015).
Table 3.
Divergence between paralogous SsuHsf gene pairs.
| No. | Gene 1 | Gene 2 | Ka | Ks | Ka/Ks |
|---|---|---|---|---|---|
| 1 | SsuHsf-A4a | SsuHsf-A4c | 0.0877 | 0.3092 | 0.2837 |
| 2 | SsuHsf-A6a | SsuHsf-A6b | 0.1184 | 0.2960 | 0.3999 |
| 3 | SsuHsf-A7a | SsuHsf-A7b | 0.1194 | 0.3479 | 0.3431 |
| 4 | SsuHsf-A8a | SsuHsf-A8b | 0.0998 | 0.3203 | 0.3118 |
| 5 | SsuHsf-B4b | SsuHsf-B4d | 0.1169 | 0.3789 | 0.3084 |
Gene pairs were identified based on the phylogenetic tree (Figure 1). Ka and Ks rates are presented for each pair.
Conserved domains and motifs of SsuHsfs
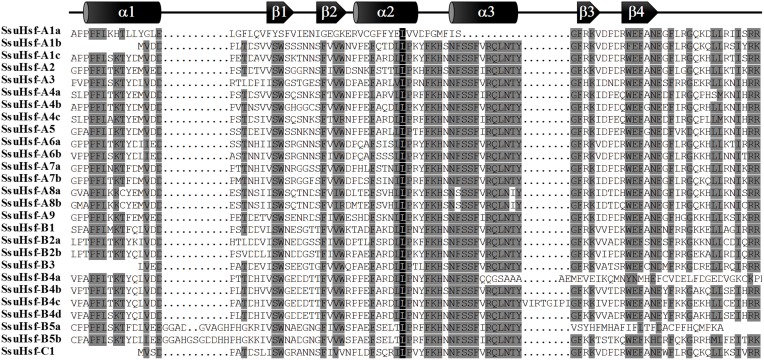
The modular structures of Hsfs have been studied thoroughly in some model plants (Nover et al., 2001; Scharf et al., 2012). The known information on functional domains of AtHsfs makes it possible to identify similar domains in the SsuHsfs. As shown in Table 4, five conserved domains (DBD, HR-A/B, NLS, NES, and AHA) were identified by sequence alignment and their positions in the proteins. The conserved DBD comprised three α-helices (α1–3) and four β-sheets (β1–4) (Figure 4). It has been reported that NES and NLS domains are essential for shuttling Hsfs between the nucleus and cytoplasm (Scharf et al., 2012), and the majority of the SsuHsfs showed the presence of a NES and/or NLS domain. Furthermore, AHA motifs were identified in most of the Class A SsuHsfs. However, we were unable to predict putative AHA motifs in the Class B and C proteins (Table 4).
Table 4.
Functional domains of SsuHsfs.
| Gene Name | DBD | HR-A/B | NLS | NES | AHA1 | AHA2 |
|---|---|---|---|---|---|---|
| SsuHsf-A1a | 33–116 | 149–199 | (229) NKKRRLKQ | (481) VEQLTEQMG | (438) SSFWYDLLVQ | |
| SsuHsf-A1b | 1–83 | 111–158 | (191) SKKRRLPR | (459) MNHLAEQME | (411) DVFWEQFLTA | |
| SsuHsf-A1c | 33–126 | 159–207 | (239) NKKRRLKQ | (491) MDQLTEQMG | (448) SSFWDDLLVQ | |
| SsuHsf-A2 | 40–133 | 159–201 | (229) RR-X8-RKRR | (363) LVDQMGYL | (315) ETIWEELFSD | (355) DWSDDFQD |
| SsuHsf-A3 | 90–183 | 207–252 | (270) ARLKQKKEQ | N.D. | (443) W-X17-W-X20-W-X15-W | |
| SsuHsf-A4a | 10–103 | 128–171 | (204) DRKRRL | (393) LTEQIGHL | (257) LTFWENMVHD | (342) DVFWEQFLTE |
| SsuHsf-A4b | 11–104 | 126–178 | (203) NKKRKA | (431) LAMHTGQI | (253) LKFLENFLYA | (378) DLFWQHFLTE |
| SsuHsf-A4c | 10–103 | 129–174 | (204) DRKRRL | (394) LTEQMGHL | (258) LTFWENMVHD | (343) DVFWEQFLTE |
| SsuHsf-A5 | 17–110 | 132–179 | (199) RK-X10-KKRR | (484) MEQLSL | (438) DVFWEQFLTE | |
| SsuHsf-A6a | 40–133 | 153–195 | (234) KKKRR | (350) LVEQLGYM | (319) EAFWEDLLNE | |
| SsuHsf-A6b | 41–134 | 162–207 | (240) KKRRR | (343) LGGEGED | (325) EVFWEDLLNE | |
| SsuHsf-A7a | 42–135 | 163–234 | (231) KRKELEEALTKKRRR | (349) LAERLGYL | (327) EGFWEELLNE | |
| SsuHsf-A7b | 42–135 | 162–228 | (231) KTKELEEAMTKKRRR | (345) LAERLNYL | (323) EGFWEELLNE | |
| SsuHsf-A8a | 8–101 | 141–175 | (100) RRK | (381) TKQMGLL | (299) DGAWEQLLL | |
| SsuHsf-A8b | 8–101 | 134–175 | (100) RRK | (379) TWQMDHL | (298) DGSWEHMFL | |
| SsuHsf-A9 | 212–305 | 328–368 | (296) KHLLKSIKRR | (522) LYLELEDL | nd | |
| SsuHsf-B1 | 6–99 | 148–180 | (242) LFGV-X6-KKKR | nd | nd | |
| SsuHsf-B2a | 31–124 | 171–215 | (111) RKGKK | nd | nd | |
| SsuHsf-B2b | 36–129 | 199–216 | (116) RRGEK | nd | nd | |
| SsuHsf-B3 | 2–84 | 124–168 | (171) LFGV-X9-RKRK | nd | nd | |
| SsuHsf-B4a | 21–121 | N.D. | (158) SRKAFRFNERRR | nd | nd | |
| SsuHsf-B4b | 21–114 | 153–186 | (254) LFGV-X4-NKR | nd | nd | |
| SsuHsf-B4c | 21–122 | 203–235 | (331) LFGV-X4-KKR | nd | nd | |
| SsuHsf-B4d | 21–114 | 153–184 | (253) LFGV-X4-NKR | nd | nd | |
| SsuHsf-B5a | 68–164 | N.D. | (14) KKTKKK | nd | nd | |
| SsuHsf-B5b | 28–132 | 166–186 | (120) KGRR | nd | nd | |
| SsuHsf-C1 | 1–83 | 112–137 | (81) VRRKHG | nd | nd |
nd, no motifs detectable by sequence similarity search.
Figure 4.
Multiple sequence alignment of the DBD domains of the SsuHsf proteins. The secondary structures of the DBD (α1-β1-β2-α2-α3-β3-β4) are shown above the alignment. α-helices and β-sheets were marked using cylindrical tubes and block arrows, respectively.
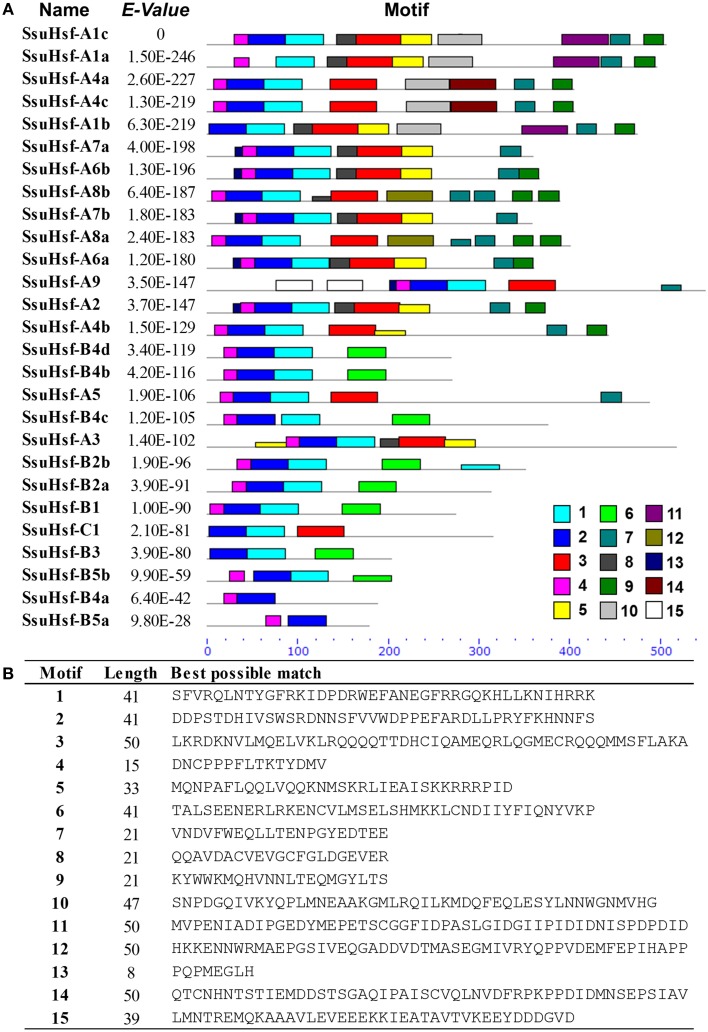
After searching with the MEME motif search tool, 15 consensus motifs were detected in the SsuHsfs (Figure 5). The majority of SsuHsfs possessed motifs 1, 2, and 4, which corresponded to highly conserved regions including the DBD region. Specifying the coiled-coil structure, motifs 3 and 6 were distinctly detected in all SsuHsfs. However, motif 3 only existed in the Class A and C SsuHsfs, and motif 6 was only present in Class B SsuHsfs. Motifs 5 and 9 included the NLS and NES, respectively. Furthermore, motif 7 represented the AHA motif close to the Hsf C-terminus (Figure 5 and Table 4).
Figure 5.
Distribution of conserved motifs in the SsuHsf proteins. (A) The motifs were identified by MEME. Different motifs are indicated by different colored numbers 1–15. (B) The detail motif sequences.
cis-elements in the promoter regions of SsuHsfs
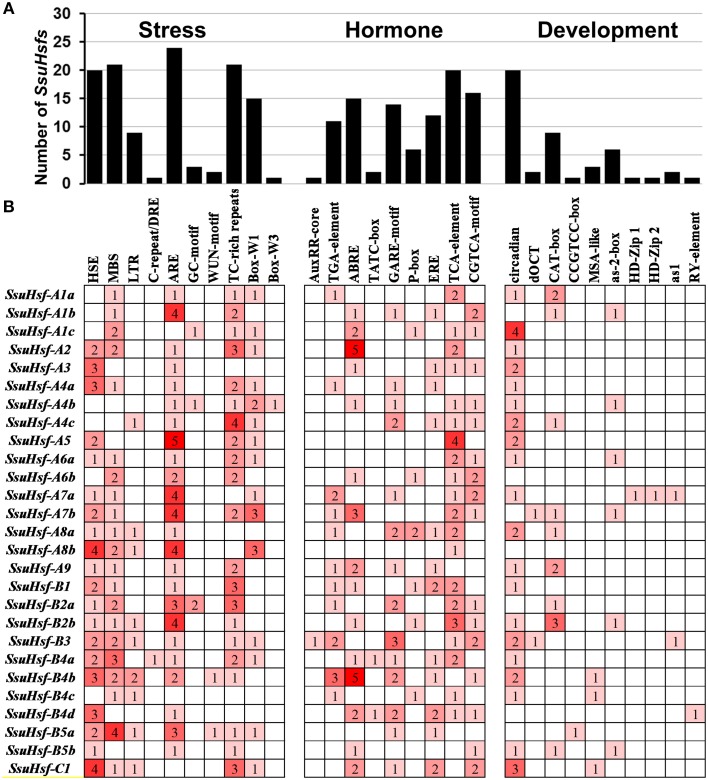
To identify the likely cis-elements of the SsuHsfs, the promoter regions (1.5 kb of genomic DNA sequence upstream of the translation start site) of the SsuHsf genes were used to search the PlantCARE database. A series of cis-elements involved in abiotic stress responses, phytohormone responses, and developmental processes were identified. As shown in Figure 6, the SA-responsive element (TCA-element), the MeJA-responsive element (CGTCA-motif), and the ABA-responsive element (ABRE) were found in the promoters of 20, 16, and 15 SsuHsf genes, respectively. All three were present in the promoter regions of seven genes. The HSE was found in the promoters of 20 SsuHsf genes. The anaerobic induction element (ARE), defense and stress responsive element (TC-rich), and MYB binding sites involved in drought-inducibility (MBS) were found in 24, 21, and 21 SsuHsf gene promoters, respectively. Additionally, the circadian control element (circadian) was found in the promoters of 20 SsuHsfs. Notably, two leaf development related cis-elements (HD-Zip1 and HD-Zip2) were found in the SsuHsf-A7a promoter. These results indicated that the SsuHsfs might be involved in the transcriptional control of hormone and stress responses and developmental processes.
Figure 6.
Various cis-acting elements in SsuHsf genes. (A) The number of SsuHsf genes containing various cis-acting elements. (B) The number of occurrences of each cis-acting elements in the promoter region of each of SsuHsf genes. The annotation of the cis-elements: HSE, cis-acting element involved in heat stress responsiveness; MBS, MYB binding site involved in drought-inducibility; LTR, involved in low-temperature responsiveness; C-repeat/DRE, involved in cold- and dehydration-responsiveness; ARE, essential for the anaerobic induction; GC-motif, enhancer-like element involved in anoxic specific inducibility; WUN-motif, wound-responsive element; TC-rich repeats, involved in defense and stress responsiveness; Box-W1 and Box-W3, fungal elicitor responsive element; AuxRR-core and TGA-element, auxin-responsive element; ABRE, involved in the abscisic acid responsiveness; TATC-box, GARE-motif and P-box, gibberellin-responsive element; ERE, ethylene-responsive element; TCA-element, involved in salicylic acid responsiveness; CGTCA-motif, involved in the MeJA-responsiveness; circadian, involved in circadian control; dOCT and CAT-box, related to meristem expression; CCGTCC-box, related to meristem specific activation; MSA-like, involved in cell cycle regulation; as-2-box, involved in shoot-specific expression and light responsiveness; HD-Zip1, involved in differentiation of the palisade mesophyll cells; HD-Zip2, involved in the control of leaf morphology development; as1, involved in the root-specific expression; RY-element, involved in seed-specific regulation.
Expression profiles of SsuHsf genes in various tissues
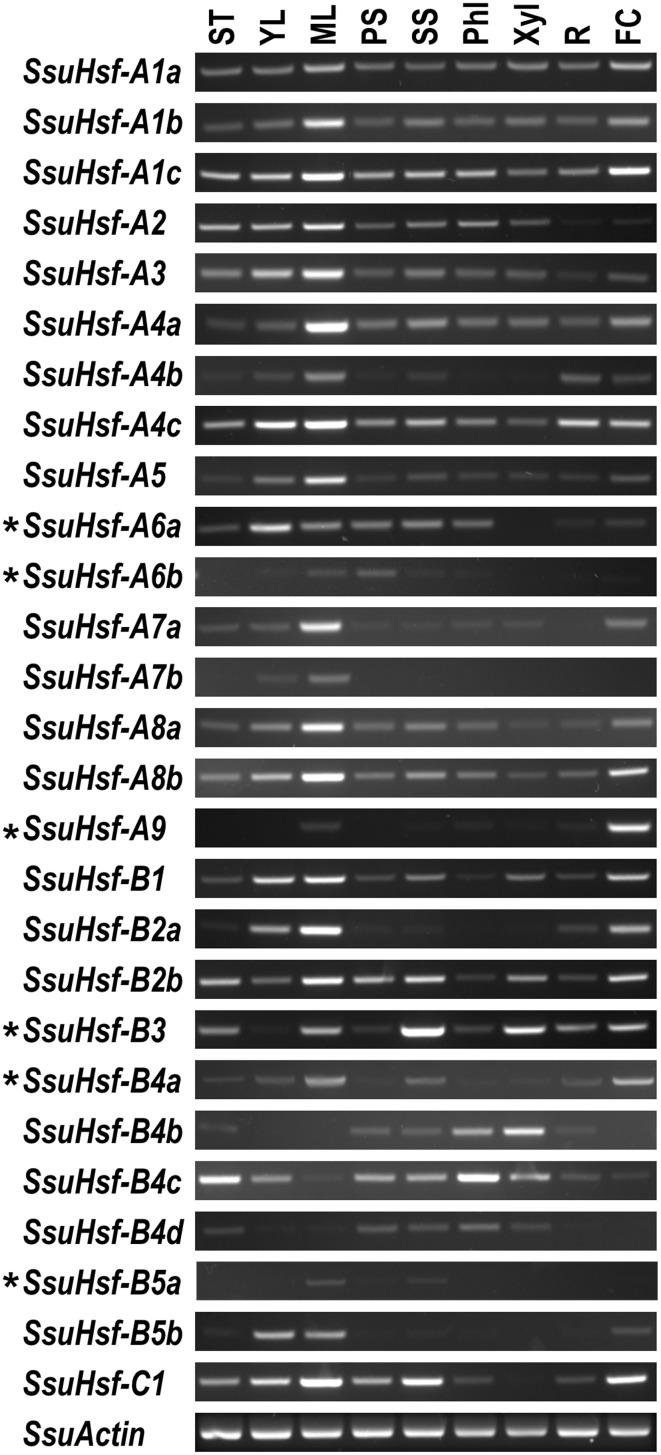
To identify the spatial and temporal expression patterns of the SsuHsfs, RT-PCR was performed on the 27 SsuHsfs in nine different tissues of S. suchowensis: the shoot tip (ST), young leaf (YL), mature leaf (ML), primary stem (PS), secondary stem (SS), phloem (Phl), xylem (Xyl), root (R), and female catkin (FC). Most SsuHsfs showed distinct tissue expression patterns. As shown in Figure 7, some genes had tissue-specific expression patterns; for example, SsuHsf-B3 was highly expressed in the secondary stem and xylem, SsuHsf-B4c was highly expressed in the shoot tip and phloem, and SsuHsf-A7a was highly expressed in the mature leaf. Interestingly, SsuHsf-A9 was specifically expressed in the female catkin.
Figure 7.
Expression analyses of SsuHsfs in different tissues. The expression of 27 SsuHsfs in shoot tip (ST), young leaf (YL), mature leaf (ML), primary stem (PS), secondary stem (SS), phloem (Phl), xylem (Xyl), root (R), and female catkin (FC) from S. suchowensis. The amplification cycle used was 35 for six asterisk (*) labeled genes and 30 for all the other SsuHsfs and the SsuActin reference control. One experiment representative for three biological replicate experiments was shown in here. Primers used for RT-PCR are listed in Table S2.
Among the five pairs of SsuHsf paralogs, one pair (SsuHsf-A8a/A8b) exhibited similar expression patterns in the analyzed tissues, while the other four pairs showed different tissue expression patterns to some degree (Figure 7).
Expression analysis of SsuHsf genes in response to various treatments
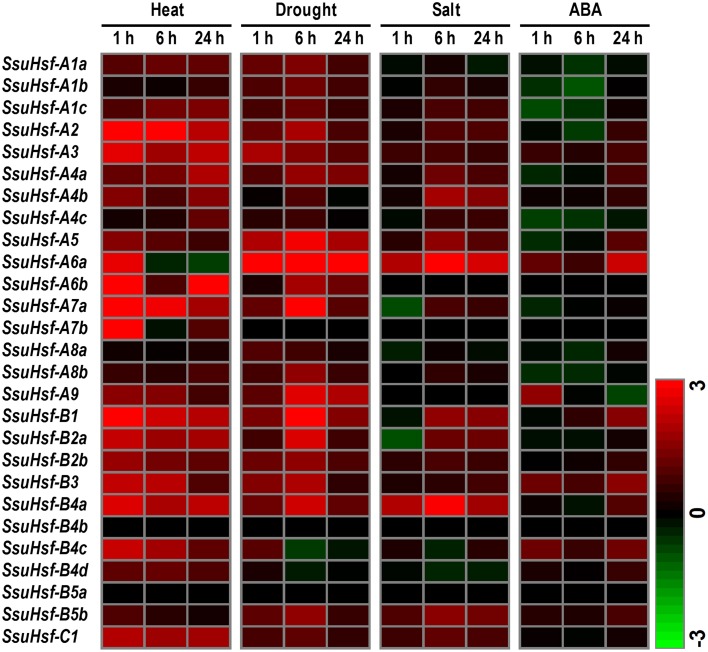
To determine the potential roles of the SsuHsf genes in plant responses to various environmental stresses, RT-PCR was performed on the 27 SsuHsf genes in the leaves of S. suchowensis seedlings exposed to heat, drought, salt, and ABA treatments. Overall, except for SsuHsf-B4b and SsuHsf-B5a, the transcript levels of all of the SsuHsf genes responded to at least one treatment (Figure 8). Among them, 10 SsuHsfs (A1c, A2, A3, A5, A6a, B1, B2a, B2b, B4a, and C1) were significantly induced by heat, drought, and salt stress, and five SsuHsfs (A4b, A7a, A9, B3, and B5b) responded to two treatments (Figure 8). This indicated that these genes might be nodes of convergence for different stress response pathways. In response to heat, 24 of the 27 SsuHsf genes were induced. Notably, three members including A6b, A9, and B4d showed no or low expression in leaves under normal growth conditions (Figure 7), but were strongly up-regulated during the heat stress treatment (Figure 8). In addition, most of the SsuHsfs (A2, A3, A6a, A6b, A7a, A7b, B1, B2a, B2b, B3, B4a, B4c, and C1) showed immediate transcript accumulation at 1 h in the 37°C treatment.
Figure 8.
Expression analyses of SsuHsfs under abiotic stresses. Heat map representation for the expression patterns of 27 SsuHsf genes after treated for 1, 6, or 24 h under heat (37°C), drought (20% PEG), salt (150 mM NaCl), or 100 μM ABA. The expression levels of genes were determined using RT-PCR. The different colors correspond to log2 transformed values compared with control (0 h). Green indicates down-regulation and red represents up-regulation. The data were generated by averaging the fold change from each of the three biological replicate experiments. Details of the expression data are listed in Table S3.
Discussion
Characterization of the S. suchowensis Hsf gene family
A total of 27 non-redundant Hsfs were identified based on the recently released S. suchowensis genome (Dai et al., 2014). The size of the Hsf family in S. suchowensis is smaller than in P. trichocarpa, which is consistent with the genome sizes of these two species (~425 Mb in S. suchowensis and ~485 Mb in P. trichocarpa) (Dai et al., 2014). Phylogenetic analyses of the Hsfs in S. suchowensis, P. trichocarpa, and A. thaliana indicated that the SsuHsfs are correspond more closely with the PtHsfs than the AtHsfs, consistent with the evolutionary relationships among the three species. All three Hsf classes (Classes A, B, and C) were identified in all three species, implying that the Hsf genes originated prior to the divergence of these species.
During evolution, gene duplication plays a critical role in the expansion of gene families (Maere et al., 2005). Among the 27 SsuHsfs, five pairs of SsuHsf gene paralogs were identified, and the members in each pair were distributed on different scaffolds. This suggests the SsuHsf gene family expansion originated from large segmental duplications. It has been reported that more than 90% of the increased regulatory genes in Arabidopsis were generated by genome duplication events in the last ~150 million years (Maere et al., 2005). Individual gene family expansion follows this rule similarly. Our results suggest that SsuHsf gene pairs have a higher substitution rate than those in P. trichocarpa. The great differences in evolutionary rates between the two species are correlated with their flowering habits: the early-flowering species (S. suchowensis flowers within 2 years) has faster substitution rates than the long-generation one (Dai et al., 2014).
In the investigation of conserved Hsf domains, we observed that a class A Hsf (SsuHsf-A9) lacked the AHA motif, which is essential for the transcription activity of Class A Hsf. In tomato, both of the AHA motifs in HsfA1 and HsfA2 have activator potential, and each can be replaced by the other (Döring et al., 2000). A likely reason for our observation is that SsuHsf-A9 exerts its functions by binding to other Class A Hsfs and forming hetero-oligomers.
SsuHsf involvement in developmental processes and stress responses
To survive in different environments, plants have evolved a series of defense strategies against various biotic and/or abiotic stresses (Ahuja et al., 2010). Increasing numbers of studies have reported that Hsfs play pivotal roles in stress tolerance by regulating gene expression (Bharti et al., 2004; Schramm et al., 2006; Giorno et al., 2010; Scharf et al., 2012). cis-elements have an essential function in the regulation of gene expression by controlling promoter efficiency (Lescot et al., 2002). Our in silico survey of the putative cis-elements showed that 20 of the 27 SsuHsfs have HSEs in their promoter regions. This implies that these SsuHsfs might be regulated by Hsfs themselves (Nover et al., 2001). Additionally, there are two leaf development related cis-elements (HD-Zip1 and HD-Zip2) in the promoter of SsuHsfA7a (Figure 6), which is consistent with its high expression in leaves (Figure 7).
The SsuHsfs were expressed in various tissues. Notably, members in the A1, A8, and B1 subclasses, such as SsuHsf-A1a, SsuHsf-A1b, SsuHsf-A1c, SsuHsf-A8a, SsuHsf-A8b, and SsuHsf-B1, were constitutively expressed in different tissues. Similar results have been found in Arabidopsis and apple. In Arabidopsis, Class A1 Hsfs are involved in house-keeping processes under normal conditions (Busch et al., 2005). In apple, members in the A1 and B1 subclasses are constitutively expressed in different tissues (Giorno et al., 2012).
Furthermore, the expression data indicated that four of the five duplicated gene pairs exhibited differences in their expression profiles, implying that they may be under different regulation in S. suchowensis tissues. Functional diversification of multifamily duplicated genes has been observed in woody species. For example, the Hsf and Hsp families in Populus are clearly divergent in their expression patterns in different tissues and in response to various stress treatments (Zhang et al., 2015). Therefore, the duplicated SsuHsfs may have undergone the sub-functionalization for development and/or specific stress conditions.
Studies using tomato and Arabidopsis have indicated that Hsfs are key regulators in developmental signaling (Schramm et al., 2006; Giorno et al., 2010). HsfA9 plays a unique role during embryogenesis and seed maturation in sunflower and Arabidopsis (Almoguera et al., 2002; Kotak et al., 2007). The expression of AtHsfA9 is regulated by a seed-specific transcription factor, ABSCISIC ACID-INSENSITIVE3, in Arabidopsis (Kotak et al., 2007). The interesting role of HsfA9 in seed development might be related with the ABA and auxin signal networks (Carranco et al., 2010). In S. suchowensis, HsfA9 was specifically expressed in the female catkin (Figure 7) and was induced by ABA treatment (Figure 8), indicating that the HsfA9 protein might have had a conserved function during evolution.
In Arabidopsis, AtHsfA1a and AtHsfA1b regulate the early response to heat stress (HS) (Lohmann et al., 2004). The expression of AtHsfA2 is rapidly induced by HS, and it can enhance and maintain the HSR when the HS is prolonged (Charng et al., 2007). Similarly to AtHsfA2, AtHsfA3 is involved in thermo-tolerance mechanisms (Schramm et al., 2008). In tomato, it was demonstrated that HsfA1a acts as the master regulator of the HSR and cannot be replaced by any other Hsf (Mishra et al., 2002). Although the Hsf members in Arabidopsis seem to be similar to those in tomato in composition and complexity, no master Hsf has been identified in Arabidopsis. The A1-type SsuHsfs were expressed at a similar level in leaves from plants growing in control and heat stress conditions, while SsuHsf-A2 and SsuHsf-A3 were strongly induced under heat stress conditions (Figure 8). This implies that the two SsuHsfs might maintain the HSR.
Compared with Class A Hsfs, the members in Class B and C have not been well-studied. The Class B Hsfs may act as transcription repressors or co-activators regulating acquired thermotolerance. Some of them form a complex with Class A Hsfs to maintain housekeeping gene expression during the HSR (Bharti et al., 2004). The function of Class C Hsf genes has not yet been fully identified. Notably, the expression of SsuHsf-B1, -B2a, -B2b, and -C1 was highly induced in heat, drought, and salt stresses, suggesting that these genes may play important roles in the response to abiotic stresses in S. suchowensis.
Conclusion
In this study, 27 members of the S. suchowensis Hsf gene family were identified. Comprehensive analyses of these genes, including phylogeny, gene structure, conserved motifs, and expression profiling in various tissues and under abiotic stresses, were performed. Based on structural characteristics and a comparison of the phylogenetic relationships among the S. suchowensis, P. trichocarpa, and A. thaliana Hsf families, the 27 SsuHsfs were classified into three classes (A, B, and C). Five gene pairs generated by duplication events were identified in the SsuHsf gene family. Expression analyses revealed that they may be involved in developmental processes and abiotic stress responses. This study gives an overview of the Hsfs in S. suchowensis and provides some insights into the responses of S. suchowensis to abiotic stresses, but how Hsfs participate in these responses requires further study.
Author contributions
JZ carried out all the experiments, data analysis and manuscript preparation. YL, HX, JB, and JH helped in data collection, sample preparation and RNA extraction. YL performed most of the RT-PCR experiments. JZ, JJ, and MZ conceived the project, designed the experiments, supervised the analysis and critically revised the manuscript. All authors read and approved the final manuscript.
Conflict of interest statement
The authors declare that the research was conducted in the absence of any commercial or financial relationships that could be construed as a potential conflict of interest.
Acknowledgments
This work was supported by National Nonprofit Institute Research Grant of CAF [TGB2013009] and [CAFYBB2014ZX001-4] to JJ and the China Postdoctoral Science Foundation [2014M550104] to JZ.
Supplementary material
The Supplementary Material for this article can be found online at: http://journal.frontiersin.org/article/10.3389/fpls.2015.00748
The complete coding sequences and the corresponding amino acid sequences of Hsf genes identified from S. suchowensis.
Primer sequences used in experiments.
Details of the expression data in Figure 8. The expression data correspond to log2 transformed values compared with control (0h). Data represent the average of three independent experiments ± SE.
Sequence identity of Hsf proteins in S. suchowensis, P. trichocarpa, and A. thaliana. Amino acid identity among Hsf proteins was analyzed in pairwise fashion.
References
- Ahuja I., de Vos R. C., Bones A. M., Hall R. D. (2010). Plant molecular stress responses face climate change. Trends Plant Sci. 15, 664–674. 10.1016/j.tplants.2010.08.002 [DOI] [PubMed] [Google Scholar]
- Almoguera C., Rojas A., Díaz-Martín J., Prieto-Dapena P., Carranco R., Jordano J. (2002). A seed-specific heat-shock transcription factor involved in developmental regulation during embryogenesis in sunflower. J. Biol. Chem. 277, 43866–43872. 10.1074/jbc.M207330200 [DOI] [PubMed] [Google Scholar]
- Bailey T. L., Boden M., Buske F. A., Frith M., Grant C. E., Clementi L., et al. (2009). MEME SUITE: tools for motif discovery and searching. Nucleic Acids Res. 37, W202–W208. 10.1093/nar/gkp335 [DOI] [PMC free article] [PubMed] [Google Scholar]
- Bharti K., Von Koskull-Döring P., Bharti S., Kumar P., Tintschl-Körbitzer A., Treuter E., et al. (2004). Tomato heat stress transcription factor HsfB1 represents a novel type of general transcription coactivator with a histone-like motif interacting with the plant CREB binding protein ortholog HAC1. Plant Cell 16, 1521–1535. 10.1105/tpc.019927 [DOI] [PMC free article] [PubMed] [Google Scholar]
- Bienz M., Pelham H. R. (1987). Mechanisms of heat-shock gene activation in higher eukaryotes. Adv. Genet. 24, 31–72. 10.1016/S0065-2660(08)60006-1 [DOI] [PubMed] [Google Scholar]
- Busch W., Wunderlich M., Schöffl F. (2005). Identification of novel heat shock factor−dependent genes and biochemical pathways in Arabidopsis thaliana. Plant J. 41, 1–14. 10.1111/j.1365-313X.2004.02272.x [DOI] [PubMed] [Google Scholar]
- Carranco R., Espinosa J. M., Prieto-Dapena P., Almoguera C., Jordano J. (2010). Repression by an auxin/indole acetic acid protein connects auxin signaling with heat shock factor-mediated seed longevity. Proc. Natl. Acad. Sci. U.S.A. 107, 21908–21913. 10.1073/pnas.1014856107 [DOI] [PMC free article] [PubMed] [Google Scholar]
- Charng Y. Y., Liu H. C., Liu N. Y., Chi W. T., Wang C. N., Chang S. H., et al. (2007). A heat-inducible transcription factor, HsfA2, is required for extension of acquired thermotolerance in Arabidopsis. Plant Physiol. 143, 251–262. 10.1104/pp.106.091322 [DOI] [PMC free article] [PubMed] [Google Scholar]
- Cokol M., Nair R., Rost B. (2000). Finding nuclear localization signals. EMBO Rep. 1, 411–415. 10.1093/embo-reports/kvd092 [DOI] [PMC free article] [PubMed] [Google Scholar]
- Dai X., Hu Q., Cai Q., Feng K., Ye N., Tuskan G. A., et al. (2014). The willow genome and divergent evolution from poplar after the common genome duplication. Cell Res. 24, 1274–1277. 10.1038/cr.2014.83 [DOI] [PMC free article] [PubMed] [Google Scholar]
- Delorenzi M., Speed T. (2002). An HMM model for coiled-coil domains and a comparison with PSSM-based predictions. Bioinformatics 18, 617–625. 10.1093/bioinformatics/18.4.617 [DOI] [PubMed] [Google Scholar]
- Döring P., Treuter E., Kistner C., Lyck R., Chen A., Nover L. (2000). The role of AHA motifs in the activator function of tomato heat stress transcription factors HsfA1 and HsfA2. Plant Cell 12, 265–278. 10.1105/tpc.12.2.265 [DOI] [PMC free article] [PubMed] [Google Scholar]
- Giorno F., Guerriero G., Baric S., Mariani C. (2012). Heat shock transcriptional factors in Malus domestica: identification, classification and expression analysis. BMC Genomics 13:639. 10.1186/1471-2164-13-639 [DOI] [PMC free article] [PubMed] [Google Scholar]
- Giorno F., Wolters-Arts M., Grillo S., Scharf K.-D., Vriezen W. H., Mariani C. (2010). Developmental and heat stress-regulated expression of HsfA2 and small heat shock proteins in tomato anthers. J. Exp. Bot. 61, 453–462. 10.1093/jxb/erp316 [DOI] [PMC free article] [PubMed] [Google Scholar]
- Guo J., Wu J., Ji Q., Wang C., Luo L., Yuan Y., et al. (2008). Genome-wide analysis of heat shock transcription factor families in rice and Arabidopsis. J. Genet. Genomics 35, 105–118. 10.1016/S1673-8527(08)60016-8 [DOI] [PubMed] [Google Scholar]
- Hanley S. J., Karp A. (2013). Genetic strategies for dissecting complex traits in biomass willows (Salix spp.). Tree Physiol. 34, 1167–1180. 10.1093/treephys/tpt089 [DOI] [PubMed] [Google Scholar]
- Hardison R. C. (1996). A brief history of hemoglobins: plant, animal, protist, and bacteria. Proc. Natl. Acad. Sci. U.S.A. 93, 5675. 10.1073/pnas.93.12.5675 [DOI] [PMC free article] [PubMed] [Google Scholar]
- Hu B., Jin J., Guo A.-Y., Zhang H., Luo J., Gao G. (2014). GSDS 2.0: an upgraded gene feature visualization server. Bioinformatics 31, 1296–1297. 10.1093/bioinformatics/btu817 [DOI] [PMC free article] [PubMed] [Google Scholar]
- Hübel A., Schöffl F. (1994). Arabidopsis heat shock factor: isolation and characterization of the gene and the recombinant protein. Plant Mol. Biol. 26, 353–362. 10.1007/BF00039545 [DOI] [PubMed] [Google Scholar]
- Hurst L. D. (2002). The Ka/Ks ratio: diagnosing the form of sequence evolution. Trends Genet. 18, 486–487. 10.1016/S0168-9525(02)02722-1 [DOI] [PubMed] [Google Scholar]
- Kotak S., Port M., Ganguli A., Bicker F., von Koskull-Döring P. (2004). Characterization of C−terminal domains of Arabidopsis heat stress transcription factors (Hsfs) and identification of a new signature combination of plant class A Hsfs with AHA and NES motifs essential for activator function and intracellular localization. Plant J. 39, 98–112. 10.1111/j.1365-313X.2004.02111.x [DOI] [PubMed] [Google Scholar]
- Kotak S., Vierling E., Bäumlein H., Von Koskull-Döring P. (2007). A novel transcriptional cascade regulating expression of heat stress proteins during seed development of Arabidopsis. Plant Cell 19, 182–195. 10.1105/tpc.106.048165 [DOI] [PMC free article] [PubMed] [Google Scholar]
- La Cour T., Kiemer L., Mølgaard A., Gupta R., Skriver K., Brunak S. (2004). Analysis and prediction of leucine-rich nuclear export signals. Proc. Natl. Acad. Sci. U.S.A. 17, 527–536. 10.1093/protein/gzh062 [DOI] [PubMed] [Google Scholar]
- Larkin M. A., Blackshields G., Brown N. P., Chenna R., McGettigan P. A., McWilliam H., et al. (2007). Clustal W and Clustal X version 2.0. Bioinformatics 23, 2947–2948. 10.1093/bioinformatics/btm404 [DOI] [PubMed] [Google Scholar]
- Lescot M., Déhais P., Thijs G., Marchal K., Moreau Y., van de Peer Y., et al. (2002). PlantCARE, a database of plant cis-acting regulatory elements and a portal to tools for in silico analysis of promoter sequences. Nucleic Acids Res. 30, 325–327. 10.1093/nar/30.1.325 [DOI] [PMC free article] [PubMed] [Google Scholar]
- Letunic I., Doerks T., Bork P. (2012). SMART 7: recent updates to the protein domain annotation resource. Nucleic Acids Res. 40, D302–D305. 10.1093/nar/gkr931 [DOI] [PMC free article] [PubMed] [Google Scholar]
- Lin Y.-X., Jiang H.-Y., Chu Z.-X., Tang X.-L., Zhu S.-W., Cheng B.-J. (2011). Genome-wide identification, classification and analysis of heat shock transcription factor family in maize. BMC Genomics 12:76. 10.1186/1471-2164-12-76 [DOI] [PMC free article] [PubMed] [Google Scholar]
- Lohmann C., Eggers-Schumacher G., Wunderlich M., Schöffl F. (2004). Two different heat shock transcription factors regulate immediate early expression of stress genes in Arabidopsis. Mol. Genet. Genomics 271, 11–21. 10.1007/s00438-003-0954-8 [DOI] [PubMed] [Google Scholar]
- Maere S., De Bodt S., Raes J., Casneuf T., van Montagu M., Kuiper M., et al. (2005). Modeling gene and genome duplications in eukaryotes. Proc. Natl. Acad. Sci. U.S.A. 102, 5454–5459. 10.1073/pnas.0501102102 [DOI] [PMC free article] [PubMed] [Google Scholar]
- Mishra S. K., Tripp J., Winkelhaus S., Tschiersch B., Theres K., Nover L., et al. (2002). In the complex family of heat stress transcription factors, HsfA1 has a unique role as master regulator of thermotolerance in tomato. Gene Dev. 16, 1555–1567. 10.1101/gad.228802 [DOI] [PMC free article] [PubMed] [Google Scholar]
- Morimoto R. I., Tissières A., Georgopoulos C. (1994). Progress and perspectives on the biology of heat shock proteins and molecular chaperones. Cold Spring Harbor Monograph. Arch. 26, 1–30. [Google Scholar]
- Nover L., Bharti K., Döring P., Mishra S. K., Ganguli A., Scharf K.-D. (2001). Arabidopsis and the heat stress transcription factor world: how many heat stress transcription factors do we need? Cell Stress Chaperons 6:177. [DOI] [PMC free article] [PubMed] [Google Scholar]
- Punta M., Coggill P. C., Eberhardt R. Y., Mistry J., Tate J., Boursnell C., et al. (2012). The Pfam protein families database. Nucleic Acids Res. 40, D290–D301. 10.1093/nar/gkr1065 [DOI] [PMC free article] [PubMed] [Google Scholar]
- Scharf K.-D., Berberich T., Ebersberger I., Nover L. (2012). The plant heat stress transcription factor (Hsf) family: structure, function and evolution. BBA Gene Regul. Mech. 1819, 104–119. 10.1016/j.bbagrm.2011.10.002 [DOI] [PubMed] [Google Scholar]
- Schöffl F., Prändl R., Reindl A. (1998). Regulation of the heat-shock response. Plant Physiol. 117, 1135–1141. 10.1104/pp.117.4.1135 [DOI] [PMC free article] [PubMed] [Google Scholar]
- Schramm F., Ganguli A., Kiehlmann E., Englich G., Walch D., Von Koskull-Döring P. (2006). The heat stress transcription factor HsfA2 serves as a regulatory amplifier of a subset of genes in the heat stress response in Arabidopsis. Plant Mol. Biol. 60, 759–772. 10.1007/s11103-005-5750-x [DOI] [PubMed] [Google Scholar]
- Schramm F., Larkindale J., Kiehlmann E., Ganguli A., Englich G., Vierling E., et al. (2008). A cascade of transcription factor DREB2A and heat stress transcription factor HsfA3 regulates the heat stress response of Arabidopsis. Plant J. 53, 264–274. 10.1111/j.1365-313X.2007.03334.x [DOI] [PubMed] [Google Scholar]
- Shao Y., Wei G., Wang L., Dong Q., Zhao Y., Chen B., et al. (2011). Genome-wide analysis of BURP domain-containing genes in Populus trichocarpa. J. Integr. Plant Biol. 53, 743–755. 10.1111/j.1744-7909.2011.01068.x [DOI] [PubMed] [Google Scholar]
- Tamura K., Peterson D., Peterson N., Stecher G., Nei M., Kumar S. (2011). MEGA5: molecular evolutionary genetics analysis using maximum likelihood, evolutionary distance, and maximum parsimony methods. Mol. Biol. Evol. 28, 2731–2739. 10.1093/molbev/msr121 [DOI] [PMC free article] [PubMed] [Google Scholar]
- Von Koskull-Döring P., Scharf K.-D., Nover L. (2007). The diversity of plant heat stress transcription factors. Trends Plant Sci. 12, 452–457. 10.1016/j.tplants.2007.08.014 [DOI] [PubMed] [Google Scholar]
- Zhang J., Li J., Liu B., Zhang L., Chen J., Lu M. (2013). Genome-wide analysis of the Populus Hsp90 gene family reveals differential expression patterns, localization, and heat stress responses. BMC Genomics 14:532. 10.1186/1471-2164-14-532 [DOI] [PMC free article] [PubMed] [Google Scholar]
- Zhang J., Liu B., Li J., Zhang L., Wang Y., Zheng H., et al. (2015). Hsf and Hsp gene families in Populus: genome-wide identification, organization and correlated expression during development and in stress responses. BMC Genomics 16, 1–19. 10.1186/s12864-015-1398-3 [DOI] [PMC free article] [PubMed] [Google Scholar]
Associated Data
This section collects any data citations, data availability statements, or supplementary materials included in this article.
Supplementary Materials
The complete coding sequences and the corresponding amino acid sequences of Hsf genes identified from S. suchowensis.
Primer sequences used in experiments.
Details of the expression data in Figure 8. The expression data correspond to log2 transformed values compared with control (0h). Data represent the average of three independent experiments ± SE.
Sequence identity of Hsf proteins in S. suchowensis, P. trichocarpa, and A. thaliana. Amino acid identity among Hsf proteins was analyzed in pairwise fashion.


