Abstract
Several magnetic properties have recently become tunable with an applied electric field. Particularly, electrically controlled magnetic phase transitions and/or magnetic moments have attracted attention because they are the most fundamental parameters in ferromagnetic materials. In this study, we showed that an electric field can be used to control the magnetic moment in films made of Pd, usually a non-magnetic element. Pd ultra-thin films were deposited on ferromagnetic Pt/Co layers. In the Pd layer, a ferromagnetically ordered magnetic moment was induced by the ferromagnetic proximity effect. By applying an electric field to the ferromagnetic surface of this Pd layer, a clear change was observed in the magnetic moment, which was measured directly using a superconducting quantum interference device magnetometer. The results indicate that magnetic moments extrinsically induced in non-magnetic elements by the proximity effect, as well as an intrinsically induced magnetic moments in ferromagnetic elements, as reported previously, are electrically tunable. The results of this study suggest a new avenue for answering the fundamental question of “can an electric field make naturally non-magnetic materials ferromagnetic?”
Application of an electric fields is a useful tool for controlling the magnetism of magnetic materials1,2,3,4,5,6,7,8,9,10,11,12,13,14,15,16,17,18,19,20,21,22,23,24,25,26,27,28 as well as the conductivity of semiconductors. Many studies have been reported, including that of ferromagnetic metals at room temperature4,7,14,15,17,18,19,20,21,22,23,24,25,26,27, using a capacitor structure, with which carrier density can be controlled by applying a gate voltage. Electric-field-induced magnetization switching may drastically reduce power consumption in magnetic recording devices2,7,8,13,22,23,24,25,26,27.
The changes in material’s magnetic properties induced by an electric field are considered to be related to a change in carrier density and, in turn, a shift of the Fermi level. Therefore, we expect that the application of an electric field may make naturally non-magnetic materials ferromagnetic5,12. Pt and Pd are usually non-magnetic metals that nearly satisfy the Stoner criterion29,30,31. Ab initio calculations have shown that the peak of the density of the states of bulk non-magnetic Pt or Pd is located at an energy near the Fermi level29, suggesting that an applied electric field may affect the magnetic state in these materials3,5,12,26. It is also known that a magnetic moment is induced by the ferromagnetic proximity effect in a Pt or Pd layer deposited on a ferromagnetic metal layer32,33,34,35,36,37. In the present study, we investigated whether the magnetic moment induced in Pd can be electrically controlled. We prepared Pt/Co/Pd structures and observed a clear change in their magnetic moments as a result of applying an electric field to the ferromagnetic surface of the Pd layer. The results indicate that the magnetic moment extrinsically induced in non-magnetic elements by the proximity effect is electrically tunable.
Results
Ferromagnetic proximity effect on Pd deposited on Pt/Co layers
Ta(~3 nm)/Pt(4.1 nm)/Co(tCo)/Pd(1.7 nm)/MgO(~2 nm) layers (Pt/Co/Pd samples) from the substrate side were deposited on an intrinsic Si substrate using rf sputtering. Samples without a Pd layer (Pt/Co samples) were also prepared as reference samples to confirm that the magnetic moment was induced in a Pd layer of Pt/Co/Pd samples by the ferromagnetic proximity effect before applying an electric field. Pd and Pt layers were confirmed to have an fcc (111) texture using X-ray diffraction measurement. All of the Pt/Co/Pd and Pt/Co samples we used in this study were confirmed to have perpendicular magnetic anisotropy. Figure 1 shows the tCo dependence of the saturation magnetic moment per unit area (ms/S) for the both samples. As shown in the figure, the ms/S values of the Pt/Co/Pd samples were greater than those of the Pt/Co samples for all tCo values, indicating that a magnetic moment was induced in the Pd layer. Assuming that the magnetic moment is uniformly induced in the entire Pd layer, the induced magnetic moment per Pd atom is calculated to be ~0.1μB (μB is the Bohr magneton), the order of which is in good agreement with previous studies32,34,35. The Pd layer thickness dependence indicates that the magnetic moment induced in the Pd layer saturates at tPd ~ 2 nm (not shown), suggesting that ~2 nm is the distance limit of the proximity effect from the Co/Pd interface35. Thus, in the present sample (tPd = 1.7 nm < 2 nm), a finite magnetic moment is expected to be induced in the uppermost Pd atomic layer, but the magnetic moment per Pd atom there is considered to be less than 0.1μB because the magnetic moment induced by the ferromagnetic proximity effect is known to decrease with increasing distance from the interface34,36.
Figure 1. Co thickness tCo dependence of the perpendicular component of the saturation magnetic moment per unit area at 10 K (ms/S) for Pt/Co (black circles) and Pt/Co/Pd (red triangles) samples.
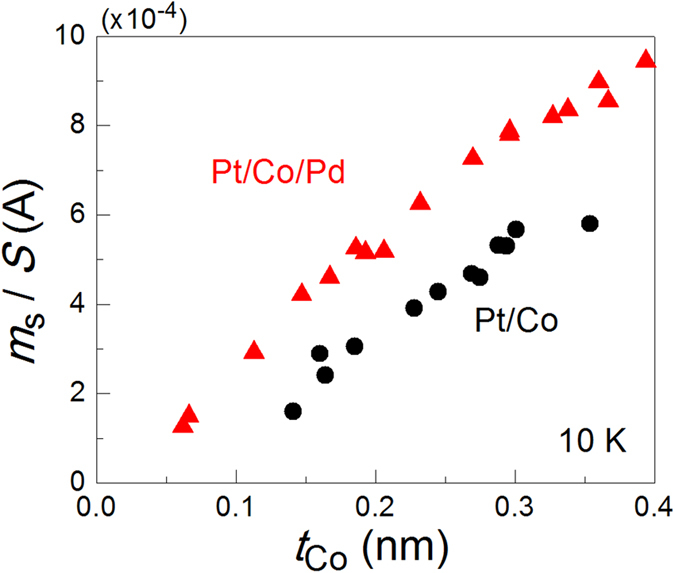
The ms/S values of the Pt/Co/Pd samples were greater than those of the Pt/Co samples for all tCo values, indicating that a magnetic moment was induced in the Pd layer because of the ferromagnetic proximity effect.
Fabrication of the devices and experimental setup for magnetic moment measurement under applied electric field
An electric-double-layer (EDL) capacitor structure was used to modulate the electron density in the Pd surface3,4,11,15,16,18,26. The structure consisted of an Au gate electrode, a polymer film containing an ionic liquid (ionic liquid film)18, and a Pt/Co/Pd sample (Fig. 2). Two Pt/Co/Pd samples with tCo values of 0.10 and 0.19 nm (samples A and B, respectively) were used in the experiment. The ionic liquid we used was composed of an N,N,N-trimethyl-N-propylammonium (TMPA+) cation and a bis(trifluoromethylsulfonyl)imide (TFSI-) anion. The EDL capacitor was fabricated by simply placing the ionic liquid film with the evaporated Au gate electrode (50 nm) on the Pt/Co/Pd sample. The area covered by the ionic liquid film (Sion-film) was slightly less than the total area of the Pt/Co/Pd sample (Stotal). Au wires were connected to the Au gate electrode and the Pt/Co/Pd metallic layers to apply a gate voltage VG between them. A positive VG corresponded to the direction of increase in the electron density at the Pd surface. The device was introduced into a superconducting quantum interference device magnetometer to measure the magnetic moment directly under the application of VG6,18.
Figure 2. Schematic cross section of the device.
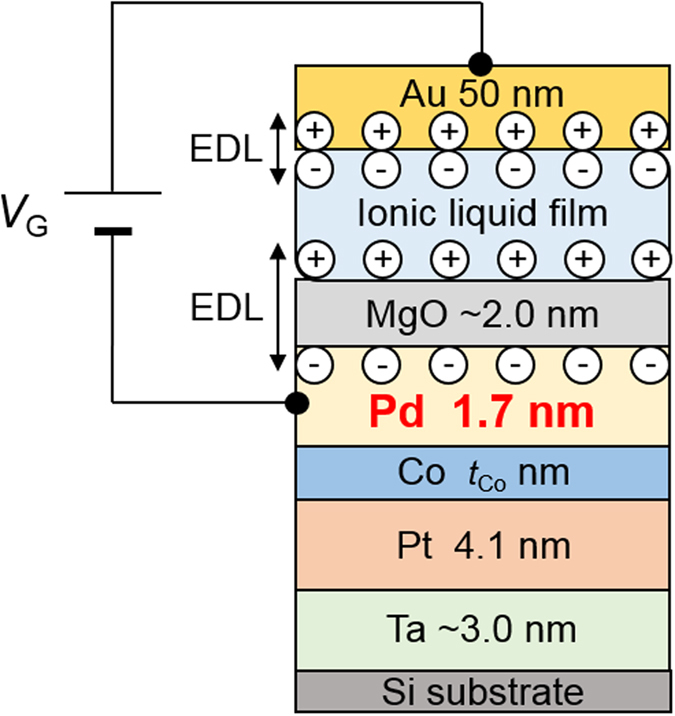
A polymer film containing an ionic liquid (ionic liquid film) was used to apply an electric field to the surface of the Pd layer, in which a magnetic moment was induced. By applying a gate voltage VG, a pair of electric double layers (EDL) was formed at the top and bottom interfaces of the ionic liquid film. The formation of the bottom EDL resulted in a change in the electron density at the surface of the Pd layer. Because of Thomas–Fermi screening, only the electron density at the uppermost Pd layer was expected to be modulated.
Magnetic moment under electric field
Figure 3(a) shows the temperature T dependence of the perpendicular component of the magnetic moment m┴ divided by Stotal for both samples A and B under VG = + 2.0 and −2.0 V. After VG was changed at 300 K under a perpendicular magnetic field μ0H┴ of ~20 mT, T was decreased to 10 K. Subsequently, μ0H┴ was reduced to nearly zero (1.5 ± 0.1 mT), and the m┴ shown in Fig. 3(a) was measured by increasing T. Below the Curie temperature TC, a clear difference in m┴/Stotal was observed with the change in VG for both samples: a positive (negative) VG, i.e., larger (smaller) electron density at the Pd surface, resulted in a larger (smaller) m┴/Stotal. The difference in m┴ between VG = + 2.0 and –2.0 V (Δm┴( ± 2 V)) was found to increase linearly with decreasing temperature, as shown in Fig. 3(b), in which Δm┴(±2 V) was divided by Sion-film because the magnetic moment should be modulated in the area covered by the ionic liquid film. It should be noted that m┴ was nearly equal to ms because the squareness ratio m┴/ms of the hysteresis loops was ~1 under VG = ± 2.0 V at a temperature of at least 10 K, as indicated in the inset of Fig. 3(a). The anomalous Hall effect was used to detect the hysteresis loop under the application of VG. Although the change in TC up to 100 K was reported for a Pt/Co sample with a similar device structure18, TC was not clearly dependent on VG in the present Pt/Co/Pd samples. Δm┴( ± 2 V) deviates significantly from the linear fitting immediately before it intercepts the horizontal axis, as indicated by the downward arrows in Fig. 3(b), which might imply the occurrence of a small change in TC.
Figure 3.
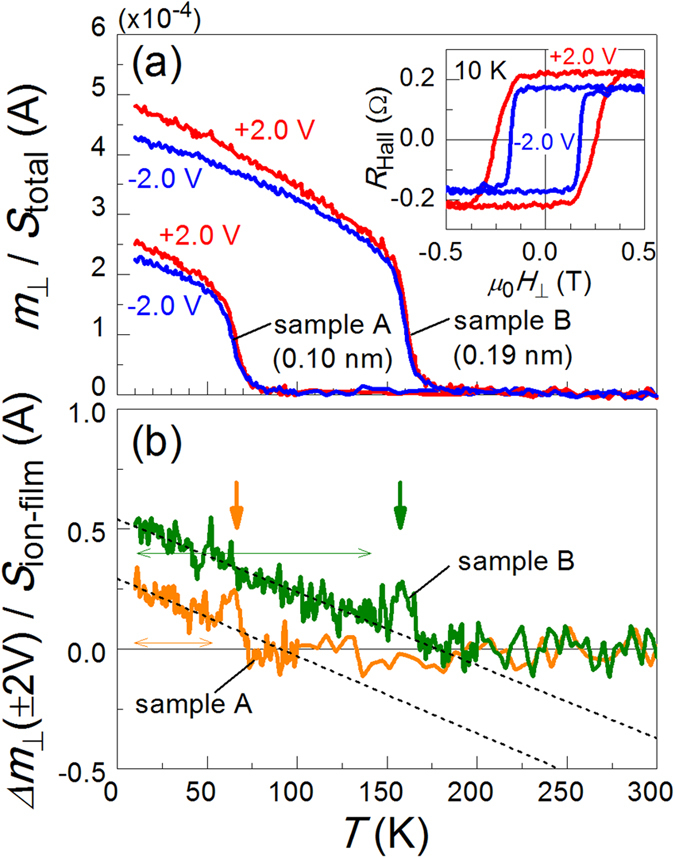
(a) Temperature T dependence of the perpendicular component of the magnetic moment m┴ normalised by the total sample area Stotal at VG = ± 2.0 V for samples A (Co layer thickness tCo = 0.10 nm) and B (tCo = 0.19 nm). Up to 100 K (200 K) for sample A (B), the temperature was increased by 2 K/min, and the averaged m┴ were measured every 1 K. For averaging, two data points were acquired in the range of 0.2 K, which was much smaller than the temperature interval (1 K) of each averaged m┴. The inset shows the hysteresis loops observed in the Hall resistance (RHall) at 10 K at VG = ± 2.0 V for sample A, from which the squareness ratio of the loops was confirmed to be ~1, regardless of the value of VG. (b) The difference between m┴ for VG = + 2.0 and –2.0 V Δm┴(±2 V) is shown as a function of temperature for samples A and B. The Δm┴ (±2 V) shown on the vertical axis was divided by the area covered by the ionic liquid film (Sion-film). The dashed lines indicate the results of the linear fitting using the data within the range indicated by the double-headed horizontal arrows.
Discussion
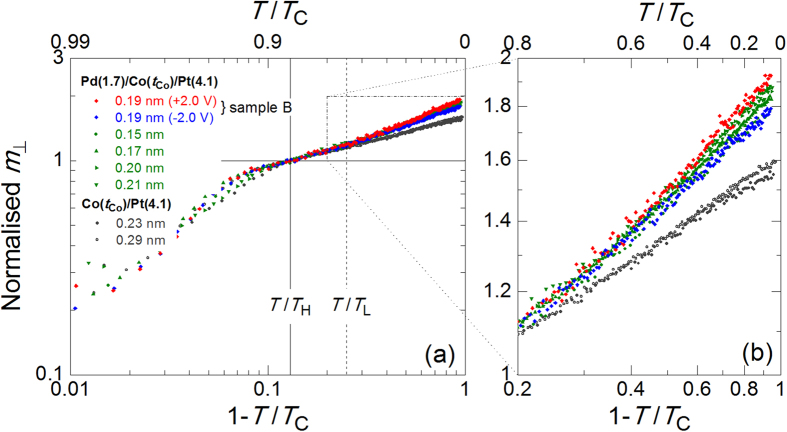
We first analysed the temperature dependence of m┴ for the Pt/Co/Pd and Pt/Co samples. The reduction in the magnetic moment m near TC can be quantified using a critical exponent β as m ~ (1 − T/TC)β. Figure 4(a) shows a double-logarithmic plot of the normalised m┴ as a function of 1 − T/TC for several samples with TC in the range of 157–341 K, including sample B, under an applied electric field (see Table 1 for details of the samples). The value of β was determined from the slope of the linear fitting to the data37,38 in the range of TL/TC (=0.75) to TH/TC (=0.87) (see Methods for details of the analysis). The value of m┴ in the figure was normalised by its value at TH/T. The value of β was ~0.2 in the Pt/Co samples and ranged from 0.22 to 0.30 in the Pt/Co/Pd samples. From the magnified figure shown in Fig. 4(b), one can clearly see that as 1 − T/TC increased (in other words, as the temperature decreased), the difference in the normalised m┴ values between the Pt/Co/Pd and Pt/Co samples increased, i.e., the magnetic moment in the Pt/Co/Pd samples increased more rapidly at lower temperatures. This behaviour occurred because the β value of the Pt/Co/Pd samples was higher than that of the Pt/Co samples and/or because the magnetic moment in the ferromagnetic Pd layer is greater at lower temperatures35,37. The latter factor is most likely dominant here because the linearity of the normalised m┴ degrades as 1 − T/TC increases in the double-logarithmic scale. Other important points to consider in understanding the electric-field effect observed in this study are as follows. (i) A larger change in the magnetic moment was observed with the application of VG in the Pt/Co/Pd samples at lower temperatures, as shown in Figs 3(b) and 4(b). (ii) The data points for the Pt/Co/Pd samples without an applied electric field (indicated by the green symbols in Fig. 4) are almost entirely located between the ones obtained under positive and negative VG (indicated by the red and blue symbols) at any temperature T < TL. (iii) As shown in Fig. 3(b), the difference between m┴ under positive and negative VG (Δm┴(±2 V)) increased linearly with decreasing temperature. This can probably be attributed to the linear temperature dependence of the magnetic susceptibility of Pd deposited on the layer consisting of the ferromagnetic element35,37. These experimental results, which show good reproducibility in similar structures (see Methods), demonstrate that the induced magnetic moment at the surface of the Pd layer was increased and decreased by the application of positive and negative VG, respectively.
Figure 4.
(a) Double-logarithmic plot of the normalised m┴ as a function of 1 − T/TC for several samples listed in Table 1. (b) Magnified view of the region indicated by the dashed-dotted line in (a). T/TH and T/TL in the figure indicates the range for the fitting performed to obtain the critical exponent β. The values of m┴ on the vertical axis were normalised by the value at T/TH. The magnetic moment in the Pt/Co/Pd samples increased more rapidly than that in the Pt/Co samples as 1 − T/TC increased (in other words, as the temperature was reduced). The data points for the Pt/Co/Pd samples to which an electric field were not applied (green symbols) were confirmed to lie almost entirely between the ones obtained under the application of positive and negative VG to sample B (red and blue symbols) at a temperature T < TL.
Table 1. Properties of the Pt/Co/Pd and Pt/Co samples used in Fig. 4.
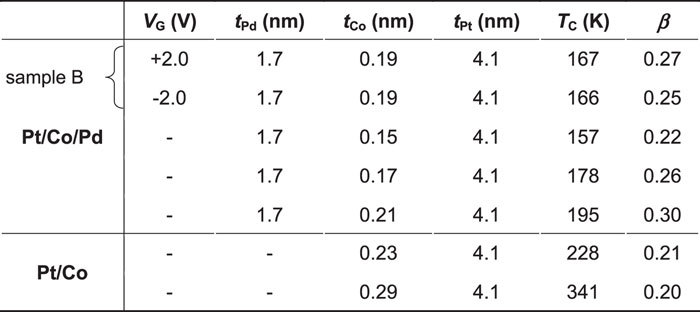
The thicknesses of the Pd, Co, and Pt layers (tPd, tCo, and tPt); TC; and the critical exponent β determined from the fitting (see Methods for details of the determination) are summarised.
We next analysed the change in m┴ (Δm┴) for samples A and B upon application of an electric field. Figures 5(a,b) show Δm┴/Sion-film at 10 K for both samples as a function of VG. Each data point was obtained from the temperature dependence of m┴ at 10 K under each VG. VG was applied in the order indicated by the arrows in the figures. Although hysteresis behaviour was observed with round-trip VG application, the tendency of Δm┴ to increase (decrease) with positive (negative) VG application was reproduced in both samples. The change in the magnetic moment per Pd atom was determined from the linear fitting, as shown in the figures, based on the following assumptions. Pd has an fcc (111) structure, and only the magnetic moment in the uppermost atomic layer was changed because only the electron density there was changed attributed to Thomas–Fermi screening (see Methods for details of the capacitance measurement). The calculated value of the magnetic moment for sample A (B) was 0.050 ± 0.023μB (0.078 ± 0.013μB) per VG of 1.0 V. The change in the electron number ΔN for sample A (B) per Pd atom and per VG of 1.0 V was calculated to be 0.049 (0.034). ΔN was determined from the capacitance C of the devices divided by Sion-film.
Figure 5. Change in the perpendicular component of the magnetic moment (Δm┴) at 10 K normalised by Sion-film for samples (a) A and (b) B as a function of VG.
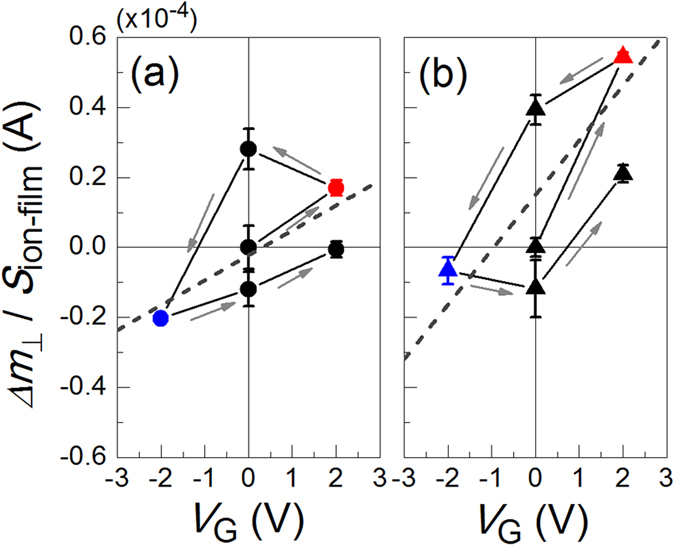
VG was changed at 300 K, and the temperature was reduced to measure each value of m┴ at 10 K. The dashed line indicates the linear fitting to the averaged Δm┴/S at each VG, from which the change in the magnetic moment per Pd atom was determined.
According to the ab initio calculation for Pd, the density-of-states peak appears at an energy level slightly lower than the Fermi level29. Thus, a decrease in the electron density should theoretically lead to an increase in the magnetic moment5,12. Our results, however, were the opposite. Support from theoretical calculations is clearly needed to understand our results. The state of the Pd in our sample structure was different from that in the bulk case in the following respects: (1) the magnetic moment was already induced in the Pd layer (thus, spin splitting was already induced); and (2) the Pd layer was very thin, and interfaces were formed between the Co and MgO layers. In addition, we note that in a Pt/Co system, in which the electric field induced changes in TC and a magnetic moment was reported17,18, ab initio calculations indicated that the number of 3d electrons can be decreased even when an electric field is applied in the direction of increase in the total electron number because the number of sp electrons increases28. This explains the discrepancy between the experimental results and the outcome suggested by the Slater–Pauling curve for the Co case. This scenario may be applicable even to the present 4d electron system (Pd). Furthermore, reversible chemical effects, such as the migration of oxygen atoms from the MgO27 cap or of hydrogen absorption in the Pd layer39 by VG applications might be related to a change in the electron state and thus to a change in the magnetic moment induced in Pd. From an experimental perspective, the next challenge is to induce ferromagnetism electrically in naturally non-magnetic materials beyond that attributable to the ferromagnetic proximity effect.
Methods
Determination of T C
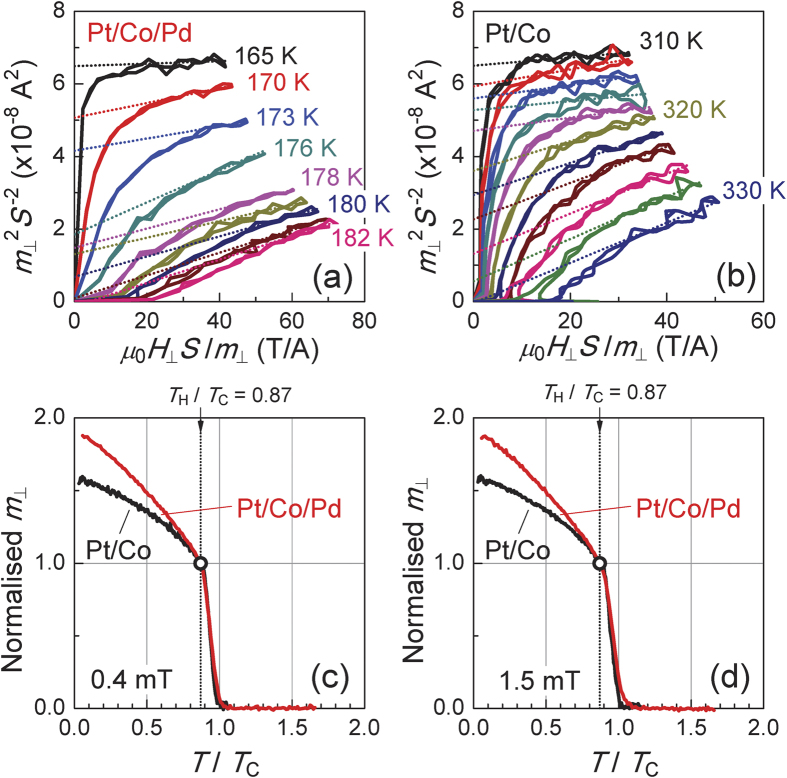
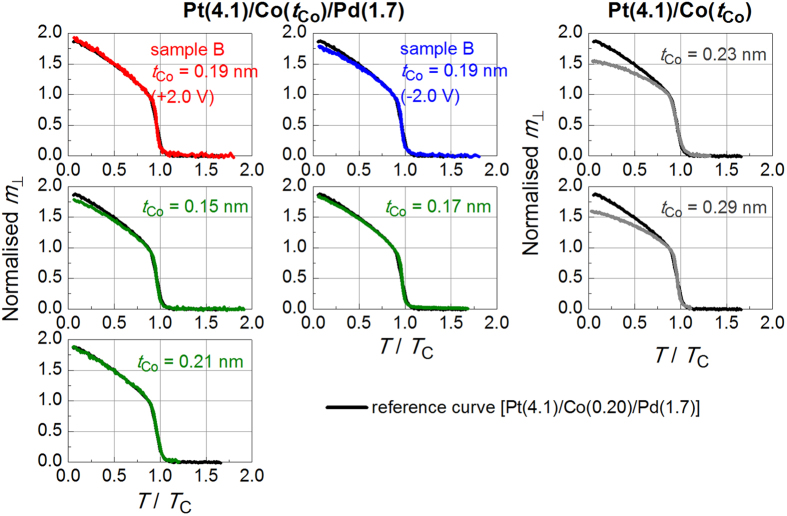
Figures 6(a,b) show the Arrott plots40 for two reference samples, a Pt/Co/Pd sample with tCo = 0.20 nm and tPd = 1.7 nm and a Pt/Co sample with tCo = 0.32 nm, respectively. From the plots, the TC of the Pt/Co/Pd (the Pt/Co) reference sample was determined to be 181 (329) K. The T/TC dependence of m┴ at μ0H┴ = 0.4 (±0.1) mT for both reference samples is shown in Fig. 6(c), in which the vertical axis is normalised by an m┴ value at T/TC = 0.87. In both samples, m┴ decreased rapidly below TC. This was most likely because of the formation of a multi-domain state, as observed in similar Pt/Co samples17,41. The important point is that, as long as μ0 H┴ was the same (see Figs 6(c,d)), the two curves for Pt/Co/Pd and Pt/Co reference samples overlap very well in this temperature region, even though these samples have different sample structures and TC values. This suggests that as long as TC is known for one reference sample, one can determine the TC of another sample by comparing the m┴–T curves. Figure 7 presents a summary of the comparison of the results for the samples listed in Table 1 (coloured line) and the Pt/Co/Pd reference sample (black line). Adjusting the TC values of the samples resulted in the normalised curves overlapping well with the reference curve. The TC values of the samples listed in Table 1 were determined in this way. The difference in TC for these samples determined using the Pt/Co/Pd and Pt/Co reference samples was at most 1–2%. The Arrott–Noakes (AN) plot42 may provide more accurate TC for the present two-dimensional system. However, the difference in TC determined from the Arrott and AN plots is only 1–2%17. In comparing many samples without difficulty and confirming the most important finding of this study, i.e., the induced magnetic moment in the Pd layer being increased or decreased by applying an electric field, we believe that the Arrott plot and the above-mentioned way of determining TC were useful method. We note that using a similar Pt/Co/Pd sample with a TC of ~190 K (not shown in Table 1) confirms the reproducibility of the results, i.e., the data points for the sample without an applied electric field are almost entirely located between the points obtained for similar samples under positive and negative VG at any temperature T < TL.
Figure 6.
(a,b) The Arrott plots for the Pt/Co/Pd and the Pt/Co reference samples, respectively. (c,d) The normalised temperature (T/TC) dependence of the normalised magnetic moment (m┴) for both reference samples at 0.4 (±0.1) mT and 1.5 (±0.1) mT, respectively. The vertical axes in (c,d) were normalised by the m┴ value at T/TC = 0.87.
Figure 7. T/TC dependence of the normalised m┴ for all samples listed in Table 1.
The black line indicates the results obtained for the Pt/Co/Pd reference sample. The results are indicated by coloured lines. All m┴ was measured at 1.5 (±0.1) mT and the vertical axes were normalised by the m┴ value at T/TC = 0.87.
Determination of the critical exponent β
The value of β was determined from the slope of the linear line fitted to the normalised m┴ data in the range between TL/TC (=0.75) and TH/TC (=0.87) on a double-logarithmic scale (see Fig. 4a). The fitting range was determined from the linearity of the data. It was difficult to perform a reliable fitting to the data for sample A because there were not enough data points in the fitting range.
Capacitance measurement
The capacitance C of samples A and B was measured using a capacitance meter and applying an ac voltage with an amplitude of 0.1 V and frequency f of 100 Hz. In addition, the f dependence of C for a similar device showed that C increases slightly with decreasing f. Although further experiments are needed to determine an accurate value for ΔN under a dc gate voltage, the value of C estimated using the above experimental results for f = 0.01 Hz, which was the lowest value of f in the experiment, was used to calculate the ΔN described in this report. The values of C/Sion-film at f = 0.01 Hz for samples A and B were 12 and 8.3 μF/cm2, respectively.
Additional Information
How to cite this article: Obinata, A. et al. Electric-field control of magnetic moment in Pd. Sci. Rep. 5, 14303; doi: 10.1038/srep14303 (2015).
Acknowledgments
The authors thank Prof. Kozuka, Prof. Kawasaki, and Prof. Tsukazaki for their technical assistance. This work was partly supported by a Grant-in-Aid for Scientific Research (S) (No. 25220604) and (B) (No. 26288115) from JSPS and a research grant from the Foundation for the Promotion of Ion Engineering. A portion of this work was performed using the facilities of the Cryogenic Research Center of the University of Tokyo.
Footnotes
Author Contributions D.C. planned and supervised the study. A.O., Y.H. and D.H. prepared samples. A.O. and D.H. fabricated the device. K.M. and S.O. provided the ionic liquid films. A.O., T.K. and D.C. set up the measurement apparatus. A.O. collected and analysed the data. Y.H. collected the data on the dependence of the magnetic moment on the Pd layer thickness. D.H. checked the reproducibility of the electric-field effect. A.O., T.K. and D.C. wrote the manuscript. All authors discussed the results.
References
- Ohno H. et al. Electric-field control of ferromagnetism. Nature 408, 944–946 (2000). [DOI] [PubMed] [Google Scholar]
- Chiba D., Yamanouchi M., Matsukura F. & Ohno H. Electrical manipulation of magnetization reversal in a ferromagnetic semiconductor. Science 301, 943–945 (2003). [DOI] [PubMed] [Google Scholar]
- Drings H. et al. Tuneable magnetic susceptibility of nanocrystalline palladium. Appl. Phys. Lett. 88, 253103 (2006). [Google Scholar]
- Weisheit M. et al. Electric field-induced modification of magnetism in thin-film ferromagnets. Science 315, 349–351 (2007). [DOI] [PubMed] [Google Scholar]
- Kudasov Y. B. & Korshunov A. S. Surface ferromagnetism of palladium induced by strong electric field. Phys. Lett. A 364, 348–351 (2007). [Google Scholar]
- Sawicki M. et al. Experimental probing of the interplay between ferromagnetism and localization in (Ga, Mn)As. Nature Phys. 6, 22–25 (2010). [Google Scholar]
- Maruyama T. et al. Large voltage-induced magnetic anisotropy change in a few atomic layers of iron. Nature Nanotech. 4, 158–161 (2009). [DOI] [PubMed] [Google Scholar]
- Stöhr J., Siegmann H. C., Kashuba A. & Gamble S. J. Magnetization switching without charge or spin currents. Appl. Phys. Lett. 94, 072504 (2009). [Google Scholar]
- Nakamura K. et al. Giant modification of the magnetocrystalline anisotropy in transition-metal monolayers by an external electric field. Phys. Rev. Lett. 102, 187201 (2009). [DOI] [PubMed] [Google Scholar]
- Tsujikawa M. & Oda T. Finite electric field effects in the large perpendicular magnetic anisotropy surface Pt/Fe/Pt(001): A first-principles study. Phys. Rev. Lett. 102, 247203 (2009). [DOI] [PubMed] [Google Scholar]
- Endo M. et al. Electric double layer transistor with a (Ga, Mn)As channel. Appl. Phys. Lett. 96, 022515 (2010). [Google Scholar]
- Sun Y., Burton J. D. & Tsymbal E. Y. Electrically driven magnetism on a Pd thin film. Phys. Rev. B 81, 064413 (2010). [Google Scholar]
- Chiba D., Nakatani Y., Matsukura F. & Ohno H. Simulation of magnetization switching by electric-field manipulation of magnetic anisotropy. Appl. Phys. Lett. 96, 192506 (2010). [Google Scholar]
- Endo M., Kanai S., Ikeda S., Matsukura F. & Ohno H. Electric-field effects on thickness dependent magnetic anisotropy of sputtered MgO/Co40Fe40B20/Ta structures. Appl. Phys. Lett. 96, 212503 (2010). [Google Scholar]
- Zhernenkov M. et al. Electric-field modification of magnetism in a thin CoPd film. Phys. Rev. B 82, 024420 (2010). [Google Scholar]
- Yamada Y. et al. Electrically induced ferromagnetism at room temperature in cobalt-doped titanium dioxide. Science 332, 1065–1067 (2011). [DOI] [PubMed] [Google Scholar]
- Chiba D. et al. Electrical control of the ferromagnetic phase transition in cobalt at room temperature. Nature Mater. 10, 853–856 (2011). [DOI] [PubMed] [Google Scholar]
- Shimamura K. et al. Electrical control of Curie temperature in cobalt using an ionic liquid film. Appl. Phys. Lett. 100, 122402 (2012). [Google Scholar]
- Bauer U., Emori S. & Beach G. S. D. Electric field control of domain wall propagation in Pt/Co/GdOx films. Appl. Phys. Lett. 100, 192408 (2012). [Google Scholar]
- Schellekens A. J., van den Brink A., Franken J. H., Swagten H. J. M. & Koopmans B. Electric-field control of domain wall motion in perpendicularly magnetized materials. Nature Comm. 3, 847 (2012). [DOI] [PubMed] [Google Scholar]
- Chiba D. et al. Electric-field control of magnetic domain-wall velocity in ultrathin cobalt with perpendicular magnetization. Nature Comm. 3, 888 (2012). [DOI] [PubMed] [Google Scholar]
- Shiota Y. et al. Induction of coherent magnetization switching in a few atomic layers of FeCo using voltage pulses. Nature Mater. 11, 39–43 (2012). [DOI] [PubMed] [Google Scholar]
- Wang W.-G., Li M., Hageman S. & Chien C. L. Electric-field-assisted switching in magnetic tunnel junctions. Nature Mater. 11, 64–68 (2012). [DOI] [PubMed] [Google Scholar]
- Kanai S. et al. Electric field-induced magnetization reversal in a perpendicular-anisotropy CoFeB-MgO magnetic tunnel junction. Appl. Phys. Lett. 101, 122403 (2012). [Google Scholar]
- Chiba D., Ono T., Matsukura F. & Ohno H. Electric field control of thermal stability and magnetization switching in (Ga, Mn)As. Appl. Phys. Lett. 103, 142418 (2013). [Google Scholar]
- Shimizu S. et al. Electrically tunable anomalous Hall effect in Pt thin films. Phys. Rev. Lett. 111, 216803 (2013). [DOI] [PubMed] [Google Scholar]
- Bauer U. et al. Magneto-ionic control of interfacial magnetism. Nature Mater. 14, 174–181 (2015). [DOI] [PubMed] [Google Scholar]
- Oba M. et al. Electric-field-induced modification of the magnon energy, exchange interaction, and Curie temperature of transition-metal thin films. Phys. Rev. Lett. 114, 107202 (2015). [DOI] [PubMed] [Google Scholar]
- MacDonald A. H., Daams J. M., Vosko S. H. & Koelling D. D. Influence of relativistic contributions to the effective potential on the electronic structure of Pd and Pt. Phys. Rev. B 23, 6377–6398 (1981). [Google Scholar]
- Sigalas M. M. & Papaconstantopoulos D. A. Calculations of the total energy, electron-phonon interaction, and Stoner parameter for metals. Phys. Rev. B 50, 7255–7261 (1994). [DOI] [PubMed] [Google Scholar]
- Shinohara T., Sato T. & Taniyama T. Surface ferromagnetism of Pd fine particles. Phys. Rev. Lett. 91, 197201 (2003). [DOI] [PubMed] [Google Scholar]
- Gradmann U. & Bergholz R. Magnetization of Pd (111) films by contact with ferromagnetic Ni (111) films. Phys. Rev. Lett. 52, 771–774 (1984). [Google Scholar]
- den Broeder F. J. A., Donkersloot H. C., Draaisma H. J. G. & de Jonge W. J. M. Magnetic properties and structure of Pd/Co and Pd/Fe multilayers. J. Appl. Phys. 61, 4317–4319 (1987). [Google Scholar]
- Wu R., Li C. & Freeman A. J. Structual, electronic and magnetic properties of Co/Pd(111) and Co/Pt(111). J. Magn. Magn. Mater. 99, 71–80 (1991). [Google Scholar]
- Cheng L. et al. Pd polarization and interfacial moments in Pd-Fe multilayers. Phys. Rev. B 69, 144403 (2004). [Google Scholar]
- Suzuki M. et al. Depth profile of spin and orbital magnetic moments in a subnanometer Pt film on Co. Phys. Rev. B 72, 054430 (2005). [Google Scholar]
- Hase T. P. A. et al. Proximity effects on dimensionality and magnetic ordering in Pd/Fe/Pd trialyers. Phys. Rev. B 90, 104403 (2014). [Google Scholar]
- Dürr W. et al. Magnetic phase transition in two-dimensional ultrathin Fe films on Au(100). Phys. Rev. Lett. 62, 206–209 (1989). [DOI] [PubMed] [Google Scholar]
- Manago T., Otani Y., Miyajima H. & Akiba E. Magnetic properties and Pd-H miscibility gap in Ni/Pd composite fine particles. J. Appl. Phys. 79, 5126–5128 (1996). [Google Scholar]
- Arrott A. Criterion for ferromagnetism from observations of magnetic isotherms. Phys. Rev. 108, 1394–1396 (1957). [Google Scholar]
- Koyama T. et al. Dependence of Curie temperature on Pt layer thickness in Co/Pt system. Appl. Phys. Lett. 106, 132409 (2015). [Google Scholar]
- Arrott A. & Noakes J. E. Approximate equation of state for nickel near its critical temperature. Phys. Rev. Lett. 19, 786–789 (1967). [Google Scholar]


