Abstract
Aerosols impact clear-sky surface irradiance ( ) through the effects of scattering and absorption. Linear or nonlinear relationships between aerosol optical depth (τa) and
  have been established to describe the aerosol direct radiative effect on
  (ADRE). However, considerable uncertainties remain associated with ADRE due to the incorrect estimation of
  (τa in the absence of aerosols). Based on data from the Aerosol Robotic Network, the effects of τa, water vapor content (w) and the cosine of the solar zenith angle (μ) on
  are thoroughly considered, leading to an effective parameterization of
  as a nonlinear function of these three quantities. The parameterization is proven able to estimate
  with a mean bias error of 0.32 W m−2, which is one order of magnitude smaller than that derived using earlier linear or nonlinear functions. Applications of this new parameterization to estimate τa from
  , or vice versa, show that the root-mean-square errors were 0.08 and 10.0 Wm−2, respectively. Therefore, this study establishes a straightforward method to derive
  from τa or estimate τa from
  measurements if water vapor measurements are available.
Surface irradiance, the downwelling solar radiation from the Sun and sky that reaches the surface ( ), is the ultimate energy source for the Earth’s climate system and life on the planet. A large number of diverse surface processes are governed by the amount of
  ; for example, evaporation, snow/glacier melt and plant photosynthesis. Therefore,
  plays an important role in studies of hydrological and carbon cycling1,2,3. Aerosols scatter and absorb solar radiation and thereby modulate the amount of clear-sky
  (
( hereafter). We define the aerosol direct radiative effect on
  (ADRE) as the attenuation of clear-sky
  due to aerosol scattering and absorption, i.e., the difference between
  and
and  (
( in the absence of aerosols). ADRE is widely reported in the literature, based on a combination of measurements of
  and aerosol optical depth (τa)4,5,6,7.
  cannot be obtained straightforwardly from observations since the atmosphere almost has aerosols present. One of the difficulties relating to the derivation of ADRE stems from the need to accurately estimate
  7,8. Radiative transfer model or single-layer clear-sky solar radiation model can be used to calculate
  9,10,11,12 and thereby ADRE is obtained, however, this method is sensitive to the calibration uncertainties of pyranometer (independent of model calculation) and dependent on model assumptions about the atmospheric parameters13.
  can be estimated from observations, this method avoids dependence on a model, furthermore, ADRE estimation should not be very sensitive to the calibration errors since
  is derived from observations13. A linear relationship of
  to τa has been popularly assumed and
  is then derived by linear regression analysis of
  and τa4,5,13. Some studies suggested that an exponential decay of
  with an increase in τa would be expected according to Beer–Lambert Law, which is especially true for cases with τa values larger than 0.57,8,13. However, contrary to expectation, a better estimation of
  was derived from the linear regression than using the exponential relationship. This was thought to be because the systematic underestimation of
  by the linear regression was compensated by the positive correlation between τa and water vapor content (w)8.
In this study, we show that these previous methods produce a systematic bias in the derivation of  and thereby result in an overestimation of ADRE. A new parameterization of
  is developed based on global Aerosol Robotic Network (AERONET) data, in which the relationships of
  to the cosine of the solar zenith angle (μ), τa and w have been established by using a combination of nonlinear equations. The results show that the mean bias error (MBE) of the estimations of
  decreases from 4–7 W m−2 to 0.32 W m−2. The same improvement in the estimation of ADRE would be expected when using the new method. Furthermore, one of the important advantages of this parameterization is that a straightforward method to derive τa from
  , or vice versa, has been established. Specifically, we find it is possible to derive τa from
  with a root-mean-square error (RMSE) of 0.08, and vice versa with an RMSE of 10.0 W m−2.
Results
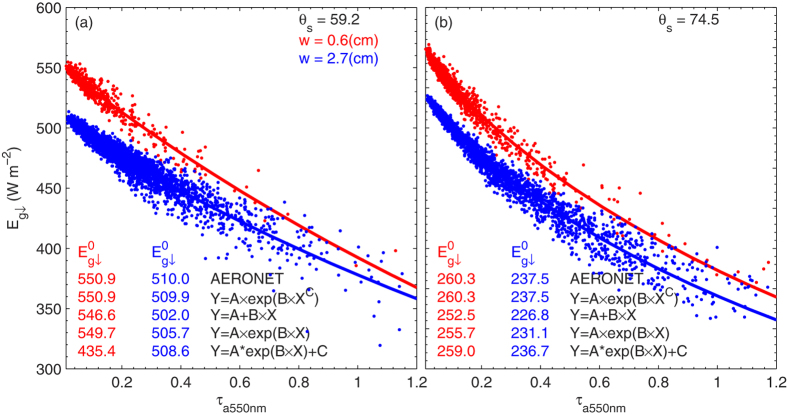
The solid dots in Fig. 1 represent the scatter between τa at 550 nm (τa hereafter) and  at two narrow μ and w ranges. The analysis is firstly performed on data points with a very narrow range of μ (~0.2°) and w (10%w), to isolate the effect of τa on
  . The mean
  amounts, using the AERONET calculation and fitting
  values using regression analysis on the basis of Eqs (1)–(4) in the Method section, are also presented. The performance of these equations is evaluated by the agreement in instantaneous
  between the AERONET calculations and the regression analysis results. We can see that the best performance is achieved using Eq. (4), the new parameterization proposed in this study, which produces a difference in
  between the mean AERONET calculation and the regression analysis result (
 ) of nearly zero. This nearly zero
  is in fact always derived using Eq. (4) for the full μ and w ranges (not shown). In contrast,
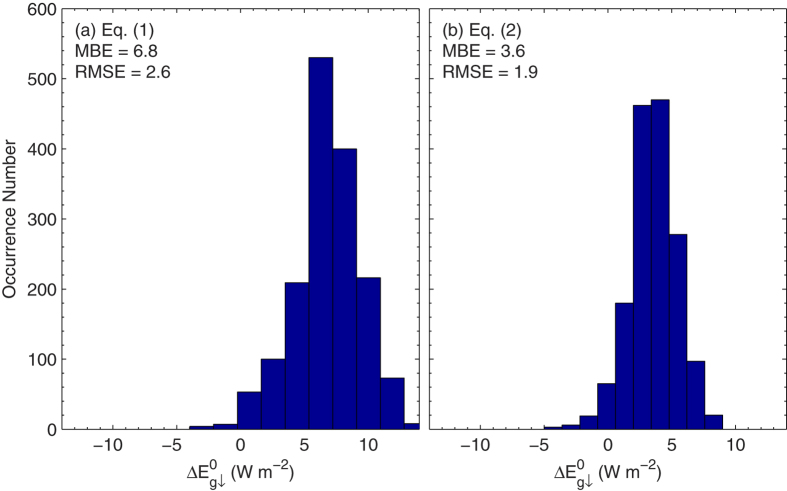
  , when using Eqs (1)) and (3), varies from a few to tens of W m−2 in these two cases. The fact that Eq. (3) occasionally produces unrealistic results that indicate the poor performance of the nonlinear regression analysis8, we eliminate it hereafter. Poorer performance of Eqs (1) and (2) than Eq. (4) is further shown by the histogram of
  for Eqs (1) and (2) given in Fig. 2. Both equations nearly always underestimate
  . The mean bias error (MBE) and RMSE of
  estimations are 6.8 (2.6) W m−2 for Eq. (1) and 3.6 (1.9) W m−2 for Eq. (2). The fact that Eq. (1) produces a considerably poorer result than Eq. (2) clearly shows the superiority of using nonlinear regression to extrapolate
  to zero τa rather than linear regression. This conclusion is also supported by the fact that smaller residuals of the regression analysis are derived from Eq. (2) than from Eq. (1). This is expected because attenuation of
  by aerosols shows nonlinear decay, as implied by Beer–Lambert Law.
Figure 1. Scatter-plot of aerosol optical depth (τa) and surface irradiance ( ) for a solar zenith angle of (a) 59.2° and (b) 74.5°, and water vapor of 0.6 cm (red) and 2.7 cm (blue).
These x-marks represent the Aerosol Robotic Network model calculation of surface irradiance in the absence of aerosols ( ). The values given in the first line represent the mean
  by the Aerosol Robotic Network model calculation, and the following values are
  derived on the basis of Eqs (1)–(4). The figure was produced using MATLAB.
Figure 2. Histogram of the difference in surface irradiance in the absence of aerosols between the Aerosol Robotic Network model calculations and regression results using Eqs (1) and (2)  .
.
The given values are the mean bias and root-mean-square error of Eqs (1) and (2). The figure was produced using MATLAB.
The difference between Eq. (2) and Eq. (4) is the introduction of a new parameter, C, into Eq. (4). The value of C is nearly always lower than 1.0 (the exact value of Eq. (3)), which is one of the most important reasons for the better performance of Eq. (4). Eq. (3) is somewhat similar to Beer–Lambert Law, which depicts the attenuation of solar direct radiation by aerosols; however, some part of the attenuation of solar direct radiation is backscattered to the surface, which is certain to enhance  . It is therefore expected that C should be lower than 1.0. In addition, the effect of aerosols on
  should not be independent from μ, since μ governs the transfer path of photons. This implies that C should vary with μ, which is reflected in the following analysis.
Figure 3 presents the dependence of  (A in Eq. (4)), on w and μ. Variation of
  is mainly governed by μ, which is somewhat modulated by w at the same value of μ. Therefore, parameter A for a given amount of w is firstly simulated using a power law function of μ (Eq. (5) in the Methods section). The first and most important reason for the selection of a power law function is because it models the simple physics of the situation with only two parameters14,15. Parameter a1 of Eq. (5) represents expected measurements of
  for a μ of 1. Parameter a2 governs the
  variation with μ. The second reason for selection of a power law function is that it provides a faithful approximation to the data.
Figure 3. Scatter-plot of the cosine of the solar zenith angle (μ) and surface irradiance in the absence of aerosols ( ).
).
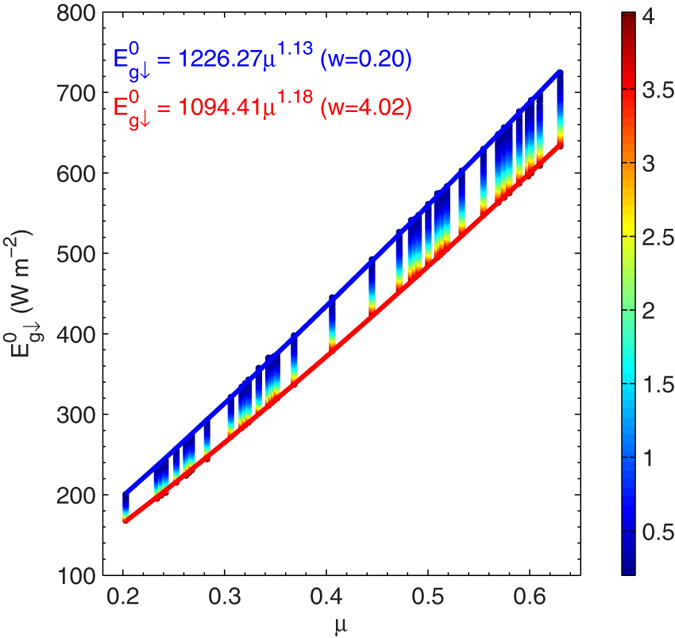
The color bar represents the water vapor content (cm). The curve represents the regression result for a specified water vapor content of 0.20 cm (blue) and 4.02 (red). The figure was produced using MATLAB.
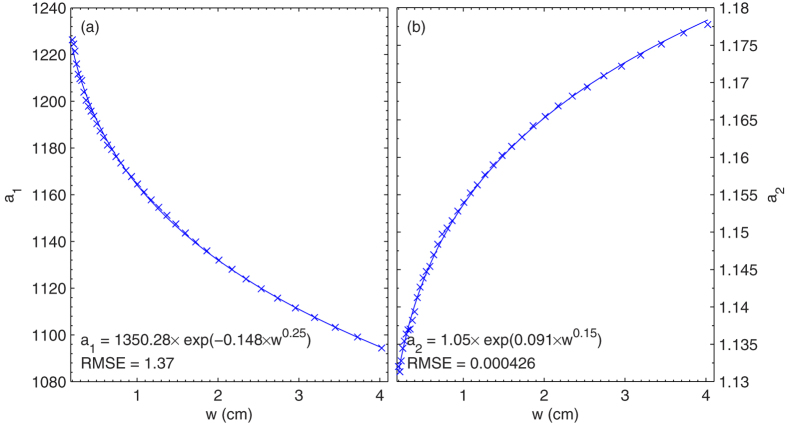
Since the dependence of  on μ is depicted by parameters a1 and a2 of Eq. (5), the w effect on
  is further simulated through the parameterization of a1 and a2 as a function of w. Figure 4 shows the relationships of a1 and a2 to w. We can see that the effect of water vapor per one unit of w on
  decreases as w increases, which is expected since the relative increase in water vapor absorption gradually decreases as w increases16. These relationships are simulated using an exponential equation. The RMSEs of the regression analysis for a1 and a2 of Eq. (5) are 1.37 and 0.0004, respectively, indicating a faithful approximation. A parameterization of
  to μ and w can then be established through a combination of Eqs (5)–(7), , that leads to Eq. (8). Therefore, it is straightforward to calculate
  from Eq. (8) if w is available, since μ can be calculated from location and time very accurately.
Figure 4. Scatter-plot of water vapor content and parameters (a) a1 and (b) a2 ofEq. 5.
The curve represents the regression result using Eqs (6) and (7). The figure was produced using MATLAB.
Further analysis of parameters B and C of Eq. (4) shows that both parameters are moderately related to μ and w, which thereby leads to a parameterization of  as a function of τa, μ and w. As shown in Fig. 5, parameters B and C are approximated well using Eqs (9) and (10). In terms of the variability of both parameters, 99.8% is explained by the regression analysis. Since the relationship between instantaneous
  to τa as well as w for a specified value of μ is established, therefore, a straightforward method is developed that can be used to derive
  if τa and w are available from another source, such as satellite remote sensing. On the other hand, it can also be used to derive τa if
  and w are available from sources such as the Baseline Surface Radiation Network (BSRN). The proposed method is evaluated by using the 20% of validating data and BSRN data at Xianghe.
Figure 5. Density plot of parameters (a) B and (b) C of Eq. 4 and their parameterization results using Eqs (9) and (10).
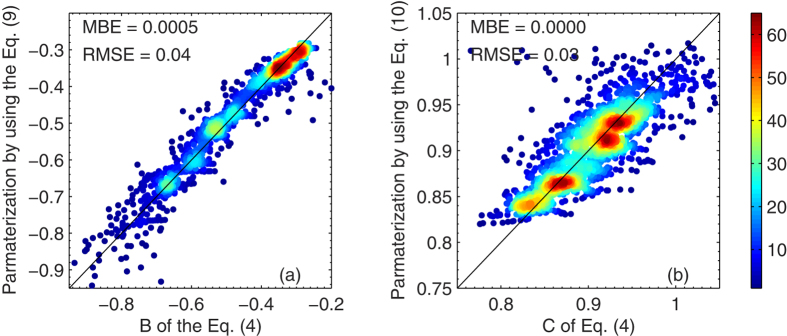
The color scale represents the relative density of points, where orange to red colors (levels ~45-60) indicate the highest number density. The mean bias error and root-mean-square error of the parameterization are also included. The figure was produced using MATLAB.
Figure 6a shows the comparison of instantaneous AERONET  values of validating data and calculations from Eq. (8) based on validating AERONET τa and w. The MBE is 0.33 W m−2, one order magnitude smaller than the results from Eq. (1) and (2), even though the latter is derived from the training data. Since
  is simulated well by Eq. (5), the ADRE derivation based on Eq. (5) should be very close to that derived from the AERONET model calculations. This expectation is supported by Fig. 6b, in which the AERONET ADREs are compared with estimations from Eq. (8). The MBE and RMSE values are −0.32 and 2.52 W m−2, respectively.
Figure 6. Density plot of AERONET (a)  and (b) ADRE and their parameterization results using Eqs (8).
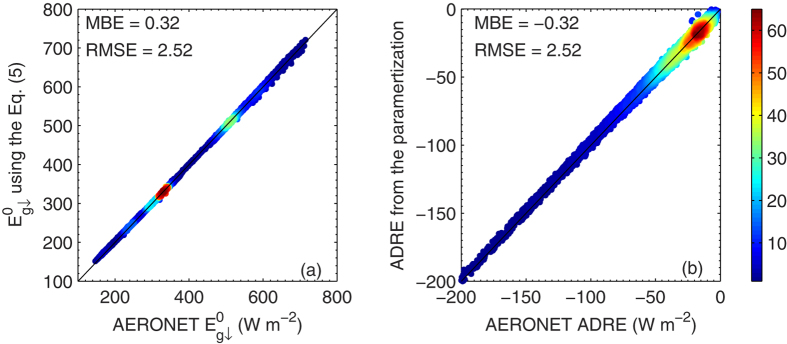
The color scale represents the relative density of points, where orange to red colors (levels ~ 45-60) indicate the highest number density. The mean bias error and root-mean-square error of the parameterization are also included. The figure was produced using MATLAB.
To test the effectiveness of the parameterization of  , the instantaneous AERONET τa and w values from the testing data points are substituted into Eqs (8)–(10), , to estimate
  values that are then compared with the AERONET
  products. Similarly, τa values are estimated from AERONET
  and w values and compared with AERONET τa products. Figure 7a shows that
  can be estimated with an MBE and RMSE of 0.02 and 10.0 W m−2, respectively. This certainly relies on the fact that both τa and w are available. On the contrary, if w and
  are available and τa is not known, τa can be retrieved from
  and w using this parameterization. The MBE and RMSE values of τa retrievals are 0.0005 and 0.08, respectively (Fig. 7b).
Figure 7. Density plot of AERONET (a)  and (b) τa and their parameterization results using Eqs (8-10).
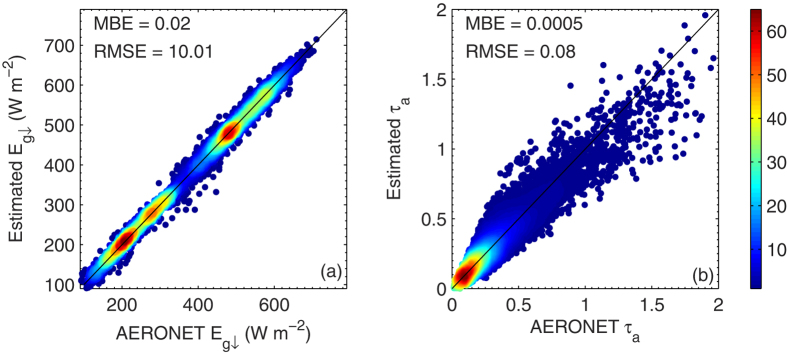
. The color scale represents the relative density of points, where orange to red colors (levels ~ 45-60) indicate the highest number density. The mean bias error and root-mean-square error of the parameterization are also included. The figure was produced using MATLAB.
Measurements of  and τa at Xianghe7, a BSRN and AERONET station in China are used to further evaluate the effectiveness of the parameterization of
  . The results are shown in Fig. 8. The estimations of
  from AERONET τa and w products using the proposed parameterization method agree with the BSRN measurements very well, with an MBE and RMSE of −3.9 and 12.5 W m−2, respectively. On the other hand, the retrievals of τa from the measurements of
  and w are compared with AERONET τa products and the MBE and RMSE values are −0.03 and 0.08, respectively. These results once again proved the reliability of the proposed parameterization method.
Figure 8. Similar as Fig. 7 but for the results from AERONET and BSRN data at Xianghe.
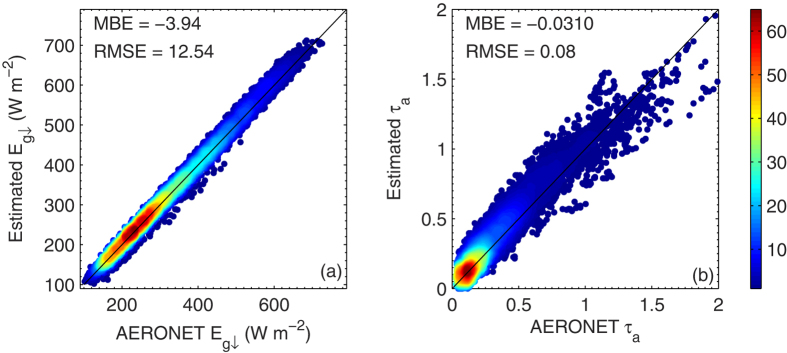
The figure was produced using MATLAB.
Uncertainty analysis
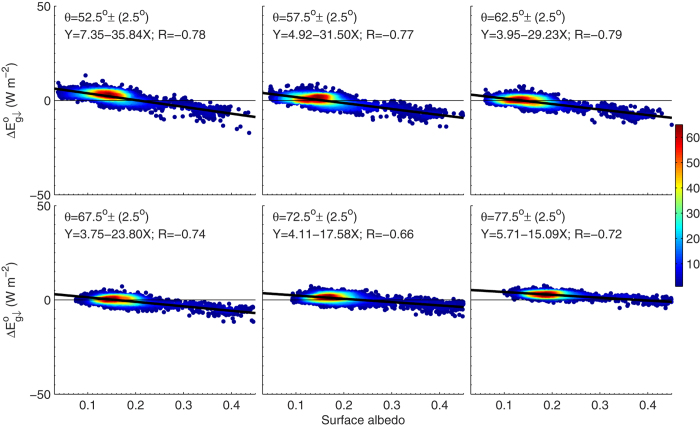
In the parameterization of  (Eq. 8 of the Method section), surface albedo effect was excluded that likely produced bias in the estimation of
  . Figure 9 shows the scatter-plot of surface albedo and
  , from which we can see a significant negative correlation between both quantities. Uncertainty of 0.1 in surface albedo may produce 1–3 W m−2 bias in
  .
.
Figure 9. Scatter-plot of shortwave surface albedo to the difference in  between AERONET product and estimation using the proposed method for six solar zenith angle ranges.
The figure was produced using MATLAB.
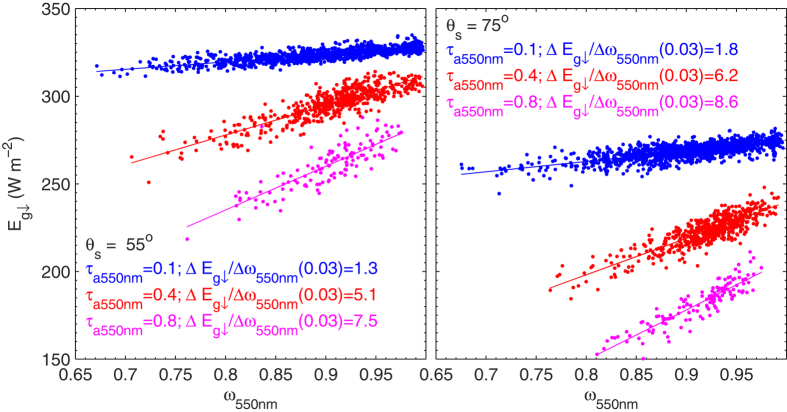
τa is the dominant aerosol optical property driving the variation of  and therefore ADRE. However, aerosol absorption also plays an important role in ADRE17, which shows a wide range of variations and thereby may lead to uncertainties in the parameterization of
  , since it was not accounted for. Remarkable impact of aerosol single scattering albedo at 550 nm (ω550nm) on the estimation of
  is presented in Fig. 10.
  changes as a result of uncertainty of ω550nm (0.03) was estimated to be a few Wm−2 that depends on optical path and τa. Significant impacts of ω550nm on estimation of
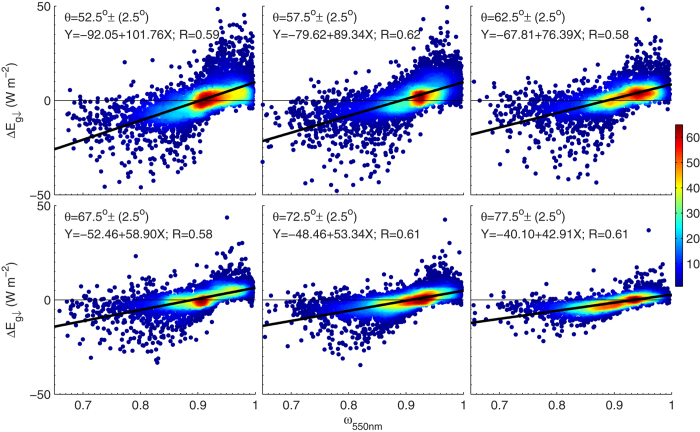
  from τa are further evidenced in Fig. 11 in which
  shows a significant correlation to ω550nm. The best estimation is achieved for ω550nm of ~0.90 that is close to the median value of ω550nm of AERONET data points.
Figure 10. Scatter-plot of ω550nm to  for three τa values and two solar zenith angles.
The figure was produced using MATLAB.
Figure 11. Scatter-plot of ω550nm to the difference in  between AERONET product and estimation using the proposed method for six solar zenith angle ranges.
The figure was produced using MATLAB.
In the above error analysis of  , water vapor is assumed to be known without any uncertainty. This is, of course, not realistic, since water vapor products from AERONET, satellite measurements are not free of uncertainty. By differentiating Eq. (8) with respect to w, the uncertainty of
  is estimated to be <3 W m−2 that is slightly dependent on optical path if the uncertainty of w is assumed to be <10% of w. The uncertainty of
  estimation was estimated to <2 W m−2 if AERONET τa products with uncertainty of 0.01 ~ 0.02 are used. However, this may reach 10 W m−2 if satellite τa products are used since their uncertainty was estimate to be 20% of τa over land18. The uncertainly of BSRN
  measurements is estimate to be 2%19, which may lead to the uncertainty of τa < 0.02.
Discussion
 is one of the key parameters governing a large number of diverse surface processes, and therefore accurate measurement or estimation of
  is significant1,2,3. Surface
  networks are still limited in spatial coverage; therefore, satellite remote sensing is a promising method for the accurate estimation of clear sky
  . Some highly complex algorithms have been developed to estimate
  from satellite remote sensing data20. Given that τa values have been inverted from a few spaceborne radiometers since 2000 with good quality (e.g. the Moderate Resolution Imaging Spectraradiometer18), establishment of the parameterizations in this study provide a straightforward method to calculate clear sky
  from such satellite aerosol products.
Broadband pyranometer measurements have been used to retrieve τa, which is e expected to be a promising method to build a long-term dataset of aerosol loading, since early pyranometer measurements can be tracked to the beginning of the last century1. Broadband direct solar radiation is widely used in these previous studies21,22,23. The method proposed in this study is based on global solar radiation measurements that are available more often than direct solar radiation. For example, there are only dozens of stations with direct solar radiation measurements; however, global solar radiation is measured at more than 100 stations in China. Certainly, it should be noted that measurement of global solar radiation is impacted by contamination of the upward facing glass dome, leveling of the instrument and cosine response of the pyranometer. The disadvantage of using direct solar radiation measurements is that it is occasionally disturbed by solar tracker malfunctions. Furthermore, both methods are impacted by calibration uncertainties.
The reason for only considering τa in the proposed method is that the availability of aerosol absorption is very limited, especially from satellite remote sensing. Similar analysis can be performed for a specified area characterized by a special aerosol type, e.g. dust aerosol in desert regions or biomass-burning aerosol in tropical forest regions. In this case, better performance of the parameterization is expected since aerosol absorption shows much less variation for the same aerosol type24. Furthermore, lower variation of surface albedo, ozone amount and surface elevation is also expected to reduce the random error of the parameterization.
Conclusion
Solar zenith angle, aerosol and water vapor are the three most important physical quantities governing the variability of  . Based on a large quantity of AERONET τa, w, and
  products, the effects of these quantities on
  are fully considered, leading to an effective parameterization of
  as a nonlinear function of these three quantities. The first advantage is that an accurate estimation of
  is achieved, which ultimately results in a significant improvement of ADRE estimation compared to previous methods. The second is that a straightforward method has been established to estimate
  from τa, or vice versa, if w is available. It is expected that potential applications of this new parameterization in the estimation of
  and τa will arise in the near future.
Methods
I used  ,
,  , τa and w products from those Aerosol Robotic Network (AERONET) sites with an elevation of less than 0.8 km (to eliminate the Rayleigh scattering effect on the analysis) (http://aeronet.gsfc.nasa.gov). The AERONET is a federation of ground-based remote sensing aerosol networks that is composed of more than 700 stations across the world (see Supplementary Fig. S1)25. The AERONET products were used because they cover different aerosol types (0 < τa < 3.0; 0.65 < ω550nm < 1.0; −0.2 < α440_870nm < 2.5, see Supplementary Fig. S2) and thereby realistically represent the aerosol direct effect on
  . Furthermore, the availability of
  data provides a benchmark for the evaluation of the parameterizations. Uncertainty of τa was estimated to be 0.01–0.0226.
  and
and  were calculated using the discrete ordinates radiative transfer model with and without aerosols27. The
  values agree with pyranometer measurements, with the relative difference varying from 0.98 to 1.0228,29. Of the 950,000 AERONET data points with surface albedo at 440 nm less than 0.25 (to reduce surface albedo effect on the analysis), I randomly select 80% of data points to develop the parameterization and the remaining 20% were used as test data. The analysis flow chart was presented in Supplementary (Fig. S3) that was described as follows.
To isolate the dependence of  on τa, the AERONET data were firstly divided into subgroups according to θs and w. The range of θs was 0.2°. The range of w was 10% of w (the measurement uncertainty25), respectively. The amount of
  was normalized for the average Earth–Sun distance and cosine correction of
  was performed within ranges to its midpoints. Three equations used in the literature were considered to represent the dependence of
  on τa:
 |
 |
 |
These equations were compared with the following new equation proposed in this paper:
 |
The performance of these methods was evaluated using the  difference between the mean AERONET model calculations and the regression analysis result (
 ). Given that Eq. (3) occasionally produces unrealistic results, we eliminated it in the comparison.
To derive  for varying μ and w,
  was further parameterized as follows:
 |
where a1 and a2 was found to relate to w as follows:
 |
 |
Therefore, the parameterization of  was finally developed through a combination of Eqs (5), (6) and (7).
 |
It was found that parameters B and C of Eq. (4) show moderate variation with μ and w, which was then simulated by the following equations:
 |
 |
The parameterization of  to μ, w and τa was finally established. This parameterization can be used to estimate
  by using a combination of Eq. 4 and 8–10 if τa and w are available, and conversely, τa can be directly calculated from
  and w. μ can be accurately calculated from location and time.
Additional Information
How to cite this article: Xia, X. Parameterization of clear-sky surface irradiance and its implications for estimation of aerosol direct radiative effect and aerosol optical depth. Sci. Rep. 5, 14376; doi: 10.1038/srep14376 (2015).
Supplementary Material
Acknowledgments
This research was funded by the Strategic Priority Research Program of the Chinese Academy of Sciences (XDA05100301) and the National Natural Science Foundation of China (41175031). AERONET PIs for the establishment and maintenance of AERONET stations are greatly appreciated.
Footnotes
Author Contributions “X.A. wrote the main manuscript text and reviewed the manuscript”.
References
- Wild M. Global dimming and brightening: A review. J. Geophys. Res. 114, D00D16, 10.1029/2008JD011470 (2009). [DOI] [Google Scholar]
- Mercado L. M. et al. Impact of changes in diffuse radiation on the global land carbon sink. Nature 458, 1014–U1087, 10.1038/nature07949 (2009). [DOI] [PubMed] [Google Scholar]
- Wang K. C. & Dickinson R. E. Contribution of solar radiation to decadal temperature variability over land. Proc Natl Acad Sci USA 110, 14877–14882, 10.1073/pnas.1311433110 (2013). [DOI] [PMC free article] [PubMed] [Google Scholar]
- Satheesh S. K. & Ramanathan V. Large differences in tropical aerosol forcing at the top of the atmosphere and Earth’s surface. Nature 405, 60–63, 10.1038/35011039 (2000). [DOI] [PubMed] [Google Scholar]
- Conant W. C. et al. A model for the radiative forcing during ACE-Asia derived from CIRPAS Twin Otter and R/V Ronald H. Brown data and comparison with observations. J. Geophys. Res. 108, 8661, 10.1029/2002JD003260 (2003). [DOI] [Google Scholar]
- Dumka U. C. et al. Surface changes in solar irradiance due to aerosols over central Himalayas. Geophys. Res. Lett. 33, L20809, 10.1029/2006GL027814 (2006). [DOI] [Google Scholar]
- Xia X. A., Li Z. Q., Chen H. B. & Cribb M. Estimation of aerosol effects on surface irradiance based on measurements and radiative transfer model simulations in northern China. J. Geophys. Res. 112, D22S10, 10.1029/2006JD008337 (2007). [DOI] [Google Scholar]
- Huttunen J. et al. Effect of water vapor on the determination of aerosol direct radiative effect based on the AERONET fluxes. Atmos. Chem. Phys. 14, 6103–6110 (2014). [Google Scholar]
- Gueymard C. Clear-sky irradiance predictions for solar resource mapping and large-scale applications: Improved validation methodology and detailed performance analysis of 18 broadband radiative models. Sol. Energy 86, 2145–2169 (2012). [Google Scholar]
- Badescu V. et al. Computing global and diffuse solar hourly irradiation on clear sky. Review and testing of 54 models. Renew. Sust. Energy Rev. 16, 1636–1656 (2012). [Google Scholar]
- Reno M. J., Hansen C. W. & Stein J. S. Global Horizontal Irradiance Clear Sky Models: Implementation and Analysis, Sandia Nationa Lboratories. Tech Report SAND 2012–2389 (2012). [Google Scholar]
- Gueymard C. A. & Ruiz-Arias J. A. Validation of direct normal irradiance predictions under arid conditions: A review of radiative models and their turbidity-dependent performance. Renew. Sust. Energy Rev. 45, 379–396 (2015). [Google Scholar]
- Conant W. An observational approach for determining aerosol surface radiative forcing: results from the first field phase of INDOEX. J. Geophys. Res. 105, 15347–15360 (2000). [Google Scholar]
- Allen R. J., Norris J. R. & Wild M. Evaluation of multidecadal variability in CMIP5 surface solar radiation and inferred underestimation of aerosol direct effects over Europe, China, Japan and India. J. Geophy. Res. 118, 6311–6336, 10.1002/jgrd.50426 (2013). [DOI] [Google Scholar]
- Long C. N. & Ackerman T. P. Identification of clear skies from broadband pyranometer measurements and calculation of downwelling shortwave cloud effects. J. Geophys. Res. 105, 15609–15626 (2000). [Google Scholar]
- Iqbal M. An introduction to solar radiation. Elsevier (2012). [Google Scholar]
- Xia X. A critical assessment of direct radiative effects of different aerosol types on surface global radiation and its components. J. Quant. Spec. Rad. Tran. 149, 72–80 (2014). [Google Scholar]
- Levy R. et al. Global evaluation of the Collection 5 MODIS dark-target aerosol products over land. Atmos. Chem. Phys. 10, 10399–10420 (2010). [Google Scholar]
- Ohmura A. et al. Baseline surface radiation network (BSRN/WCRP): new precision radiometry for climate research. Bull. Amer. Meteo. Soc. 79, 2115–2136 (1998). [Google Scholar]
- Hinkelman L. M., Stackhouse P. W., Wielicki B. A., Zhang T. P. & Wilson S. R. Surface insolation trends from satellite and ground measurements: comparisons and challenges. J. Geophys. Res. 114, D00D20, 10.1029/2008JD011004 (2009). [DOI] [Google Scholar]
- Qiu J. Q. A method to determine atmospheric aerosol optical depth using total direct solar radiation. J. Atmos. Sci. 55, 744–757 (1998). [Google Scholar]
- Diermendjian D. A survey of light-scattering techniques used in the remote monitoring of atmospheric aerosol. Rev. Geophys. Space Phys. 18, 341–360 (1980). [Google Scholar]
- Gueymard C. & Garrison J. Critical evaluation of precipitable water and atmospheric turbidity in Canada using measured hourly solar irradiance. Sol. Energy 62, 291–307 (1998). [Google Scholar]
- Eck T. et al. Climatological aspects of the optical properties of fine/coarse mode aerosol mixtures. J. Geophys. Res. 115, D19205, 10.1029/2010JD014002 (2010). [DOI] [Google Scholar]
- Holben B. N. et al. AERONET—a Federated Instrument Network and Data Archive for aerosol characterization. Remote Sens. Environ. 66, 1–16 (1998). [Google Scholar]
- Eck T. F. et al. Wavelength dependence of the optical depth of biomass burning, urban, and desert dust aerosols. J. Geophys. Res. 104, 31333–31349, 10.1029/1999JD900923 (1999). [DOI] [Google Scholar]
- Dubovik O. & King M. D. A flexible inversion algorithm for retrieval of aerosol optical properties from Sun and sky radiance measurements. J. Geophys. Res. 105, 20673–20696, 10.1029/2000JD900282 (2000). [DOI] [Google Scholar]
- García O. E. et al. Validation of AERONET estimates of atmospheric solar surface fluxes and aerosol radiative forcing by ground-based broadband measurements. J. Geophys. Res. 113, D21207, 10.1029/2008JD010211 (2008). [DOI] [Google Scholar]
- Li Z., Lee K., Wang Y., Xin J. & Hao W. First observation—based estimates of cloud-free aerosol radiative forcing across China. J. Geophys. Res. 115, D00K18, 10.1029/2009JD013306 (2010). [DOI] [Google Scholar]
Associated Data
This section collects any data citations, data availability statements, or supplementary materials included in this article.


