Abstract
Protein-protein interaction (PPI) networks serve as a powerful tool for unraveling protein functions, disease-gene and disease-disease associations. However, a direct strategy for integrating protein interaction, protein function and diseases is still absent. Moreover, the interrelated relationships among these three levels are poorly understood. Here we present a novel systematic method to integrate protein interaction, function, and disease networks. We first identified topological modules in human protein interaction data using the network topological algorithm (NeTA) we previously developed. The resulting modules were then associated with functional terms using Gene Ontology to obtain functional modules. Finally, disease modules were constructed by associating the modules with OMIM and GWAS. We found that most topological modules have cohesive structure, significant pathway annotations and good modularity. Most functional modules (70.6%) fully cover corresponding topological modules, and most disease modules (88.5%) are fully covered by the corresponding functional modules. Furthermore, we identified several protein modules of interest that we describe in detail, which demonstrate the power of our integrative approach. This approach allows us to link genes, and pathways with their corresponding disorders, which may ultimately help us to improve the prevention, diagnosis and treatment of disease.
Network methods are powerful tools for unraveling protein functions, protein-pathway associations, disease-gene and disease-disease associations. However, these disparate types of networks are more often studied independently of each other. To date, there has been great progress in the study of protein interaction networks. Previous research on protein networks1,2,3,4,5,6,7,8,9 mainly focused on analyzing the associations between genes, functional modules, and pathways. Using these approaches, usually only a fraction of detected protein modules have good mapping to biological functions or pathway annotations. Similarly, previous studies of disease networks10,11,12,13,14,15,16,17,18,19,20,21,22,23,24 mainly focused on disease classification and the prediction of disease genes. Recently, several groups have studied human disease networks25,26, to shed light on the relationship between disease genes and disease networks, as well as disease gene modules and their functional analysis. These methods start from diseasome27, which is a bipartite gene-disease network, from which we can derive two different disease networks: disease-disease networks and disease gene networks. Disease networks may help us to understand phenotype associations between proteins and diseases. Thus, a direct strategy for integrating protein interactions, protein function and disease patterns is still absent, and the interrelated relationships among these three levels have been poorly investigated.
To better understand the relationships between these three network types, we present a multi-network systematic analysis method. Using our approach, protein modules are determined directly from topological modules using the network topological algorithm we previously developed (NeTA28). Traditionally, a protein module is defined as a group of proteins that carry out similar functions. These functions are associated with the same pathway, and could be associated with a particular disease. Here we focus on three distinct protein modules: topological, functional and disease modules25,26. Topological modules represent a locally dense structure in protein-protein interaction (PPI) networks; function modules represent the aggregation of proteins of related function in a function network; disease modules represents a group of proteins that share a common disease phenotype within a disease network. Though the three types of modules are derived from three different types of networks, they can be closely interrelated and highly overlapping25.
Starting with the protein interaction dataset from Hippie29, we identified 136 topological modules with NeTA, 136 corresponding functional modules (annotated using Gene Ontology30), and 139 disease modules annotated using OMIM31 and GWAS32. To our surprise, most functional modules (70.6%) are highly consistent with the corresponding topological modules, and most disease modules (88.5%) are fully covered by the corresponding functional modules, and have significant pathway annotations. By systematically integrating the three levels of networks and protein modules, we found that our multi-level method for biological interpretation has distinct advantages over approaches that only consider subsets of data and annotations. Many interesting modules are found that could not be easily discovered by only one data type. For example, we identified several protein interaction modules that allowed us to connect inflammatory responses to Alzheimer’s disease, suggesting that this pathology may have a strong inflammatory component. Moreover, in many modules, we found that a subset of genes is associated with specific functions or diseases, allowing us to identify genes and pathways with their corresponding disorders. The approach we present here not only provides an avenue for network integration, but also promises to shed light on the prevention, diagnosis and treatment of complex diseases.
Results
The integrated multi-networks mapping method
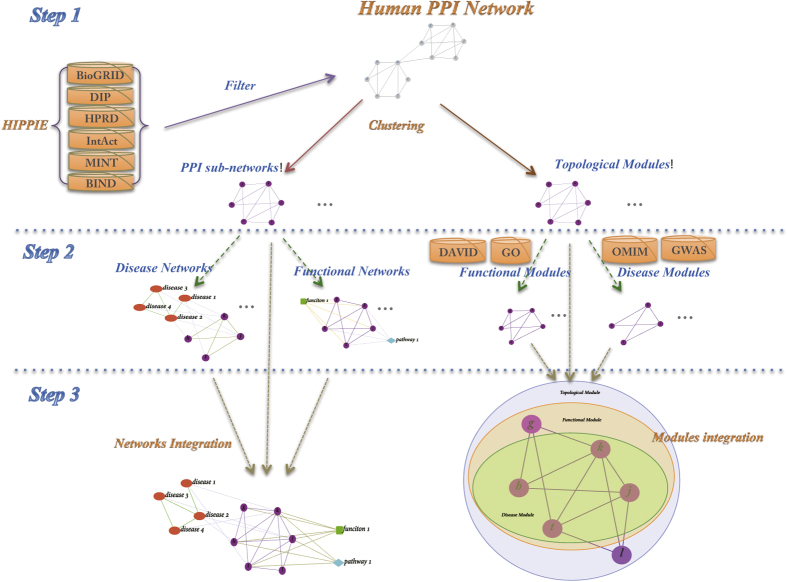
Figure 1 shows a schematic of our overall approach, the framework of the integrated multi-networks mapping method, which consisted of three steps. First we determined the topological modules from a human PPI network. Next, we annotated all topological modules using Gene Ontology (GO), to obtain functional modules. Finally, we included OMIM and GWAS data to obtain disease modules. Thus, three levels of networks were constructed and modules were identified at each level, including a protein network and its topological modules, a function network and its functional modules, and a disease network and its disease modules. Finally, we integrate the three types of networks and modules, to discover modules that have coherent function and disease interpretation, leading to new associations that are not evident when analyzing only a single type of network.
Figure 1. The schematic of multi-networks mapping method.
There are three steps in multi-networks mapping method, including clustering, mapping and integrative analysis.
Protein Networks and Topological Modules
The human PPI network was constructed based on the HIPPIE29 and IRefWeb33 databases, which results in a network of 2484 direct physical interactions among 1830 proteins. We detected 136 large modules and 185 small modules (most of which only contain two proteins) by applying the network topology algorithm NeTA28. Here we analyze the 136 larger topological modules (as shown in Supplementary Table 1). This PPI network contains 1390 proteins, and 2228 interactions (Fig. 2b), which results in 76% of the proteins being associated with 89.7% of the interactions of the PPI network. As Fig. 2a shows, the size of larger modules runs from 3 to 88. In Fig. 2b, different colors represent different modules, and we can clearly see that this network has a modular structure. The modularity Q34 is 0.91385, which means these modules have significantly more community structure than a random zero-model.
Figure 2. The constructed human PPI network.
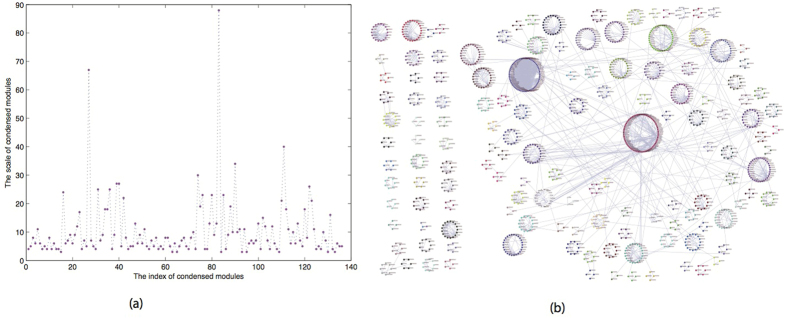
(a) The size of condensed modules of PPI run from 3 to 88. (b) The 136 detected topological modules and corresponding PPI network. Different color denotes different topological modules.
Function Networks and Functional Modules
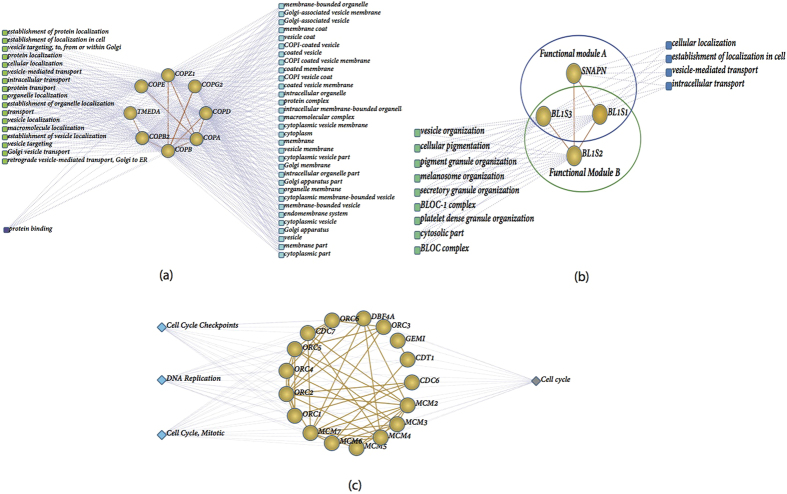
To build a function network, we mapped each topological module into Bingo35, and analyzed the GO enrichments of each module at three levels of Gene Ontology (GO) slim, using annotation from Biological Process, Cellular Component, and Molecular Function ontologies30. A functional module was defined as a group of genes in a topological module that is associated with a specific GO term. In total, we found 136 functional modules (as shown in Supplementary Table 2) with at least three proteins. If we don’t consider the unannotated proteins (there is only one protein in our network that has no annotations in Bingo), we found that 96 (70.6%) of our topological modules are fully covered by functional modules (i.e. all the proteins map to the same function term). For example, topological module 3 consists of 8 proteins, COPA, COPB, COPD, COPE, COPB2, COPZ1, COPG2, and TMEDA (Fig. 3a). All eight proteins share the same BP function “Golgi vesicle transport” (p-value is 2.4E-16), as well as the same CC function “cytoplasmic vesicle membrane” (p-value is 9.71E-15). In general, all other modules are covered by at most two function modules. An example of this is topological module 9, which has four genes: BL1S1, BL1S2, BL1S3 and SNAPN (Fig. 3b), that are associated with two functional modules: BL1S1, BL1S2, BL1S3 (“cellular pigmentation”, p-value is 4.01E-7) and BL1S1, BL1S3 and SNAPN (“vesicle-mediated transport”, p-value is 3.64E-3).
Figure 3. Function network.
(a) The protein-function network of topological module 3. (b) The protein-function network of topological module 9. Round denotes proteins, and rectangles denote functions. Green denotes BP, cyan denotes CC, and deep purple denotes MF. (c) The protein-Pathway network of topological module 23. Round denotes proteins, and diamond denotes pathway. Orange denotes KEGG pathway, and light green denotes Reactome pathway.
Furthermore, each topological module was annotated using the DAVID36,37 online analysis tool to identify pathway enrichment (see Methods), and construct protein-pathway networks. We found 88 topological modules (as shown in Supplementary Table 4) significantly associated with a pathway, and pathway genes are closely related with corresponding functional module genes. For example, as Fig. 3c shows, topological module 23 has 17 proteins, all of which are annotated as “DNA Replication pathway”(p-value is 1.09E-25), as well as “nucleoplasm” (p-value is 3.06E-20).
Disease Networks and Disease Modules
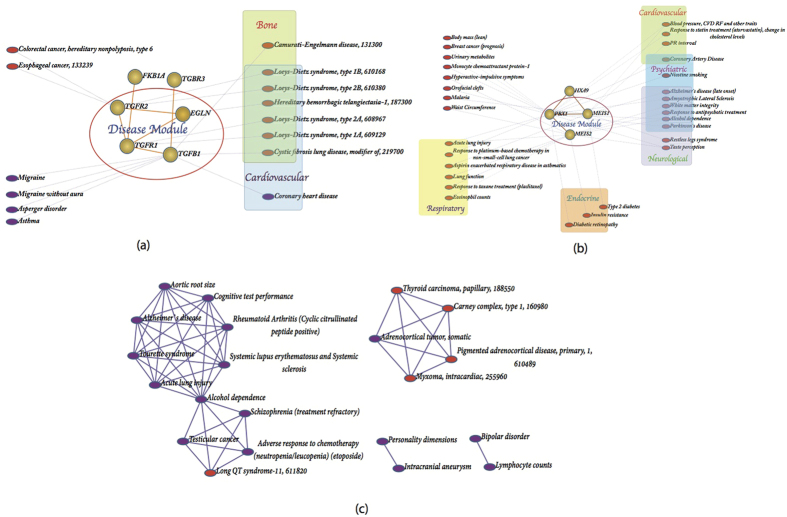
To build the relationship between proteins and diseases, we mapped each topological module to the OMIM31 and GWAS32 databases. In total, 109 topological modules have disease genes, and 139 significant disease modules (as shown in Supplementary Table 3) were identified. One topological module may corresponds to one or more than one disease module. For example, topological module 6 has six genes, of which EGLN, TGFB1, TGFR1, and TGFR2 are disease genes associated with Bone and Cardiovascular diseases, which we therefore label as a disease module (Fig. 4a). Another example, topological module 11, with 4 genes, contains MEIS1, MEIS2 and PBX1, which are disease genes associated with Cardiovascular, Neurological, Psychiatric, Endocrine and Respiratory diseases, and these were also defined as a disease module (Fig. 4b).
Figure 4. Disease network.
(a) The disease-gene network of topological module 6. (b) The disease-gene network of topological module 11. The Round denotes proteins, and ellipse denotes diseases. Red denotes OMIM diseases, and purple denotes GWAS diseases. (c) The Disease-disease network of topological module 33. Nodes denote diseases and link between two diseases denote they share at least one disease gene.
The study of associations between diseases is also potentially interesting, as it could help understand relationships between complex syndromes. We constructed a disease-disease network for each topological module. Nodes are diseases that are associated with one gene or multiple genes in the topological module, and edges between two diseases denote that they share at least one disease gene. Closely related diseases may be associated with complex syndromes. For example, Fig. 4c shows the disease-disease network of topological module 33: Thyroid carcinoma (papillary), carney complex (type 1), Adrenocortical tumor (somatic), Pigmented adrenocortical disease (primary) and Myxoma (intracardiac), which are all cancers, and besides Myxoma, are also endocrine pathologies.
Integrative Analysis
Considering protein interaction, function, and disease networks independently significantly limits our ability to carry out a systematic study of the data. As a result, we integrated protein, function and disease networks, in order to annotate protein modules according to their function and disease associations, to gain a systematic view of these relationships. In addition, to view the relationship between different types of modules, we also integrated topological modules with functional and disease modules. If a disease module is highly overlapping (over half of proteins) with a functional module, then we defined its corresponding topological module as a non-trivial protein module; if a disease module is highly overlapping (over half of proteins) with a pathway module, then we defined its corresponding topological module as a significant protein module. Using this integrative analysis, we identified 69 non-trivial protein modules, and 47 significant protein modules in our PPI network. We discuss a few examples below.
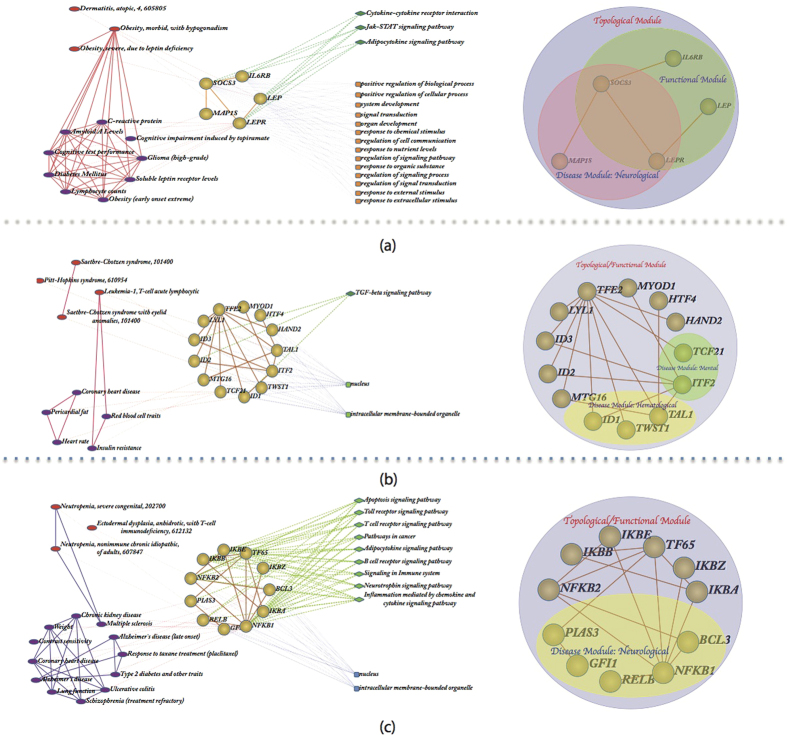
Figure 5a shows an intriguing non-trivial protein module (Topological module 55) that connects leptin and the leptin receptor to the inflammatory cytokine receptor IL6RB. There is extensive literature implicating leptin to obesity and diabetes38. However, this module shows us that these disorders are also associated with inflammation (through IL6). There is increasing recognition that many metabolic disorders, such as diabetes, are also associated with higher levels of inflammation39. Thus this module suggests that anti-inflammatory treatments could be coupled with weight loss regimes to address metabolic disorders.
Figure 5. Integrative analysis of networks and non-trivial protein modules.
(a) The integrative analysis of networks and modules of topological module 55. (b) The integrative analysis of networks and modules of topological module 82. (c) The integrative analysis of networks and modules of topological module 113. On the left is the integration of protein networks, function network and disease network, and on the right is the integration of corresponding topological module, functional module and disease module.
Figure 5b shows another non-trivial protein module (Topological module 82) with a number of factors that likely play a significant role in hematopoietic development. Specifically, Tal1 is a master regulator of T cell development, and inhibits the production of cardiac cells40. It is therefore interesting to see that several of the genes in this module are associated not only with T cell development, but also with heart disease and heart rate.
Figure 5c describes a complex of proteins associated with NfkB (Topological module 113), a master regulator of inflammatory responses. One interesting observation is that several genes in this module are associated with Alzheimer’s disease. This is of interest, as there is growing recognition that Alzheimer’s disease may be associated with inflammation, and its risk is elevated by metabolic disorders, such as diabetes41. Thus this non-trivial protein module allows us to make the critical connection between these two important disorders, and the basal inflammatory responses of cells.
Figure 6 shows a significant protein module (Topological module 24) with four genes, SYN1, SYN2, SYN3 and CAPON. Of these SYN1, SYN2, and SYN3 are all associated with psychiatric disease, and the synaptic transmission and synaptic vesicle trafficking pathway.
Figure 6. Significant protein modules.
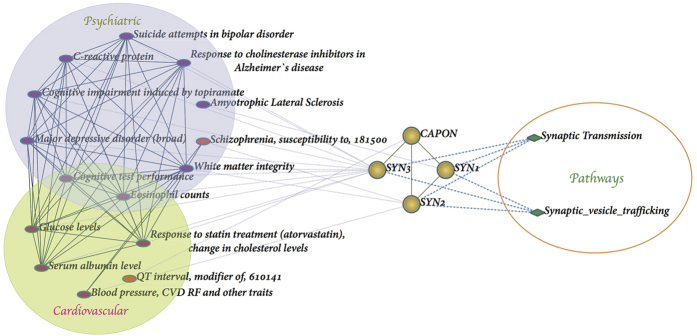
The Disease network and protein-pathway network of topological module 24. Round denotes proteins, diamond denote pathway and ellipse denotes diseases.
In addition, topological module 3 and 51 are also interesting non-trivial protein modules. All the proteins of module 3 are involved in Golgi vesicle transport, and most are also involved in the membrane trafficking pathway, and associated with Alzheimer’s disease. All the proteins of module 51 are associated with translation initiation factor activity, and in the Metabolism of proteins pathway, and most are also associated with liver disease.
Comparison with existing methods
In recent years, a number of methods have been developed to identify functional modules1,2,3,4,5,6,7,8,9 and disease modules10,11,12,13,14,15,16,17,18,19,20,21,22,23,24 in PPI networks. Most methods to identify disease modules are disease protein prioritization methods. To evaluate the relative performance of our method, we compare our results with two representative methods that can identify functional and disease modules. One is the Markov Cluster Algorithm (MCL)42, which is based on random flow (We use the default settings, inflation parameter r = 2) and the other is random walker (RW)43 that wanders from node to node along the links of the network. After every move the walker is reset to a randomly chosen seed gene with a given probability r (we use r = 0.4).
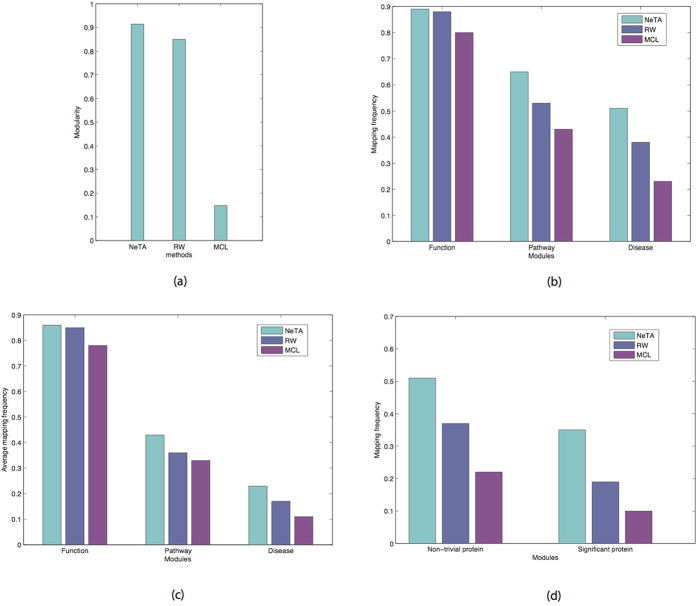
Figure 7(a) shows the modularity results from NeTA, MCL and RW, which can qualify the clustering quality of the topological modules. NeTA performs better than the other two methods. Figure 7(b) shows the mapping frequency of the three methods based on the topological modules that were identified. As expected, among the three kinds of modules, no matter what method was used, we identify more functional than disease modules. NeTA identified more functional modules than MCL and RW, and also identified more pathway and disease modules. Figure 7(c) shows the average mapping frequency of the three methods based on topological modules that were identified. Fore each method, we count each functional/disease module mapping frequency, and take the mean value, which measures the mapping accuracy of each method. We can see that the mapping accuracy of NeTA is higher than other two methods. Figure 7(d) describes the mapping frequency of non-trivial protein modules and significant protein modules. Again, NeTA finds more non-trivial and significant protein modules. Overall, we find that our method performs better than the other algorithms for all kinds of protein modules.
Figure 7. Performance evaluation of NeTA.
(a) The modularity of three representative clustering algorithms. (b) We mapped the detected topological modules to function, pathway and disease database respectively, and computed the mapping frequency for each algorithm. (c) The average mapping frequency of all detected modules are counted for the three algorithms. (d) The mapped frequency of detected non-trivial protein modules and significant protein modules.
Systematic evaluation analysis
To systematically evaluate the power of our method to infer function-disease associations, we constructed a benchmark network based on the OMIM31 and MIPS human complex database44. We filtered human complex PPI with disease genes from OMIM, and constructed a network with 1460 proteins and 4107 protein–protein interactions. In this setting, there is at least one disease gene in each interaction. We use this as a benchmark network, to identify disease, protein complex and disease-complex modules, and compare our results with the MCL and RW algorithms.
Figure 8(a) shows the resulting modularity of NeTA, MCL and RW against this network. Among them, NeTA has the highest modularity, which shows it can obtain better module structure than the other two methods. Figure 8(b) shows the number of different modules identified by the three methods. RW identified the most topological modules, and MCL identified the most complex modules, and NeTA identified the most disease modules and disease-complex modules. Figure 8(c) shows the mapping frequency of different modules identified by the three methods. Disease and protein complex modules can only map to approximately 20% of topological modules, and even fewer disease-complex modules. Overall, we find that our method performs competitively with the other algorithms.
Figure 8. Systematic evaluation of NeTA based on a benchmark network.
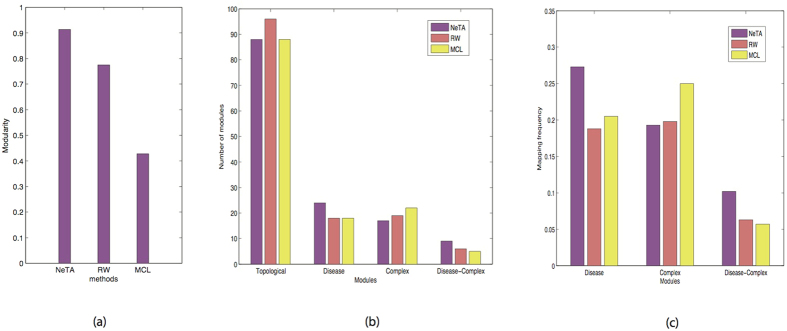
(a) The modularity of three clustering algorithms. (b) We mapped the detected topological modules to OMIM disease database and MIPS human complex database respectively, and counted the mapped number of disease modules, complex modules and disease-complex modules respectively, and compared them with the other two algorithms. (c) The mapped frequency of disease modules, complex modules and disease-complex modules respectively, in comparison with the other two algorithms.
Discussion
Protein interaction, function and disease networks can be clustered into cohesive groups. Accordingly, these cohesive groups can be defined as topological, functional and disease modules. Most previously published approaches that analyze these datasets only focus on a subset of the three levels. For example, most work on PPI networks only focus on topological modules and their corresponding functional modules1,2,3,4,5,6,7,8,9. Other approaches analyze pathway enrichment of modules. Similarly, most of the work on disease networks focuses on disease genes and their classification10,11,12,13,14,15,16,17,18,19,20,21,22,23,24. As a result, an integrative analysis of all three levels of modules and networks has yet to be performed.
Here we present a systematic method for combining protein interactions, functions and disease networks, resulting in an integrative analysis that yields topological, functional and disease modules. Other integrative approaches start from Diseasome27 to detect disease modules, and then identify functional and topological modules based on these. In contrast, we start from a human PPI network and detect 136 topological modules (as shown in Supplementary Table 1) using NeTA. We then annotate these topological modules using GO, OMIM and GWAS, and find corresponding functional and disease modules, leading to the construction of networks for each of the three levels. To visualize the associations among the three levels of modules and networks, we integrated the three levels together, and found that they generate new insights into protein network analysis. This approach allowed us to identify many interesting modules, which can’t be fully annotated only using a single type of data. For example, we identified several protein interaction modules that allowed us to connect inflammatory responses to Alzheimer’s disease, suggesting that this pathology may have a strong inflammatory component.
In topological module 3, which includes eight proteins, we found that all the proteins are involved in Golgi vesicle transport, and that COPA, COPB1, COPB2, COPD, COPE, COPG2 and COPZ1 belong to an octamer protein complex45,46,47. In addition, COPA, COPB1, COPB2, COPD, COPE and COPZ1 are involved in the membrane trafficking pathway, and COPA, COPB1, COPB2, TMED10 and COPG2 are associated with Alzheimer’s disease45,46,47. Moreover, COPD is associated with increased risk for Mild Cognitive impairment, the earliest phase of Alzheimer’s disease, and COPZ1 is involved in intracellular trafficking45,46,47. Impairment of intracellular trafficking has been implicated in the pathogenesis of Alzheimer’s disease, so COPZ1 may be associated with Alzheimer’s disease. COPE is associated with depressive disorder, which is similar to the later phase of Alzheimer’s disease, suggesting that COPE may also be associated with Alzheimer’s disease.
Topological module 5 includes 11 genes, which are all located in the membrane. DMD, DTNA, NOS1, SNTA1, MAST2 and VAC14 are Type 2 diabetes disease genes45,46,47, SCN5A is a diabetes mellitus disease gene, SNTB2 and UTRN are type 1 diabetes disease genes46,47; SNTB1 controls glucose levels, and could be a potential diabetes disease gene. MAST1 is an important paralog of MAST245, and phosphorylation of DMD or UTRN may modulate their affinities for associated proteins, and thus may also be associated with diabetes mellitus.
Topological Module 51 includes 11 genes, which are components of the eukaryotic translation initiation factor 3 (eIF-3) complex, which is required for several steps in the initiation of protein synthesis45. All these genes are related with translation initiation factor activity, and in the Metabolism of proteins pathway. In fact, the eIF-3 complex is composed of 13 subunits, and EIF3J and EIF3M are not included in this module45. The most interesting observation is that all these genes are associated with liver diseases: EIF3A, EIF3B, EIF3C, EIF3D and EIF3G are all associated with Liver Failure47, Acute Hepatitis; EIF3E, EIF3F and EIF3K are associated with Liver Neoplasms47; EIF3H is associated with Carcinoma Hepatocellular47; EIF3I is associated with clonorchiasis47. Furthermore, EIF3L has a lower level of expression in liver cancer45,46,47. Therefore, the eIF-3 complex may be associated with liver disease as well.
As these examples illustrate, our work has the potential to inform the prevention, diagnosis and treatment of disease. It is often difficult to accurately identify potential gene targets based on GWAS, even though many GWAS variants are strongly associated with diseases. Although GWAS to protein associations affect the number of disease modules we can identify, we do not expect that these uncertainties significantly change the analysis results we obtained. In conclusion, our integrative analyses are still far from providing important therapeutic breakthroughs, which require substantial follow-up investigation. Nonetheless, they provide a wealth of hypothesis that could lead to clinical improvements in the future. To make these hypotheses more robust, in subsequent work we intend to improve the method of noise reduction and data integration, split bigger modules into smaller ones, and integrate more levels of data together to improve our system level understanding of these complex diseases.
Methods
Data source
HIPPIE29 is a human PPI database, and currently contains more than 156,000 interactions of ~14,500 human proteins. It integrates multiple major expert-curated experimental PPI databases, and all interactions have an associated normalized confidence score. Here we selected six public human PPI databases: BioGrid48, DIP49, HPRD50, IntAct51, MINT52 and BIND53 as our data sources based on the HIPPIE database, and identified high-confidence interactions based on the HIPPIE scoring system. To obtain more reliable interactions, we only keep those that are found in at least two pubic databases and are classified as high-confidence interactions.
Network Construction
Protein Network
We extracted high-confidence interactions from the HIPPIE database, and took direct physical interactions that cross multiple species based on the IRefWeb33 database to construct the final human PPI network. IRefWeb is a web interface to protein interaction data consolidated from 10 public databases. It can automatically crop the PPI dataset to produce a subset of higher-quality interactions, which aids the generation of more meaningful organism-specific interaction networks. In this network a node denotes a protein, and a link represents a protein-protein interaction.
Function Network
There are two kinds of function networks: one is a Protein-function network, and the other is a protein-pathway network. Protein-function networks are obtained by connecting proteins of each topological module (defined below) with corresponding GO biological processes, cellular localizations and molecular functions. In what follows we only used the third level under of GO slim terms30. In these networks nodes are proteins or GO terms. Edges are drawn between a protein and a term when a significant association between them exists (based on a hypergeometroc test P value between the functional modules and protein module). Protein-pathway networks are constructed by connecting proteins of each topological module with corresponding pathway annotations (pathway sources see below).
Disease Network
By mapping each topological module into the OMIM and GWAS database, we constructed two types of disease networks: Disease-gene networks and disease-disease networks. Disease-gene networks connect the genes in each topological module with their associated diseases. Disease-disease networks connect pairs of diseases if they share at least one disease gene.
Protein Module Detection
Topological Modules
High aggregation is an essential characteristic of biological networks, and it reflects high modularization of gene networks. The network we use was first clustered into different sizes of topological modules before further analysis. Accurately identifying topological modules of a biological network is still challenging. Here we detected topological modules based on a network topological algorithm NeTA28 (NeTA can detect sparse and small modules, and is competitive with other methods28), and we only consider those topological modules that contain at least three proteins.
Functional Modules
To evaluate the biological significance of these topological modules, we analyzed Gene Ontology)30 enrichment of each topological module with the Bingo35 plugin in Cytoscape54 with a threshold P-value < 0.05 based on the Hypergeometric test, and corrected by the Benjamini & Hochberg False Discovery Rate (FDR). Bingo generates hierarchical functional annotations based on GO slim. To obtain coherent functional modules, we only chose functions in the third level of GO slim30. We consider a group of proteins in a single topological module as a functional module if and only if at least one function can cover all these proteins.
Disease Modules
Online Mendelian Inheritance in Man (OMIM)31 is a comprehensive, authoritative compendium of human genes and genetic phenotypes. Genome-wide association studies (GWAS32) examine common genetic variants in populations to see if they are associated with a trait. GWASdb55 is a database that combines collections of GVs from GWAS together with their functional annotations and disease classifications. MalaCards56 is an integrated searchable database of human maladies and their annotations, modeled on the architecture and richness of the popular GeneCards database of human genes. We detected disease modules based on known disease-gene associations extracted from OMIM and GWASdb and the disease classification of MalaCards online annotations. If more than two proteins have associations with the same disease type within certain topological module, then we take these proteins as a disease module. Here we classify diseases into 15 kind of phenotypes: Neurological, Ophthamological, Cardiovascular, Bone, Dermatological, Endocrine, Metabolic, Cancer, Immunological, Psychiatric, Hematological, Renal, Respiratory, Ear, Nose, Throat and Gastrointestinal by integrate MalaCards database and Barabási et al. method27.
Pathway enrichment analysis
Information on the biological pathways that the module-related genes are involved in for each topological module was retrieved from DAVID36,37 online analytical tools. We set a corrected P-value <0.05 as the threshold used for enrichment analysis of pathways. The pathway databases we used are KEGG57 and REACTOME58, PANTHER59 and BIOCARTA60.
Systematic Analysis Method
Here we use a systematic analysis method to discover significant modules. The specific steps are shown in Fig. 1. First we integrate 6 different human PPI databases; second, we integrate the HIPPIE database with IRefWeb database to obtain human protein “interactome” network; third, we divided the network into PPI sub-networks (topological modules) based on NeTA algorithm; fourth, construct corresponding function networks (based on detected functional modules) and disease networks (based on detected disease modules); lastly, to view the relationship of different types of modules more clearly, we integrate topological modules, functional modules and disease modules together, to generate an integrative analysis of different network levels, including protein, function and disease networks. We annotated the proteins within each module with the third level of GO slim.
Additional Information
How to cite this article: Liu, W. et al. Integrative analysis of human protein, function and disease networks. Sci. Rep. 5, 14344; doi: 10.1038/srep14344 (2015).
Supplementary Material
Acknowledgments
This work was supported by the National Natural Science Foundation of China under Grant (No. 61374176), and the Science Fund for Creative Research Groups of the National Natural Science Foundation of China (No. 61221003).
Footnotes
Author Contributions W.L. analyzed data, designed and performed research. M.P., W.L., A.P.W. and X.F.W. discussed the results and wrote the manuscript. All authors reviewed the manuscript.
References
- Pinkert S., Schultz J. & Reichardt J. Protein Interaction Networks—More Than Mere Modules. PLoS Comput. Biol. 6, e1000659 (2010). [DOI] [PMC free article] [PubMed] [Google Scholar]
- Schaefer M. H. et al. Adding Protein Context to the Human Protein-Protein Interaction Network to Reveal Meaningful Interactions. PLoS Comput. Biol. 9, e1002860 (2013). [DOI] [PMC free article] [PubMed] [Google Scholar]
- Juyong Lee, Steven P. Gross & Jooyoung Lee Improved network community structure improves function prediction. Sci. Rep. 3, srep02197 (2013). [DOI] [PMC free article] [PubMed] [Google Scholar]
- Sharan R., Ulitsky I. & Shamir R. Network-based prediction of protein function. Mol. Syst. Biol. 3, 88, (2007). [DOI] [PMC free article] [PubMed] [Google Scholar]
- Cho Y.-R., Lei Shi & Aidong Zhang Functional module detection by functional flow pattern mining in protein interaction networks. BMC Bioinformatics 9, S10/O1 (2008). [Google Scholar]
- Yook S. H., Oltvai Z. N. & Barabási A. L. Functional and topological characterization of protein interaction networks. Proteomics 4, 928–942 (2004). [DOI] [PubMed] [Google Scholar]
- Chen J. & Yuan B. Detecting functional modules in the yeast protein-protein interaction network. Bioinformatics 22, 2283–2290 (2006). [DOI] [PubMed] [Google Scholar]
- Pu S., Vlasblom J., Emili A., Greenblatt J. & Wodak S. J. Identifying functional modules in the physical interactome of Saccharomyces cerevisiae. Proteomics 7, 944–960 (2007). [DOI] [PubMed] [Google Scholar]
- Anna C. F. Lewis et al. The function of communities in protein interaction networks at multiple scales. BMC Syst. Biol. 4, 100 (2010). [DOI] [PMC free article] [PubMed] [Google Scholar]
- Yunpeng Zhang et al. Network Analysis Reveals Functional Cross-links between Disease and Inflammation Genes. Sci. Rep. 3, srep03426 (2013). [DOI] [PMC free article] [PubMed] [Google Scholar]
- Bauer-Mehren A. et al. Gene-Disease Network Analysis Reveals Functional Modules in Mendelian, Complex and Environmental Diseases. PLoS ONE 6, e20284 (2011). [DOI] [PMC free article] [PubMed] [Google Scholar]
- Gustafsson et al. Modules, networks and systems medicine for understanding disease and aiding diagnosis. Genome Med. 6, 82 (2014). [DOI] [PMC free article] [PubMed] [Google Scholar]
- Marinka Zitnik et al. Discovering disease-disease associations by fusing systems-level molecular data. Sci. Rep. 3, srep03202 (2013). [DOI] [PMC free article] [PubMed] [Google Scholar]
- Davis D. A. & Chawla N. V. Exploring and Exploiting Disease Interactions from Multi-Relational Gene and Phenotype Networks. PLoS ONE 6, e22670 (2011). [DOI] [PMC free article] [PubMed] [Google Scholar]
- Bauer-Mehren A. et al. Gene-Disease Network Analysis Reveals Functional Modules in Mendelian, Complex and Environmental Diseases. PLoS ONE 6, e20284 (2011). [DOI] [PMC free article] [PubMed] [Google Scholar]
- Reyes-Palomares A., Rodríguez-López R., Ranea J. A. G., Jiménez F. S., Medina M. A. Global Analysis of the Human Pathophenotypic Similarity Gene Network Merges Disease Module Components. PLoS ONE 8, e56653 (2013). [DOI] [PMC free article] [PubMed] [Google Scholar]
- Yang P., Li X., Wu M., Kwoh C.-K. & Ng S.-K. Inferring Gene-Phenotype Associations via Global Protein Complex Network Propagation. PLoS ONE 6, e21502 (2011). [DOI] [PMC free article] [PubMed] [Google Scholar]
- Marc Vidal, Michael E. Cusick & Albert-László Barabási Interactome Networks and Human Disease. Cell 144, 986–998 (2011). [DOI] [PMC free article] [PubMed] [Google Scholar]
- Suthram S. et al. Network-Based Elucidation of Human Disease Similarities Reveals Common Functional Modules Enriched for Pluripotent Drug Targets. PLoS Comput. Biol. 6, e1000662 (2010). [DOI] [PMC free article] [PubMed] [Google Scholar]
- Chan S. Y. & Loscalzo J. The emerging paradigm of network medicine in the study of human disease. Circ. Res. 111, 359–374 (2012). [DOI] [PMC free article] [PubMed] [Google Scholar]
- Kwang-Il Goh & In-Geol Choi Exploring the human diseasome: the human disease network. Brief Funct. Genomics 11, 533–542 (2012). [DOI] [PubMed] [Google Scholar]
- Zhou X. Z. et al. Human symptoms–disease network. Nat. Commun. 5, ncomms5212 (2014). [DOI] [PubMed] [Google Scholar]
- Frank E.-S., Shailesh T., Ricardo de M. S., Ahmed F. H. & Matthias D. The human disease network. Syst. Biomed. 1, 20–28 (2013). [Google Scholar]
- Xiujuan W., Natali G. & Haiyuan Y. Network-based methods for human disease gene prediction. Brief Funct. Genomics 10, 280–293 (2011). [DOI] [PubMed] [Google Scholar]
- Barabási A. L., Natali G. & Joseph L. Network medicine: a network-based approach to human disease. Nat. Rev. Genet. 12, 56–68 (2011). [DOI] [PMC free article] [PubMed] [Google Scholar]
- Laura I. Furlong. Human diseases through the lens of network biology. Trends Genet. 29, 150–159 (2013). [DOI] [PubMed] [Google Scholar]
- Kwang-Il Goh et al. Human disease network. Proc. Natl. Acad. Sci. USA 104, 8685–8690 (2007). [DOI] [PMC free article] [PubMed] [Google Scholar]
- Wei Liu, Matteo Pellegrini & Xiaofan Wang. Detecting Communities Based on Network Topology. Sci. Rep. 4, srep05739 (2014). [DOI] [PMC free article] [PubMed] [Google Scholar]
- Schaefer M. H. et al. HIPPIE: Integrating Protein Interaction Networks with Experiment Based Quality Scores. PLoS ONE 7, e31826 (2012). [DOI] [PMC free article] [PubMed] [Google Scholar]
- Ashburner M. et al. Gene ontology: tool for the unification of biology. The Gene Ontology Consortium. Nat. Genet. 25, 25–29 (2000). [DOI] [PMC free article] [PubMed] [Google Scholar]
- Hamosh Ada A. F. S., Amerger Joanna, Bocchini Carol, Valle David & McKusick Victor A Online Mendelian Inheritance in Man (OMIM), a knowledgebase of human genes and genetic disorders. Nucl. Acids Res. 30, 52–55 (2002). [DOI] [PMC free article] [PubMed] [Google Scholar]
- Beck T., Hastings R. K., Gollapudi S, Free R. C. & Brookes A. J. GWAS Central: a comprehensive resource for the comparison and interrogation of genome-wide association studies. Eur. J. Hum. Genet. 7, 949–952 (2014). [DOI] [PMC free article] [PubMed] [Google Scholar]
- Turinsky A. L., Razick S., Turner B., Donaldson I. M. & Wodak S. J. Navigating the global protein-protein interaction landscape using iRefWeb. Methods Mol. Biol. 1091, 315–331 (2014). [DOI] [PubMed] [Google Scholar]
- Newman M. E. J., Girvan M. Finding and evaluating community structure in networks. Phys. Rev. E 69, 026113 (2004). [DOI] [PubMed] [Google Scholar]
- Maere S., Heymans K. & Kuiper M. BiNGO: a Cytoscape plugin to assess overrepresentation of gene ontology categories in biological networks. Bioinformatics 21, 3448–3449 (2005). [DOI] [PubMed] [Google Scholar]
- Huang D. W., Sherman B. T.& Lempicki R. A. Systematic and integrative analysis of large gene lists using DAVID Bioinformatics Resources. Nature Protoc. 4, 44–57 (2009). [DOI] [PubMed] [Google Scholar]
- Huang D. W., Sherman B. T. & Lempicki R. A. Bioinformatics enrichment tools: paths toward the comprehensive functional analysis of large gene lists. Nucl. Acids Res. 37, 1–13 (2009). [DOI] [PMC free article] [PubMed] [Google Scholar]
- Jeffrey S. Flier. Hormone resistance in diabetes and obesity: insulin, Leptin, and FGF21. Yale J Biol Med. 85, 405–414 (2012). [PMC free article] [PubMed] [Google Scholar]
- Donath M. Y. & Shoelson S. E. Type 2 diabetes as an inflammatory disease. Nat. Rev. Immunol. 11, 98–107 (2011). [DOI] [PubMed] [Google Scholar]
- Porcher C. et al. The T cell leukemia oncoprotein SCL/tal-1 is essential for development of all hematopoietic lineages. Cell 86, 47–57 (1996). [DOI] [PubMed] [Google Scholar]
- Akiyama H. et al. Inflammation and Alzheimer’s disease. Neurobiol. Aging. 21, 383–421 (2000). [DOI] [PMC free article] [PubMed] [Google Scholar]
- Enright A. J., Van Dongen S., Ouzounis C. A. An efficient algorithm for large-scale detection of protein families. Nucl. Acids Res. 30, 1575–1584 (2002). [DOI] [PMC free article] [PubMed] [Google Scholar]
- Kohler S., Bauer S., Horn D. & Robinson P. N. Walking the interactome for prioritization of candidate disease genes. Am. J. Hum. Genet. 82, 949–958 (2008). [DOI] [PMC free article] [PubMed] [Google Scholar]
- Ruepp A. et al. CORUM: the comprehensive resource of mammalian protein complexes—2009. Nucl. Acids Res. 38, D497–D501 (2010). [DOI] [PMC free article] [PubMed] [Google Scholar]
- Barrett T. et al. NCBI GEO: archive for functional genomics data sets–update. Nucleic Acids Res. 41, D991–D995 (2013). [DOI] [PMC free article] [PubMed] [Google Scholar]
- Safran M. et al. GeneCards Version 3: the human gene integrator. Database 2010, baq020 (2010). [DOI] [PMC free article] [PubMed] [Google Scholar]
- Hruz T. et al. RefGenes: identification of reliable and condition specific reference genes for RT-qPCR data normalization. BMC Genomics 12, 156 (2011). [DOI] [PMC free article] [PubMed] [Google Scholar]
- Stark C. et al. The BioGRID Interaction Database: 2011 update. Nucl. Acids Res. 39, D698–D704 (2011). [DOI] [PMC free article] [PubMed] [Google Scholar]
- Salwinski L. et al. The Database of Interacting Proteins: 2004 update. Nucl. Acids Res. 32, D449–D451 (2004). [DOI] [PMC free article] [PubMed] [Google Scholar]
- Keshava Prasad T. S. et al. Human Protein Reference Database–2009 update. Nucl. Acids Res. 37, D767–D772 (2009). [DOI] [PMC free article] [PubMed] [Google Scholar]
- Aranda B. et al. The IntAct molecular interaction database in 2010. Nucl. Acids Res. 38, D525–D531 (2010). [DOI] [PMC free article] [PubMed] [Google Scholar]
- Ceol A. et al. MINT, the molecular interaction database: 2009 update. Nucl. Acids Res. 38, D532–D539 (2010). [DOI] [PMC free article] [PubMed] [Google Scholar]
- Bader G. D., Betel D. & Hogue C. W. BIND: the Biomolecular Interaction Network Database. Nucl. Acids Res. 31, 248–250 (2003). [DOI] [PMC free article] [PubMed] [Google Scholar]
- Shannon P. et al. Cytoscape: a software environment for integrated models of biomolecular interaction networks. Genome Res. 3, 2498–2504 (2003). [DOI] [PMC free article] [PubMed] [Google Scholar]
- Mulin Jun Li et al. GWASdb: a database for human genetic variants identified by genome-wide association studies. Nucl. Acids Res. 40, D1047–D1054 (2012). [DOI] [PMC free article] [PubMed] [Google Scholar]
- Noa Rappaport et al. MalaCards: an integrated compendium for diseases and their annotation. Database (Oxford) 2013, bat018 (2013). [DOI] [PMC free article] [PubMed] [Google Scholar]
- Kanehisa M. & Goto S. KEGG: kyoto encyclopedia of genes and genomes. Nucl. Acids Res. 28, 27–30 (2000). [DOI] [PMC free article] [PubMed] [Google Scholar]
- David Croft et al. Reactome: a database of reactions, pathways and biological processes. Nucl. Acids Res. 39, D691–D697 (2011). [DOI] [PMC free article] [PubMed] [Google Scholar]
- Mi H. & Thomas P. PANTHER pathway: an ontology-based pathway database coupled with data analysis tools. Methods Mol. Biol. 563, 123–140 (2009). [DOI] [PMC free article] [PubMed] [Google Scholar]
- Darryl N. BioCarta. Biotech Software & Internet Report. 2, 117–120 (2001). [Google Scholar]
Associated Data
This section collects any data citations, data availability statements, or supplementary materials included in this article.


