

Abstract
A unique microbiome that metabolizes lactate rather than ethanol for n-caproate production was obtained from a fermentation pit used for the production of Chinese strong-flavour liquor (CSFL). The microbiome was able to produce n-caproate at concentrations as high as 23.41 g/L at a maximum rate of 2.97 g/L/d in batch trials without in-line extraction. Compared with previous work using ethanol as the electron donor, the n-caproate concentration increased by 82.89%. High-throughput sequencing analysis showed that the microbiome was dominated by a Clostridium cluster IV, which accounted for 79.07% of total reads. A new process for n-caproate production was proposed, lactate oxidation coupled to chain elongation, which revealed new insight into the well-studied lactate conversion and carbon chain elongation. In addition, these findings indicated a new synthesis mechanism of n-caproate in CSFL. We believe that this efficient process will provide a promising opportunity for the innovation of waste recovery as well as for n-caproate biosynthesis.
n-Caproate, a medium-chain carboxylate (MCC), is a bio-based fuel precursor and valuable industrial commodity. n-Caproate has emerged as a new end product of the carboxylate platform in which waste is converted to valuable chemicals by a microbiome1. With the growing demand for the development of sustainable waste treatment, n-caproate, which is characterized by high-energy density and hydrophobicity, has been chosen as a more favourable end product than other valuable products, e.g., methane, ethanol and short chain carboxylates (SCCs)2,3,4,5,6,7,8,9. For example, a laboratory-scale energy system that substitutes n-caproate for bio-ethanol derived from cellulosic feedstock has been established to circumvent the fossil fuel consumption for ethanol distillation4,5. A new anaerobic digestion technology, which converts municipal solid waste to valuable n-caproate, has also been reported3,6,7.
The best-known bio-pathway for n-caproate production is chain elongation, a reversed β-oxidation pathway in which SCCs, e.g., acetate and butyrate, are elongated with two-carbon units, acetyl-CoA, derived from a reduced substrate8,9,10,11,12. Ethanol is regarded as the most efficient reduced substrate for n-caproate synthesis by the bacterium Clostridium kluyveri, which has been identified in many studies1,4,5,6,8,9,10,11,12. Without in situ products removal, the n-caproate concentration can reach up to 12.8 g/L via this pathway13. Other substrates, e.g., hydrogen and electrons, have been found to form n-caproate at concentrations of 0.98–1.75 and 0.74 g/L14,15,16. In addition, Clostridium sp. BS-1, Kluyveromyces marxianus and Megasphaera elsdenii have been found to utilize D-galactitol, galactose and sucrose, producing 0.98, 0.15 and 4.69 g/L of n-caproate, respectively17,18,19. The yields of n-caproate derived from these substrates are lower than those derived from ethanol so far, and therefore, n-caproate production investigations have focused on the ethanol conversion pathway2,3,4,5,6,7,8,9. In a typical example of the new anaerobic digestion process for n-caproate recovery, municipal solid waste is converted to n-caproate through the addition of ethanol to the upflow anaerobic filter3,7,8,9.
The fermentation pit used for Chinese strong-flavour liquor (CSFL) production is a unique artificial environment for n-caproate production that contains up to 20.0 g/kg (dry pit mud) n-caproate20. Because liquor fermentation is an ethanol-producing process, it is generally believed that the n-caproate in CSFL is synthesized from ethanol21. However, in our previous study, we observed that the significant increase in n-caproate production was accompanied by a continuous decline in lactate during the development of CSFL fermentation20. It was also found that the concentration of lactate is several times higher than that of ethanol in the fermentation pit20. Although lactate can provide acetyl-CoA for n-butyrate production via reversed β-oxidation22,23,24,25, it has never been considered as a feedstock for n-caproate production, as only trace amounts of n-caproate could be produced in previous studies26,27.
The present study found that lactate can serve as a sole carbon and energy source for n-caproate production by a unique microbiome obtained from the pits, whereas a small amount of n-caproate was produced when the microbiome was fed ethanol. The capacity of the microbiome to produce n-caproate was then tested in lactate-containing medium. Finally, possible processes for the remarkably high n-caproate production by the unique microbiome from lactate were discussed.
Results
n-Caproate Production and Substrate Identification
Mature pit mud (with a pit age of more than 20 years, detailed in the Supplementary Information) was inoculated into the 5 times diluted “yellow water”, diffusate from the fermentation mash, which consisted of mainly lactate, ethanol and glucose (detailed in the Supplementary Information). After more than 90 days of acclimation, the semi-continuously operated reactor (SCOR) achieved stable n-caproate production (see Supplementary Information, Fig. S2). According to literature, n-caproate is usually produced from ethanol. However, interestingly, the simultaneous accumulation of ethanol and n-caproate was observed during the acclimation period, whereas lactate, the other main component, was usually under the detection limit. In this paper, the mechanism for significant n-caproic acid production was then investigated through the substrate identification.
As shown in Fig. 1a, when yellow water was used as the carbon source, the n-caproate concentration increased from 0.61 to 12.93 g/L on day 5, resulting in an average volumetric n-caproate production rate of 2.46 g/L/d. The ethanol concentration increased from 10.42 to 15.50 g/L. The ethanol produced may be derived from other carbohydrates in the “yellow water”. By contrast, both lactate and glucose were depleted to concentrations below the detectable limits from initial concentrations of 19.15 and 3.54 g/L, respectively. Acetate and n-butyrate increased from 0.20 g/L to 1.16 and 2.44 g/L, respectively (Fig. 1a).
Figure 1.

The production of n-caproate using different substrates (a: yellow water as control, b: ethanol, c: lactate, d: glucose) by the unique microbiome. ● ethanol (red); ▲ glucose (red); ■ lactate (red); Δ acetate (black); ♢ n-butyrate (black); ♦ n-caproate (green).
When ethanol was used as the sole reduced substrate, the obtained n-caproate level was only 1.12 g/L, whereas 10.20 g/L of n-butyrate was achieved on day 12 (Fig. 1b). Then, the n-butyrate concentration decreased once the acetate was exhausted. The consumption of ethanol in two weeks was only 7.34 g/L, leaving a large quantity of ethanol remaining.
The other two main components in “yellow water”, lactate and glucose, were then examined. When lactate served as the sole carbon and energy source, the n-caproate concentration reached up to 12.54 g/L in 5 days (Fig. 1c), and both acetate (0.62 g/L) and n-butyrate (0.95 g/L) were detected. Although some bacteria can convert glucose to n-caproate28, in our experiment, glucose was exhausted in 3 days predominantly by the production of n-butyrate (3.36 g/L) and acetate (0.49 g/L). This result indicates that butyrate-producing bacteria may take advantage of the limited glucose (Fig. 1d). The selectivity of n-caproate was 81.36% in the lactate reactor, which was 8.88 times higher than that in the ethanol reactor (see Supplementary Information, Table S1). These results show that the unique microbiome utilizes lactate predominantly for n-caproate production, rather than ethanol or glucose. As none of bacteria has been reported to produce large amount of n-caproate as major product from lactate, it would be interesting to investigate the community of the unique microbiome.
Community Composition Analysis
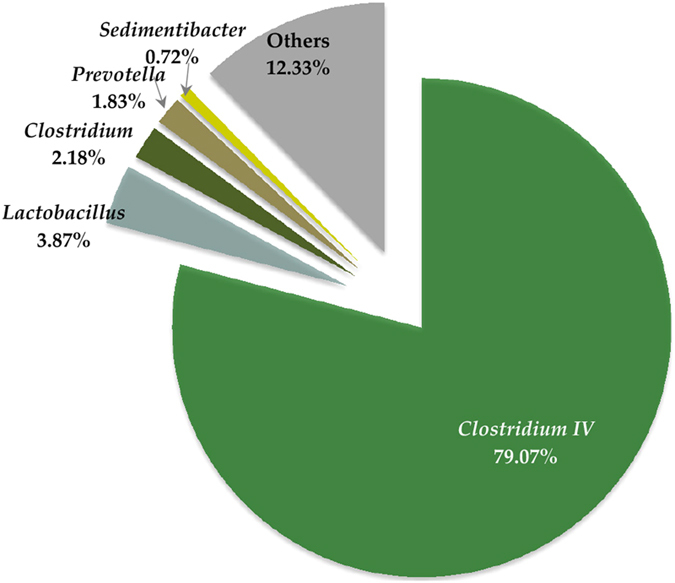
As shown in Fig. S2, caproate production (in reactor SCOR) maintained relatively stable after 30 days, so the microbial communities of the SCOR on day 30 and 90 were investigated to analyse their variation during the long term acclimation. It was found that Clostridium cluster IV (the family of Ruminococcaceae) was always the dominant group. On day 30, Clostridium cluster IV made up 46.54% of the total 16S rRNA sequences (see Supplementary Information, Table S2), whereas 79.07% of the 16S rRNA gene sequences were affiliated with Clostridium cluster IV on day 90 (Fig. 2). The relative abundance of Clostridium cluster IV increased 1.68 times after 60 days. Consequently, the relative abundance of other genera, mainly Lactobacillus and Clostridium, decreased significantly to 3.87 and 2.18%, respectively (Table S2). Lactobacillus belongs to the Lactobacillaceae family, which displays a relatively simple carbon and energy metabolism in which lactose and other carbohydrates are converted to the reduced substrate lactate. Prevotella and Sedimentibacter made up 1.83 and 0.73% of the total genera, respectively. Methanogens, which may compete with n-caproate-producing bacteria for acetate, the carbon bone of n-caproate4,6, exhibited a very low relative abundance of 0.30% (see Supplementary Information, Table S2). Moreover, the two genera of methanogens were hydrogenotrophic methanogens. The average methane content was only 0.30% of the total gas (see Supplementary Information, Fig. S3), indicating that methanogens may be inhibited in the operating bioreactors. Low abundant populations (<0.50%) accounted for 12.33% of the total reads.
Figure 2. The relative abundance levels of genera in the prokaryotic community in the acclimated bioreactors (SCOR) at day 90.
Determination of the Capacity of n-Caproate Production from Lactate
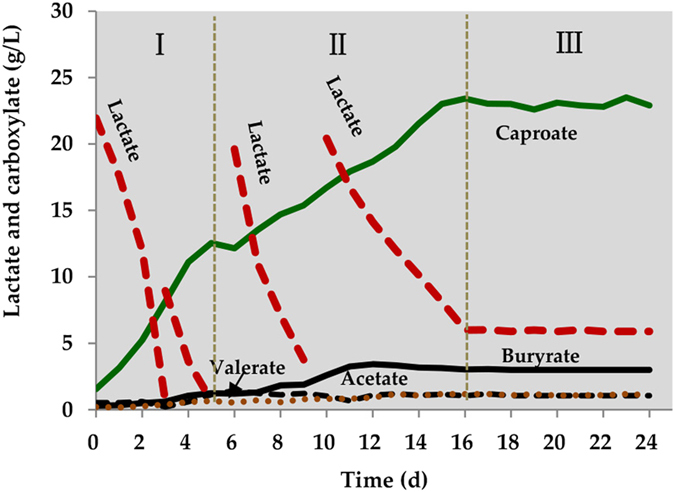
The capacity of n-caproate production of the unique microbiome enriched from the pit mud was investigated in a batch reactor (BR) fed lactate containing medium. Valuable n-caproate accumulated gradually with rapid lactate degradation (Fig. 3). The variation in n-caproate can be divided into three phases. In phase one, 26.62 g/L of lactate was rapidly converted to 10.99 g/L of n-caproate. The highest rate of n-caproate formation was 2.97 g/L/d. Without in-line product removal, the highest concentration of n-caproate obtained in previous studies is approximately 12.0 g/L3,6,13. However, in phase two, the concentration of n-caproate continuously increased to 23.41 g/L at an average rate of 1.08 g/L/d. In phase three, n-caproate production reached a plateau, with a concentration of approximately 23 g/L. Small quantities of acetate (0.53 g/L), n-butyrate (2.70 g/L) and n-valerate (0.88 g/L) were produced, resulting in high selectivity for n-caproate (84.74%), which was similar to the maximum selectivity of 85.0% using ethanol as the reduced substrate9. The hydrogen content gradually decreased to below the detection limit, which resulted in hydrogen pressure, an important factor that prevents n-caproate oxidation24, at a very low level. Indeed, n-caproate oxidation was not observed. Moreover, lactate and other products did not change significantly. Microbial community analysis of the BR showed that Clostridium cluster IV was still the dominant population, reaching a relative abundance of 52.39% in the microbiome (Fig. S4). The other two major populations were Lactobacillus and Clostridium. The cluster analysis (CA) at the order and genus levels indicated highly similarity of the microbial communities between BR and SCOR (Fig. S5). These findings confirmed the reproducibility of this unique microbiome.
Figure 3. n-Caproate production and accumulation using lactate as the sole carbon source in batch experiments.
Discussion
In the present study, the unique microbiome was dominated by the Clostridium cluster IV (Fig. 2). Many lactate-utilizing, butyrate producing bacteria belong to Clostridium clusters IV and XIVa, particularly the latter29,30,31,32. Phylogenetic analysis based on 16S rRNA gene showed that most dominant OTUs of the unique microbiome were more closely related to the species of the Clostridium cluster IV (similarity of 92.2–95.7%) than other lactate-utilizing bacteria, e.g., the species of Clostridium cluster XIVa (Fig. S6). So far, individual species classified in Clostridium cluster IV has been reported to be able to produce n-caproate from saccharides17, but none of the species classified in Clostridium cluster IV or XIVa has been found to synthesize n-caproate from lactate. However, our previous study on the changes in the communities in pit mud from different-aged pits demonstrated that Clostridium cluster IV has a positive correlation with n-caproate formation20. Furthermore, Clostridium cluster IV only constituted 12.71% of the total microbiome in the inoculum (pit mud)20, but the percentage increased significantly to 79.07% within 90 days of acclimation (Fig. 2). Therefore, the high relative abundance of Clostridium IV in the unique microbiome and metabolic features of Clostridium cluster IV members suggest that Clostridium cluster IV may play an important role in the use of lactate and in the production of n-caproate. Lactobacillus was the second most abundant group in the unique microbiome. The function of Lactobacillus is to ferment carbohydrates, e.g., glucose to lactate. Thus, Lactobacillus may make little contribution to the lactate to n-caproate conversion. Clostridium accounted for 2.18% of the total 16S rRNA sequences. Because the best known species C. kluyveri, which use ethanol for caproate production belongs to this taxa, Clostridium may involve in the ethanol to n-butyrate and n-caproate conversion. Prevotella accounted for 1.83% of the total bacteria. This genus can produce n-butyric acid from lactic acid33.
During the lactate conversion process, small amounts of acetate and n-butyrate were observed (Fig. 3). This observation suggests that these metabolites may be intermediate products in n-caproate synthesis or end products of other less-abundant bacteria, e.g., Prevotella. Acetate production can be explained via lactate oxidation22,23,31,32. The n-butyrate may be derived from lactate oxidation coupled to chain elongation (or reverse β-oxidation), in which acetate elongates its carbon chain with acetyl-CoA22,23,24,25,32. Ethanol oxidation coupled to chain elongation is one of most efficient processes for n-caproate generation. However, in the present study, when the sole electron donor fed was ethanol, low concentrations of n-caproate were detected (<2.0 g/L), but n-butyrate was the most common metabolite (Fig. 1b). Therefore, the ethanol oxidation coupling chain elongation was likely not the main pathway for n-caproate production in our experiment. Hydrogen is another electron donor used to form caproate because acetate can be reduced by hydrogen to ethanol, and subsequently, n-butyrate and n-caproate are produced from acetate with ethanol as the electron donor25,34,35. Because ethanol was not the main contributor to n-caproate production in our study, it seemed unfeasible that the unique microbiome using hydrogen as electron donor for caproate formation. Therefore, it was hypothesized that a new process may be responsible for the formation of n-caproate.
Lactate is another important energy-rich, reduced compound that can provide the necessary acetyl-CoA for butyrate production via chain elongation32. Seedorf et al. found that the enzymes that catalyse butyrate production have a function in hexanoyl-CoA for caproate formation12. Taken together, these data suggest that n-caproate production from lactate may be analogous to the process of ethanol oxidation/reverse β-oxidation, and a new process for n-caproate production was proposed: lactate oxidation coupled to reverse β-oxidation (Fig. 4).
Figure 4. Proposed process for n-caproate formation from lactate.
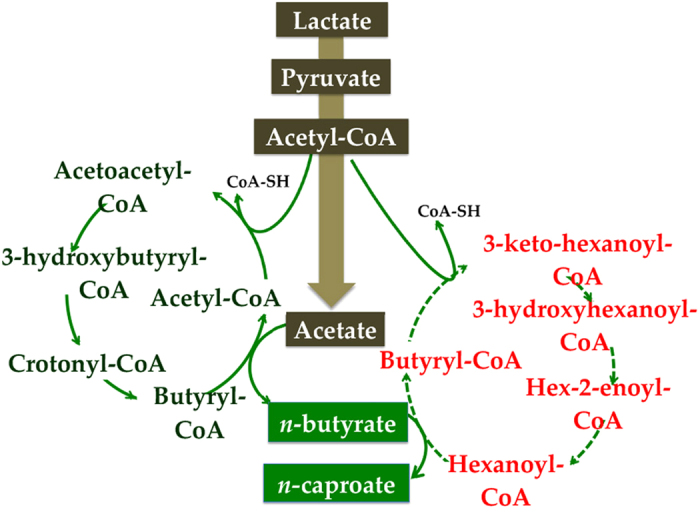
Because the corresponding genes of the enzymes that catalyse n-caproate formation were unknown, the n-caproate formation portion was presumed according to refs 24,36 and marked with a dashed line.
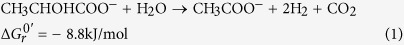
In this proposed process, lactate is oxidized to acetate via pyruvate. Additionally, lactate oxidation provides the necessary acetyl-CoA for the acetate to elongate its carbon length to form n-butyrate. Subsequently, another acetyl-CoA molecule derived from lactate enters into the circle of reverse β-oxidation to form the key intermediate hexanoyl-CoA. Finally, the condensation of hexanoyl-CoA and butyrate leads to the production of n-caproate. During the whole process, acetyl-CoA, energy and reducing equivalents were all derived from lactate. Based on the metabolic process hypothesized, the n-caproate formation can be derived by three coupled reactions shown in Eqs (1)–(3):
 |
 |
 |
Eq. (1) describes the anaerobic oxidation of lactate to acetate, H2 and CO2, which leads to the synthesis of ATP. Eqs (2) and (3) describe the dehydrogenation of lactate, leading to the formation of n-butyrate from lactate and acetate and the formation of n-caproate from lactate and n-butyrate. The combination of Eqs (1) to (3), , gives Eq. (4), which describes n-caproate formation via lactate oxidation coupled with reverse β-oxidation.
 |
The overall conversion is thermodynamically favourable under standard conditions with a Gibbs free energy change of −123.1 kJ/mol. The Eq. 4 indicated that every 3 mol of lactate generates 1 mol of n-caproate. As shown in Fig. 1c, 328 mmol of lactate produced 99 mmol of n-caproate, which satisfies the speculated Eq. 4 well.
According to the thermodynamic analysis and our results, it appears that there is no biochemical barrier in the conversion of lactate to n-caproate, but the known lactate-utilizing bacteria, such as Megasphaera elsdenii and Clostridium acetobutylicum, chiefly produce n-butyric acid, as shown in previous studies22,23,24,25,26,31,37. These bacteria are isolated predominantly from the human intestinal tract and rumen where the pH is usually neutral and lactate can be metabolized rapidly. In contrast, the unique microbiome was evolved from an acidic environment (pH 3.0–6.0) containing up to 166 g/kg of lactate20. The acidic environment and high lactate accumulation may be beneficial for the evolution of lactate-utilizing and n-caproate-producing bacteria.
Many researchers found that the production of n-caproate is hardly to exceed 12 g/L without in-situ product removal, even though the pH is higher than the pKa of the n-caproic acid3,4,5,6,7,8,9,13. For examples, Steinbusch et al. used ethanol as electron donor to produce n-caproate at pH 7.0. The highest concentration they obtained was 8.27 g/L6. Roddick and Britz observed that n-caproate production from glucose can only be accumulated to 11.4 g/L in batch reactor (pH 7.0)38. Choi et al. used sucrose to produce 8.19 g/L of n-caproate (pH 7.0)18. It has been considered that the solubility and toxicity of n-caproate can restrict its bio-production3,4,5,6,7,8,9,13. By contrast, in the similar batch mode experiment without in-line product removal, the yield of n-caproate could reach up to 23.41 g/L in our study, which was nearly two times higher than reported results. Hence, this new process of lactate to n-caproate conversion is clearly a breakthrough for n-caproate synthesis.
As the lactate pathway enables the rapid disposal of reducing equivalents, lactate fermentation usually dominates primary fermentation in mixed cultures when high concentrations of easily degradable substrates, such as food waste, are available11,39,40. Recent trends further demonstrated that lignocellulosic substrates, e.g., corn stalk and sugarcane waste, can also be used for large amount of lactate production41,42. In light of these researches, we provide a new strategy that recover n-caproate from lactate containing fermentation products of waste or agricultural residues which are largely available. It is important to investigate how to combine lactate fermentation with n-caproate production in the future. Given that n-caproate recovery from waste requires sufficient ethanol addition in the current process, the new process of n-caproate production from lactate might become an attractive candidate in biotechnology to recover low grade organic matters to high value-added n-caproate without exogenous energy substrate supply.
Methods
n-Caproate Formation from “Yellow Water”
“Yellow water” (detailed in the Supplementary Information) was diluted by a factor of five with distilled water. The diluted yellow water was boiled for 20 min and flushed with nitrogen gas for 20 min to remove oxygen. In total, 20 g of pit-mud inoculum (detailed in the Supplementary Information) was inoculated into 1.4 L of diluted yellow water in a 1.5-L SCOR (Fig. S1a). 50 mL of effluent was pumped out every day, and an equal volume of yellow water was fed, followed by a reaction period with pH controlled between 5.5 and 6.5 with 5 M HCl and 2 M NaOH. The temperature was maintained at (30 ± 1) °C. The experiment was performed in two parallel replicates.
Identification of the Substrate for n-Caproate Generation
The inoculum was obtained from the effluent of a 1.5-L fermenter (SCOR) that had been fed with “yellow water” for 90 days. A volume of 50 mL of the inoculum described above was inoculated into glass bioreactors with a working volume of 1.0 L (Fig. S1b). The synthetic medium contained the following (g/L): 0.25 NH4Cl, 0.20 MgSO4·7H2O, 0.23 KH2PO4, 0.31 K2HPO4, 0.80 NaCl, 0.25 L-Cysteine-HCl·H2O, 1 mL vitamin solution (see Supplementary Information), 1 mL trace element solution (see Supplementary Information), and 1000 mL distilled water. In addition, 30.0 g/L lactate, 20.0 g/L ethanol (containing acetate 8 g/L), and 10.0 g/L glucose were fed into three groups of reactors, respectively. A control using yellow water as the carbon source was also set up, and a volume of 200 mL of yellow water was added into the basal medium described above. Each group was set up in triplicate. The medium was boiled for 20 min and flushed with nitrogen gas for 10 min. The pH was manually controlled between 6.0–6.5 with 5 M HCl and 2 M NaOH. The temperature was maintained at (30 ± 1) °C.
Assessment of Capacity of the n-Caproate Production from Lactate
The experiment was performed in a batch reactor (BR) with a working volume of 1 L (Fig. S1b). Carbon felts (1.0 × 1.0 cm) were used to immobilize the microbiome. Lactate was used as the sole carbon source in the synthetic medium, which contained (per L) 5 mL of solution A, 2 mL of solution B, a certain amount of the carbon source (lactate), 1 mL of vitamin solution and 1 mL of trace element solution (see in Supplementary Information). Solution A contained the following per L: 10 g of MgSO4·7H2O, 4.5 g of CaCl2·H2O, 93.6 g of NH4Cl. Solution B contained the following per L: 29 g of KH2PO4 and 33 g of K2HPO4. The initial lactate concentration was approximately 20 g/L. The batch experiment ran for 4 cycles. In the first cycle, 950 mL fresh medium was injected into the reactor, and then a 50 mL culture withdrawn from the SCOR was inoculated, followed by a reaction period of 25 days with pH controlled. During the experimental period, lactate was fed into the reactor when it was exhausted. At the end of the cycle, all culture was pumped out, and then 1 L of fresh medium was injected and the next cycle began. The pH was manually controlled between 6.0–6.5 with 5 M HCl and 2 M NaOH. The temperature was maintained at (30 ± 1) °C.
DNA Extraction and MiSeq Sequencing of 16S rRNA Gene Amplicons
Samples (50 mL) were withdrawn from the SCOR at days 30 and 90. An equal amount of sample was withdrawn from the BR at the end of the fourth cycle. All of these samples were centrifuged at 10,000 rpm for 10 min, and then pellets were used for genomic DNA extractions. The PowerSoil DNA Isolation Kit (MoBio Laboratories, USA) was used. DNA density and quality were checked using a NanoDrop Spectrophotometer. Extracted DNA was diluted to a concentration of 10 ng/μL and stored at −40 °C for downstream use. The universal primers 515F (5′-GTGCCAGCMGCCGCGGTAA-3′) and 806R (5′-GGACTACHVGGGTWTCTAAT-3′) with 10 nt barcodes were used to amplify the V4 hypervariable regions of 16S rRNA genes for next-generation sequencing using a Miseq sequencer43,44. PCR and MiSeq sequencing information are detailed in refs 43,44. The sequence data were processed using QIIME Pipeline–Version 1.8.0 (http://qiime.org/tutorials/tutorial.html). All sequence reads were trimmed and assigned to each sample based on their barcodes. Multiple steps were required to trim the sequences, such as the removal of sequences <150 bp and those with an average base quality score Q < 30. The phylogenetic affiliation of each 16S rRNA gene sequence was analysed by a RDP Classifier at a confidence level of 80% (http://pyro.cme.msu.edu/).
Chemical Analysis
Liquid samples were withdrawn every day, centrifuged for 5 min at 10,000 rpm, diluted 20 times with distilled water and then sterilized using a 0.22-μm filter. Carboxylates (C1–C6), lactate, ethanol and glucose concentrations were determined by an Agilent 1260 Infinity liquid chromatography system (Agilent Technologies, USA) equipped with a high performance liquid chromatography (HPLC) column Hi-Plex H (300 × 6.5 mm) and a differential refraction detector (RID). H2SO4 (0.005 M) at a flow rate of 0.6 mL/min was used as the mobile phase. Gas production was estimated by measuring the water displacement. Hydrogen, carbon dioxide and methane analyses were performed using an Agilent 6890 gas chromatography (GC) system (Agilent Technologies, USA) with a thermal conductivity detector (TCD) and a 2-m stainless steel column packed with Porapak Q (50/80 mesh). The operating temperatures at the injection port, column oven, and detector were 100, 70, and 150 °C, respectively. Argon, at a flow rate of 30 mL/min, was used as the carrier gas.
Calculations
Selectivity is the application of bioenergetics to estimation of yield efficient, showing the energy flow in metabolism of bacteria. The selectivity is defined as the concentration of electrons in the product formed divided by the net electrons consumed from the carbon and energy sources. Glucose and lactate contain 24 and 12 mol electrons per mol, respectively45. The detailed calculation is shown in ref. 3.
Additional Information
How to cite this article: Zhu, X. et al. The synthesis of n-caproate from lactate: a new efficient process for medium-chain carboxylates production. Sci. Rep. 5, 14360; doi: 10.1038/srep14360 (2015).
Supplementary Material
Acknowledgments
This work was supported by the Natural Science Foundation of China (No. 31300116, 31270531 and 31470020), the Western Light Talent Culture Project (No. Y4C5011100), and the Open-foundation project of Key Laboratory of Environmental and Applied Microbiology, Chinese Academy of Sciences (No. KLCAS-2013-03). Dr. Tao’s work has been funded by the Natural Science Foundation of China. X.Y.Z., Y.T. and X.Z.L. received compensation as members of the Chengdu Institute of Biology Chinese Academy of Sciences. Other co-authors are students of the Chengdu Institute of Biology, Chinese Academy of Sciences.
Footnotes
Author Contributions Y.T. and X.Y.Z. designed the experiments, X.Y.Z., C.L., N.W., Y.Z. and F.Y.Y. performed the experiments, X.Y.Z., Y.T., W.J.Z. and T.B. analysed and interpreted the data and X.Y.Z., Y.T. and X.Z.L. drafted the report. All authors reviewed and revised the manuscript critically and approved the final version to be published.
References
- Marshall C. W., LaBelle E. V. & May H. D. Production of fuels and chemicals from waste by microbiomes. Curr. Opin. Biotechnol. 24, 391–397 (2013). [DOI] [PubMed] [Google Scholar]
- Agler M., Spirito C. & Usack J. et al. Development of a highly specific and productive process for n-caproate production: applying lessons from methanogenic microbiomes. Water Sci. Technol. 69, 62–68 (2014). [DOI] [PubMed] [Google Scholar]
- Grootscholten T. I. M., Strik D. & Steinbusch K. et al. Two-stage medium chain fatty acid (MCFA) production from municipal solid waste and ethanol. Appl. Energy 116, 223–229 (2014). [Google Scholar]
- Agler M., Spirito C. & Usack J. et al. Chain elongation with reactor microbiomes: upgrading dilute ethanol to medium-chain carboxylates. Energy Environ. Sci. 5, 8189–8192 (2012). [Google Scholar]
- Vasudevan D., Richter H. & Angenent L. Upgrading dilute ethanol from syngas fermentation to n-caproate with reactor microbiomes. Bioresour. Technol. 151, 378–382 (2014) [DOI] [PubMed] [Google Scholar]
- Steinbusch K., Hamelers H. & Plugge C. et al. Biological formation of caproate and caprylate from acetate: fuel and chemical production from low grade biomass. Energy Environ. Sci. 4, 216–224 (2011). [Google Scholar]
- Grootscholten T. I. M., Borgo F. & Hamelers H. V. M. et al. Promoting chain elongation in mixed culture acidification reactors by addition of ethanol. Biomass Bioenergy 48, 10–16 (2013). [Google Scholar]
- Grootscholten T. I. M., Steinbusch K. J. J. & Hamelers H. V. M. et al. Improving medium chain fatty acid productivity using chain elongation by reducing the hydraulic retention time in an upflow anaerobic filter. Bioresour. Technol. 136, 735–738 (2013). [DOI] [PubMed] [Google Scholar]
- Grootscholten T. I. M., Steinbusch K. J. J. & Hamelers H. V. M. et al. Chain elongation of acetate and ethanol in an upflow anaerobic filter for high rate MCFA production. Bioresour. Technol. 135, 440–445 (2013). [DOI] [PubMed] [Google Scholar]
- Barker H., Kamen M. & Bornstein B. The synthesis of butyric and caproic acid from ethanol and acetate by Clostridium Kluyveri. Proc. Natl. Acad. Sci. 31, 374–381 (1945). [DOI] [PMC free article] [PubMed] [Google Scholar]
- Agler M., Wrenn B. & Zinder S. et al. Waste to bioproduct conversion with undefined mixed cultures: the carboxylate platform. Trends in Biotechnol. 29, 70–78 (2011). [DOI] [PubMed] [Google Scholar]
- Seedorf H., Fricke F. W. & Veith B. et al. The genome of Clostridium kluyveri, a strict anaerobe with unique metabolic features. Proc. Natl. Acad. Sci. 105, 2128–33 (2008). [DOI] [PMC free article] [PubMed] [Google Scholar]
- Weimer P. J. & Stevenson D. M. Isolation, characterization, and quantification of Clostridium kluyveri from the bovine rumen. Appl. Microbiol. Biotechnol. 94, 461–466 (2012). [DOI] [PubMed] [Google Scholar]
- Zhang F., Ding J. & Zhang Y. et al. Fatty acids production from hydrogen and carbon dioxide by mixed culture in the membrane biofilm reactor. Water Res. 47, 6122–6129 (2013). [DOI] [PubMed] [Google Scholar]
- Yu H. Q. & Mu Y. Biological hydrogen production in a UASB reactor with granules. II: reactor performance in 3-year operation. Biotechnol. Bioeng. 94, 988–995 (2006). [DOI] [PubMed] [Google Scholar]
- Eerten-Jansen M., Heijne A. & Grootscholten T. et al. Bioelectrochemical poduction of caproate and caprylate from acetate by mixed cultures. ACS Sustain. Chem. Engin. 1, 513−518 (2013). [Google Scholar]
- Jeon B., Kim B. C. & Um Y. et al. Production of hexanoic acid from D-galactitol by saccharides Clostridium sp. BS-1. Appl. Microbial. Biotechnol. 88, 1161–1167 (2010). [DOI] [PubMed] [Google Scholar]
- Choi K., Jeon B. & Kim B. C. et al. In situ biphasic extractive fermentation for hexanoic acid production from sucrose by Megasphaera elsdenii NCIMB 702410. Appl. Biochem. Biotechnol. 171, 1094–1107 (2014). [DOI] [PubMed] [Google Scholar]
- Cheon Y., Kim J. S. & Park J. B. et al. A biosynthetic pathway for hexanoic acid production in Kluyveromyces marxianus. J. Biotechnol. 182–183, 30–36 (2014). [DOI] [PubMed] [Google Scholar]
- Tao Y., Li J. & Rui J. P. et al. Prokaryotic communities in pit mud from different-aged pits used for the production of Chinese strong-flavored liquor. Appl. Environ. Microbiol. 80, 2254–2260 (2014). [DOI] [PMC free article] [PubMed] [Google Scholar]
- Xue Z. Isolation and identification of a caproate-producing K-1 strain from Luzhou-flavor liquor pit mud. J. Chem. Pharm. Res. 6, 2021–2025 (2014). [Google Scholar]
- Prabhu R., Altman E. & Eiteman M. Lactate and acrylate metabolism by Megasphaera elsdenii under batch and steady-state conditions. Appl. Environ. Microbial. 78, 8564–8570 (2012). [DOI] [PMC free article] [PubMed] [Google Scholar]
- Weimer P. & Moen G. Quantitative analysis of growth and volatile fatty acid production by the anaerobic ruminal bacterium Megasphaera elsdenii T81. Appl. Environ. Microbial. 97, 4075–4081 (2013). [DOI] [PubMed] [Google Scholar]
- Spirito C., Richter H. & Rabaey K. et al. Chain elongation in anaerobic reactor microbiomes to recover resources from waste. Curr. Opin. Biotechnol. 27, 115–122 (2014). [DOI] [PubMed] [Google Scholar]
- González-Cabaleiro R., Lema J. & Rodríguez J. et al. Linking thermodynamics and kinetics to assess pathway reversibility in anaerobic bioprocesses. Energy Environ. Sci. 6, 3780–3789 (2013). [Google Scholar]
- Marounek M., Fliegrova K. & Bartos S. Metabolism and some characteristics of ruminal strains of Megasphaera elsdenii. Appl. Environ. Microbiol. 55, 1570–1573 (1989). [DOI] [PMC free article] [PubMed] [Google Scholar]
- Agler M., Werner J. & Iten L. et al. Shaping reactor microbiomes to produce the fuel precursorn-butyrate from pretreated cellulosic hydrolysates. Environ. Sci. Technol. 46, 10229–10238 (2012). [DOI] [PubMed] [Google Scholar]
- Elsden S. R., Gilchrist F. M. & Lewis D. et al. Properties of a fatty acid forming organism isolated from the rumen of sheep. J. Bacteriol. 72, 681–689 (1956). [DOI] [PMC free article] [PubMed] [Google Scholar]
- Charalampopoulos D. & Rastall A. R. [Ecological interaction of bacteria in the human gut] Prebiotics and Probiotics Science and Technology [ Charalampopoulos D. (ed.)] [646] (Springer, 2009). [Google Scholar]
- Van den Abbeele P., Belzer C. & Goossens M. et al. Butyrate-producing Clostridium cluster XIVa species specifically colonize mucins in an in vitro gut model. ISME J. 7, 949–961 (2013). [DOI] [PMC free article] [PubMed] [Google Scholar]
- Duncan S., Louis P. & Flint H. Lactate-utilizing bacteria, isolated from human feces, that produce butyrate as a major fermentation product. Appl. Environ. Microbiol. 70, 5810–5817 (2004). [DOI] [PMC free article] [PubMed] [Google Scholar]
- Duncan S. H., Barcenilla A. & Stewart C. S. et al. Acetate utilization and butyryl coenzyme A (CoA):acetate-CoA transferase in butyrate-producing bacteria from the human large intestine. Appl. Environ. Microbiol. 68, 5186–90 (2002). [DOI] [PMC free article] [PubMed] [Google Scholar]
- Rodríguez F. Control of lactate accumulation in ruminants using Prevotella bryantii [Retrospective Theses and Dissertations] (Iowa State University, 2003). [Google Scholar]
- Steinbusch K. J. J., Hamelers H. V. & Buisman C. J. Alcohol production through volatile fatty acids reduction with hydrogen as electron donor by mixed cultures. Water Res. 42, 4059–4066 (2008). [DOI] [PubMed] [Google Scholar]
- Steinbusch K. J. J., Hamelers H. V. & Schaap J. D. et al. Bioelectrochemical ethanol production through mediated acetate reduction by mixed cultures. Environ. Sci. Technol. 44, 513–517 (2010). [DOI] [PubMed] [Google Scholar]
- Ding H. B. B., Tan G. Y. A. Y. & Wang J. Y. Y. Caproate formation in mixed-culture fermentative hydrogen production. Bioresour. Technol. 101, 9550–9559 (2010). [DOI] [PubMed] [Google Scholar]
- Hino T. & Kuroda S. Presence of lactate dehydrogenase and lactate racemase in Megasphaera elsdenii grown on glucose or lactate. Appl. Environ. Microbiol. 59, 255–259 (1993). [DOI] [PMC free article] [PubMed] [Google Scholar]
- Roddick F. & Britz M. Production of hexanoic acid by free and immobilised cells of Megasphaera elsdenii: influence of in‐situ product removal using ion exchange resin. J. Chem. Technol. Biotechnol. 69, 383–391 (1997). [Google Scholar]
- Li X., Chen Y. & Zhao S. et al. Efficient production of optically pure L-lactate from food waste at ambient temperature by regulating key enzyme activity. Water Res. 70, 148–57 (2015). [DOI] [PubMed] [Google Scholar]
- Russell J. B. & Hino T. Regulation of lactate production in Streptococcus bovis: a spiraling effect that contributes to rumen acidosis. J. Dairy Sci. 68, 1712–1721 (1985). [DOI] [PubMed] [Google Scholar]
- Datta R. & Henry M. Lactate: recent advances in products, processes and technologies—a review. J. Chem. Technol. Biotechnol. 81, 1119–1129 (2006). [Google Scholar]
- Ghaffar T., Irshad M. & Anwar Z. et al. Recent trends in lactate biotechnology: a brief review on production to purification. J Radia. Res. Appl. Sci. 7, 222–229 (2014). [Google Scholar]
- Caporaso J., Lauber C. & Walters W. et al. Global patterns of 16S rRNA diversity at a depth of millions of sequences per sample. Proc. Natl. Acad. Sci. 108, 4516–4522 (2011). [DOI] [PMC free article] [PubMed] [Google Scholar]
- Yao M., Rui J. & Li J. et al. Rate-specific responses of prokaryotic diversity and structure to nitrogen deposition in the Leymus chinensis steppe. Soil Biol. Biochem. 79, 81–90 (2014). [Google Scholar]
- McCarty P. Stoichiometry of biological reactions [Water Technol., (ed.)] [157–172] (1975).
Associated Data
This section collects any data citations, data availability statements, or supplementary materials included in this article.