Abstract
Stem cell niches provide resident stem cells with signals that specify their identity. Niche signals act over a short-range such that only stem cells but not their differentiating progeny receive the self-renewing signals1. However, the cellular mechanisms that limit niche signaling to stem cells remain poorly understood. Here we show that the Drosophila male germline stem cells (GSCs) form previously unrecognized structures, microtubule-based (MT)-nanotubes, which extend into the hub, a major niche component. MT-nanotubes are observed specifically within GSC populations, and require IFT (intraflagellar transport) proteins for their formation. The BMP receptor Tkv localizes to MT-nanotubes. Perturbation of MT-nanotubes compromises activation of Dpp signaling within GSCs, leading to GSC loss. Moreover, Dpp ligand and Tkv receptor interaction is necessary and sufficient for MT-nanotube formation. We propose that MT-nanotubes provide a novel mechanism for selective receptor-ligand interaction, contributing to the short-range nature of niche-stem cell signaling.
The Drosophila testis represents an excellent model system to study niche-stem cell interactions owing to its well-defined anatomy: 8–10 GSCs are attached to a cluster of somatic hub cells, which serve as a major component of the stem cell niche (Fig. 1a). The hub secretes at least two ligands: the cytokine-like ligand Unpaired (Upd), and a BMP ligand Decapentaplegic (Dpp), both of which regulate GSC maintenance2,3,4,5. GSCs typically divide asymmetrically, so that one daughter of the stem cell division remains attached to the hub and retains stem cell identity, while the other daughter, called a gonialblast (GB), is displaced away from the hub and initiates differentiation6. Given the close proximity of GSCs and GBs, the ligands (Upd and Dpp) must act over a short range so that signaling is only active in stem cells, but not in differentiating germ cells. The basis for this sharp boundary of pathway activation remains poorly understood.
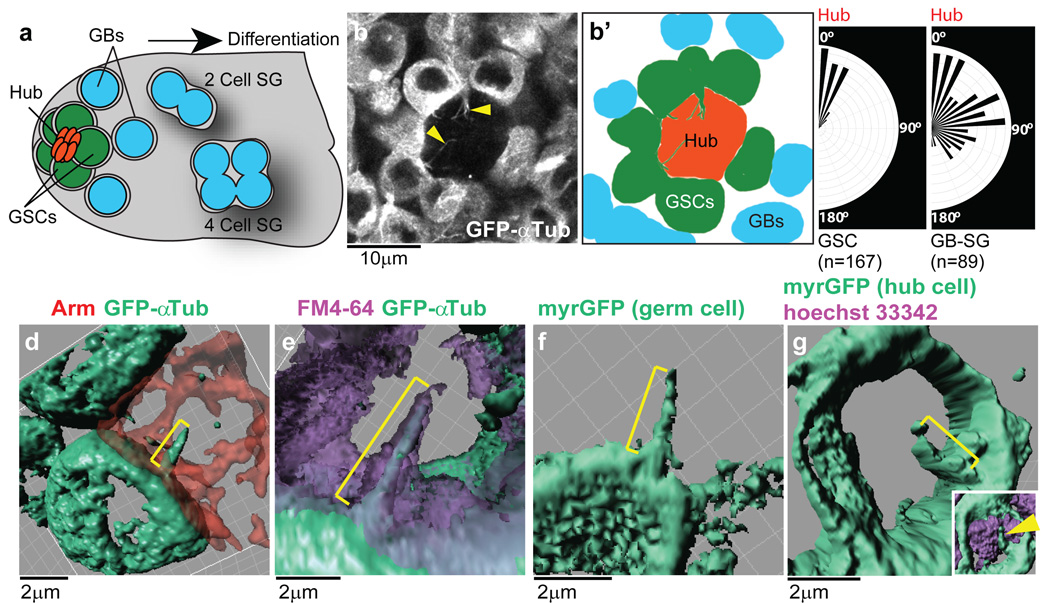
Fig. 1. Characterization of MT-nanotubes in Drosophila male GSC niche.
a) A schematic of the Drosophila male GSC niche. GSCs are attached to the hub cells. The immediate daughters of GSCs, the gonialblasts (GBs) are displaced away from the hub, and become spermatogonia (SGs). b) An apical tip of the testis expressing GFP-αTub in germ cells (nos > GFP-αtub). MT-nanotubes are indicated by arrowheads. Graphic interpretation of b) is shown in b’). c) Orientation of nanotubes toward the hub in GSCs vs. GBs/SGs. The size of each vector represents the frequency of MT-nanotubes oriented toward each direction. Indicated numbers of nanotubes (N > 30 testes) were scored from 3 independent experiments. d-g) 3D rendering images of MT-nanotubes (brackets) in fixed (d) or live tissue (e-g), with indicated cell membrane markers. nos-gal4 > GFP-αtub was used for d-e.
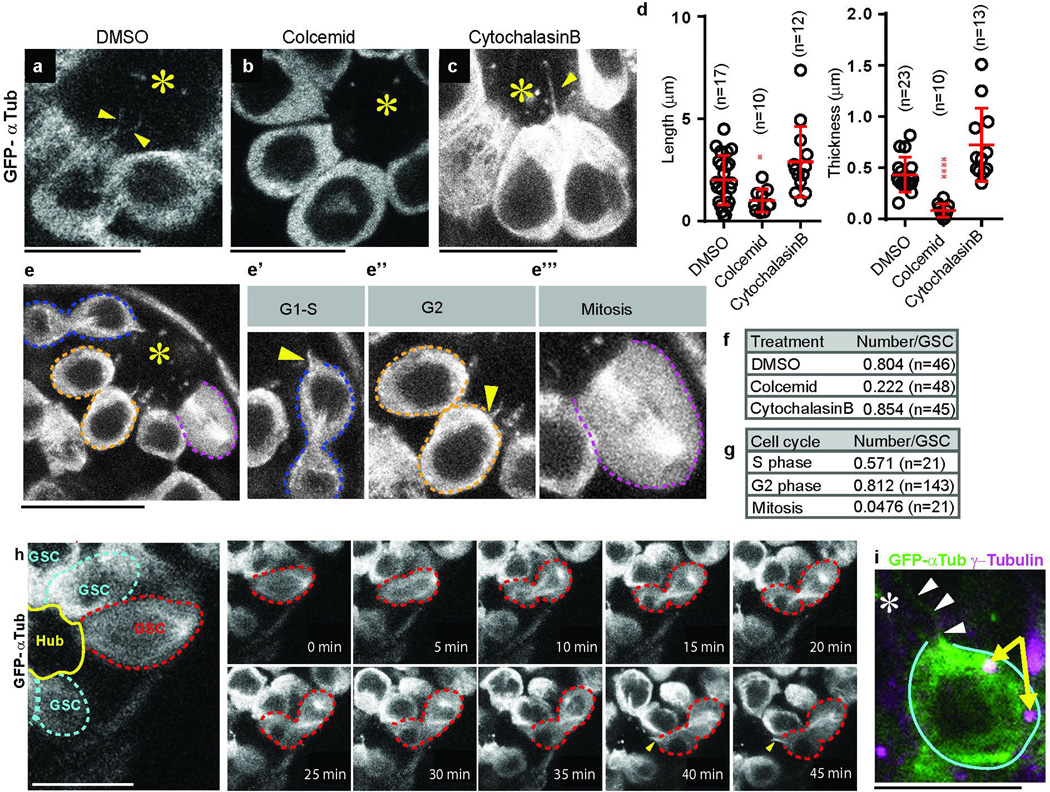
Using GFP-α1-tubulin84B expressed in germ cells (nos-gal4 > UAS-GFP-αtub), we found that GSCs form protrusions, referred to as MT-nanotubes hereafter, that extend into the hub (Fig. 1b). MT-nanotubes are sensitive to fixation similar to other thin protrusions reported to date, such as tunneling nanotubes7 and cytonemes8, explaining why they have escaped detection in previous studies. MT-nanotubes appear to be specific to GSCs: we observed 6.67 MT-nanotubes/testes in the GSC population (or 0.82/cell, N=73 testes). The average thickness and length of MT-nanotubes are 0.43±0.29 µm (at the base of MT-nanotube, N=51 nanotubes) and 3.32 ± 1.6 µm (N=82 nanotubes), respectively. These GSC MT-nanotubes are uniformly oriented toward the hub area (Fig. 1c). By contrast, differentiating germ cells showed only 0.44 MT-nanotubes/testis (or < 0.002/cell, N=75 testes), without any particular orientation when present (Fig. 1c). MT-nanotubes were sensitive to colcemid, the microtubule-depolymerizing drug, but not to the actin polymerization inhibitor cytochalasin B, suggesting that MT-nanotubes are microtubule-based structures (Extended Data Fig. 1a-d, f). MT-nanotubes were not observed in mitotic GSCs (Extended Data Fig. 1e, g), and GSCs form new MT-nanotubes as they exit from mitosis (Extended Data Fig. 1h and Supplementary Video 1). By contrast, MT-nanotubes in interphase GSCs were stably maintained through up to 1 hour of time-lapse live imaging (Supplementary Video 2). Although cell cycle-dependent formation of MT-nanotube resembles that of primary cilia9, 10, MT-nanotubes are distinct structures, in that they lack acetylated microtubules and are sensitive to fixation. Furthermore, a considerable fraction of GSCs form multiple MT-nanotubes/cell (54% of GSCs with MT-nanotubes, N=251 GSCs), and MT-nanotubes are not always associated with the centrosome/basal body, as is the case for the primary cilia (Extended Data Fig. 1i).
To further examine the geometric relationship between MT-nanotubes and hub cells, we imaged MT-nanotubes in combination with various cell membrane markers, followed by 3D rendering. Although the MT-nanotubes are best visualized in unfixed testes that express GFP-αTub in germ cells, adding a low concentration (1µM) of taxol to the fixative preserves MT-nanotubes, allowing immunofluorescence staining. First, Armadillo (Arm, β-catenin) staining, which marks adherens junctions formed at hub cell-hub cell as well as hub cell-GSC boundaries, revealed that adherens junctions does not form on the surface of MT-nanotubes (Fig. 1d, Supplementary Video 3). Using FM4-64 styryl dye, we found that the MT-nanotubes are ensheathed by membrane lipids (Fig. 1e, Supplementary Video 4, 5). Furthermore, myrGFP, a membrane marker, expressed in either the germline (Fig. 1f) or hub cells (Fig. 1g) illuminated MT-nanotubes, suggesting that the surface membrane of a MT-nanotube is juxtaposed to hub cell plasma membrane.
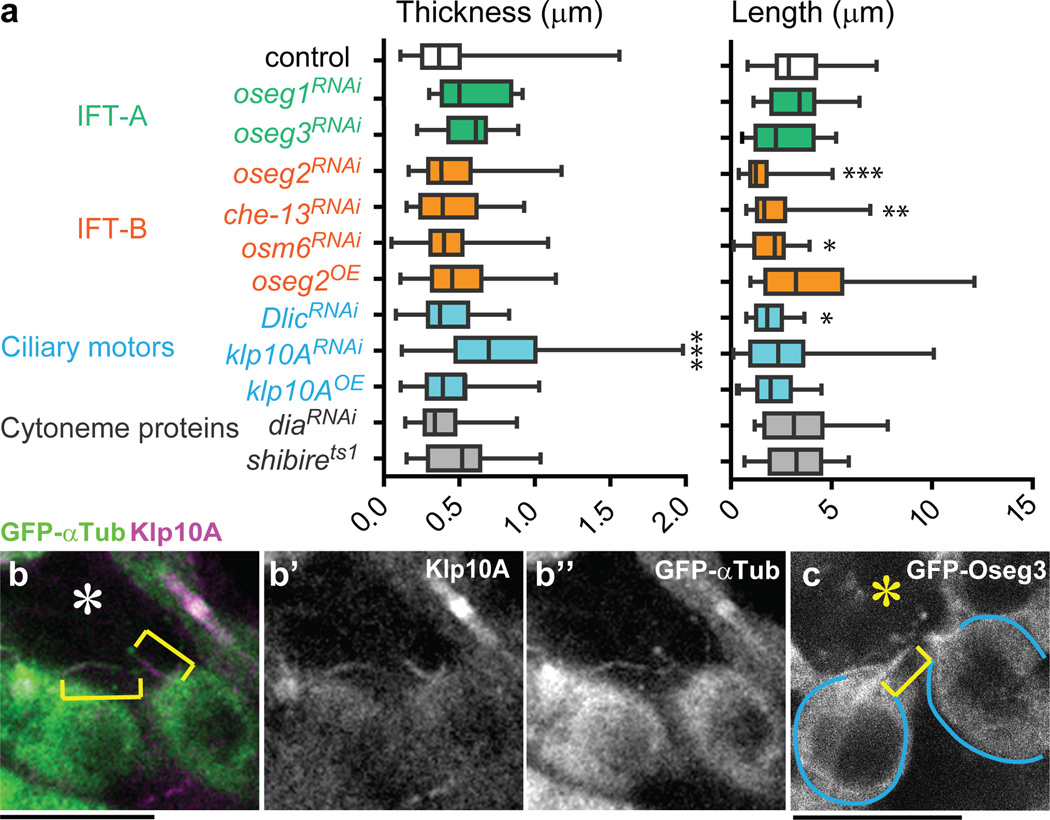
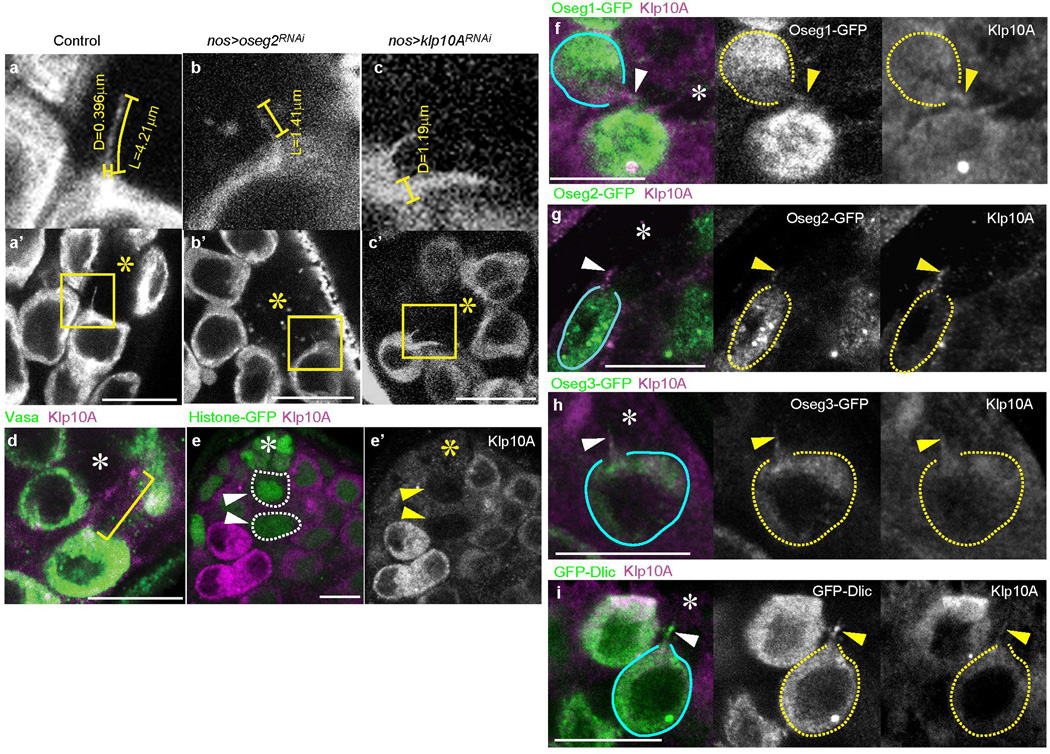
We examined genes that regulate primary cilia and cytonemes for their possible involvement in MT-nanotube formation (Fig. 2a). RNAi-mediated knockdown of oseg2 (IFT172), osm6 (IFT52) and che-13 (IFT57), components of the IFT-B complex that are required for primary cilium anterograde transport and assembly11, significantly reduced the length and the frequency of MT-nanotubes (Fig. 2a, Extended Data Fig. 2b, Table 1). Knockdown of Dlic, a dynein intermediate chain required for retrograde transport in primary cilia12, also reduced the MT-nanotube length and frequency (Fig. 2a, Extended Data Table 1). Knockdown of klp10A, a Drosophila homolog of mammalian kif24 (a MT-depolymerizing kinesin of kinesin-13 family, which suppresses precocious cilia formation13), resulted in abnormally thick/bulged MT-nanotubes (Fig. 2a, Extended Data Fig. 2c, Table 1). We did not observe significant changes in MT-nanotube morphology upon knockdown of IFT-A retrograde transport genes, such as oseg1 and oseg3 (Fig. 2a, Extended Data Table 1). Endogenous Klp10A localized to MT-nanotubes both in wild type testes and GFP-αTub expressing testes (Fig. 2b, Extended Data Fig. 2d, e). GFP-Oseg2 (IFT-B), GFP-Oseg1, GFP-Oseg3 (IFT-A) and Dlic also localized to the MT-nanotubes when expressed in germ cells (Fig. 2c, Extended Data Fig. 2f-i). The localization of IFT-A components to MT-nanotubes, without detectable morphological abnormality upon mutation/knockdown, is reminiscent of the observation that a majority of the IFT-A genes are not required for primary cilia assembly14,15,16,17. Expression of a dominant negative form of Dia (DiaDN) or a temperature sensitive form of Shi (Shits) in germ cells (nos-gal4 > UAS-diaDN or UAS-shits), which perturb cytoneme formation18, did not influence the morphology or frequency of MT-nanotubes in GSCs (Fig. 2a, Extended Data Table 1). Taken together, these results show that primary cilia proteins localize to MT-nanotubes and regulate their formation.
Fig. 2. IFT genes are required for MT-nanotube formation.
a) Effect of RNAi-mediated knockdown or overexpression (OE) of indicated genes on MT-nanotube morphology. Boxplot shows 25–75% (box), median (band inside) and min to max (whiskers). Indicated numbers of nanotubes (Extended Data Table 1) from 2≤independent crosses were scored for each data point. P values from t-test are provided as *P ≤ 0.05; **P ≤ 0.01; *** P ≤ 0.001. b) Examples of MT-nanotubes stained by anti-Klp10A antibody in GFP-αTub-expressing testis. c) Apical testis tip expressing GFP-Oseg3 in germ cells. MT-nanotube is indicated by brackets. GSCs are indicated by blue lines. Hub is indicated by the asterisk. Bar: 10µm.
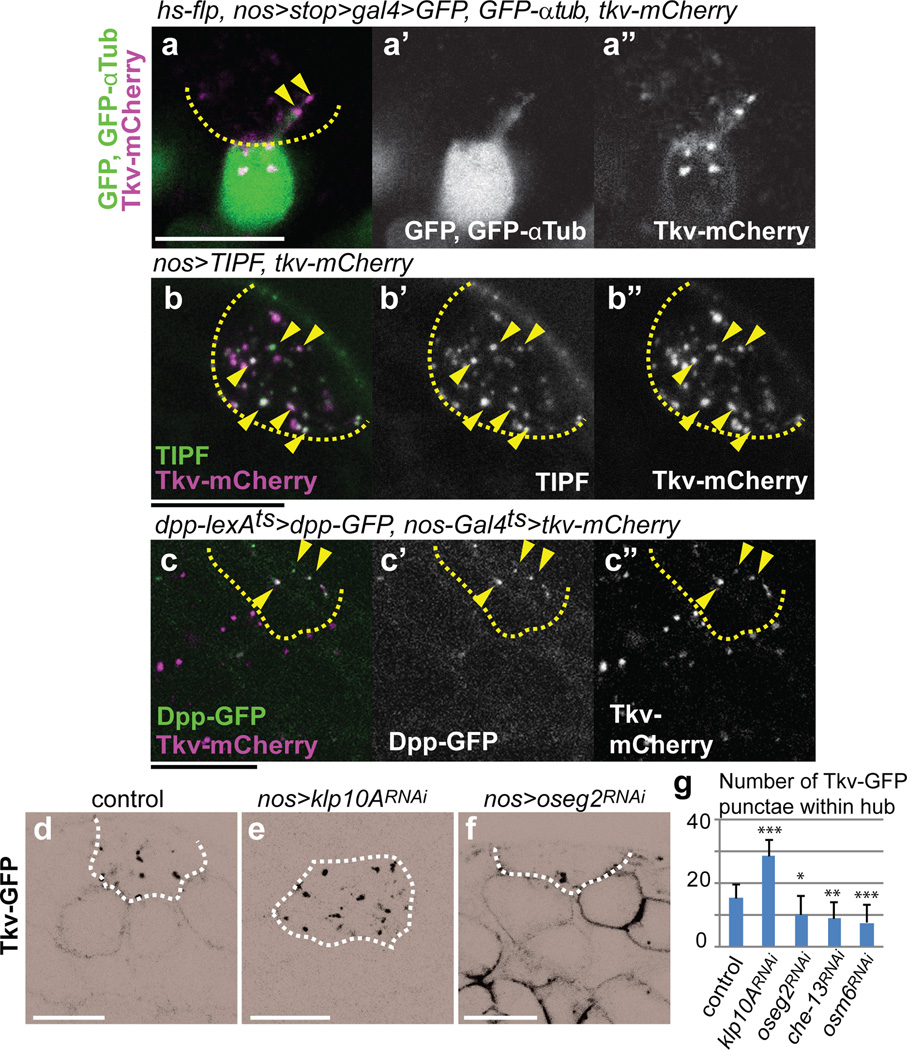
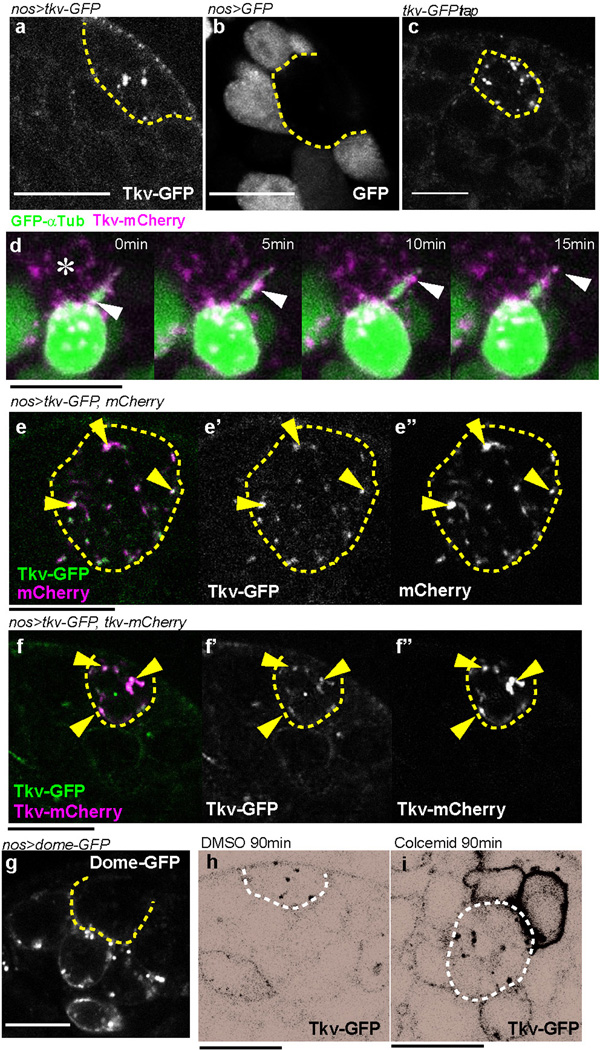
In search of the possible involvement of MT-nanotubes in hub-GSC signaling, we found that the Dpp receptor, Thickveins (Tkv), expressed in germ cells (nos-gal4 > tkv-GFP) was observed within the hub region (Extended Data Fig. 3a), in contrast to GFP alone, which remained within the germ cells (Extended Data Fig. 3b). A GFP protein trap of Tkv (in which GFP tags Tkv at the endogenous locus) also showed the same localization pattern as Tkv-GFP expressed by nos-gal4 (Extended Data Fig. 3c). By inducing GSC clones that co-express Tkv-mCherry and GFP-αTub, we found that Tkv-mCherry localizes along the MT-nanotubes as puncta (Fig. 3a). Furthermore, using live observation, Tkv-mCherry puncta were observed to move along the MT-nanotubes marked with GFP-αTub (Extended Data Fig. 3d), suggesting that Tkv is transported towards the hub along the MT-nanotubes. It should be noted that, in the course of our study, we noticed that mCherry itself localized to the hub when expressed in germ cells, similar to Tkv-GFP and Tkv-mCherry (see Extended Data Fig. 3e, f, Supplementary note1). Importantly, the receptor for Upd, Domeless (Dome), predominantly stayed in the cell body of GSCs (Extended Data Fig. 3g), demonstrating the specificity/selectivity of MT-nanotubes in trafficking specific components of the niche signaling pathways. A reporter of ligand-bound Tkv, TIPF19, localized to the hub region together with Tkv-mCherry (Fig. 3b), in addition to its reported localization at the hub-GSC interface19. Furthermore, Dpp-GFP expressed by hub cells colocalized with Tkv-mCherry expressed in germline (Fig. 3c, dpp-lexAts > dpp-GFP, nos-gal4ts > tkv-mCherry). These results suggest that ligand (Dpp)-receptor (Tkv) engagement and activation occurs at the interface of the MT-nanotube surface and the hub cell plasma membrane. Knockdown of IFT-B components (oseg2RNAi, che-13RNAi or osm6RNAi), which reduces MT-nanotube formation, resulted in reduction of the number of Tkv-GFP puncta in the hub area, concomitant with increased membrane localization of Tkv-GFP (Fig 3d, f, g). A similar trend was observed upon treatment of the testes with colcemid (Extended Data Fig. 3h, i), suggesting that MT-nanotubes are required for trafficking of Tkv into the hub area. By contrast, knockdown of Klp10A, which causes thickening of MT-nanotubes, led to an increase in the number of Tkv-GFP puncta in the hub area (Fig. 3d, e, g). Taken together, these data suggest that Tkv is trafficked into the hub via MT-nanotubes, where it interacts with Dpp secreted from the hub.
Fig. 3. Dpp signaling components localize to the MT-nanotubes.
a) A GSC clone expressing Tkv-mCherry, GFP-αTub and GFP (hs-flp, nos-FRT-stop-FRT-gal4, UAS-GFP, UAS-GFP-αtub, UAS-tkv-mCherry). b) An apical tip of the testis expressing TIPF and Tkv-mCherry in germ cells. Arrowheads point to a few of colocalizing puncta. c) An apical tip of the testis expressing Dpp in the hub and Tkv in germ cells (dpp-lexAts > dpp-GFP, nos-gal4ts > tkv-mCherry). g-k) Tkv-GFP expressed in control (d), klp10ARNAi (e), oseg2RNAi (f) germ cells (nos-gal4ts > UAS-tkv-GFP, UAS-RNAi). Black and white of micrograph was inverted for better visibility of Tkv localization to the hub and plasma membrane. g) Average number and standard deviations of Tkv-GFP puncta within hub area/testis for indicated genotypes. N=15 testes from 2≤ independent crosses were scored. P values from t-test are provided as *P ≤ 0.05; **P ≤ 0.01; *** P ≤ 0.001. Bar: 10µm.
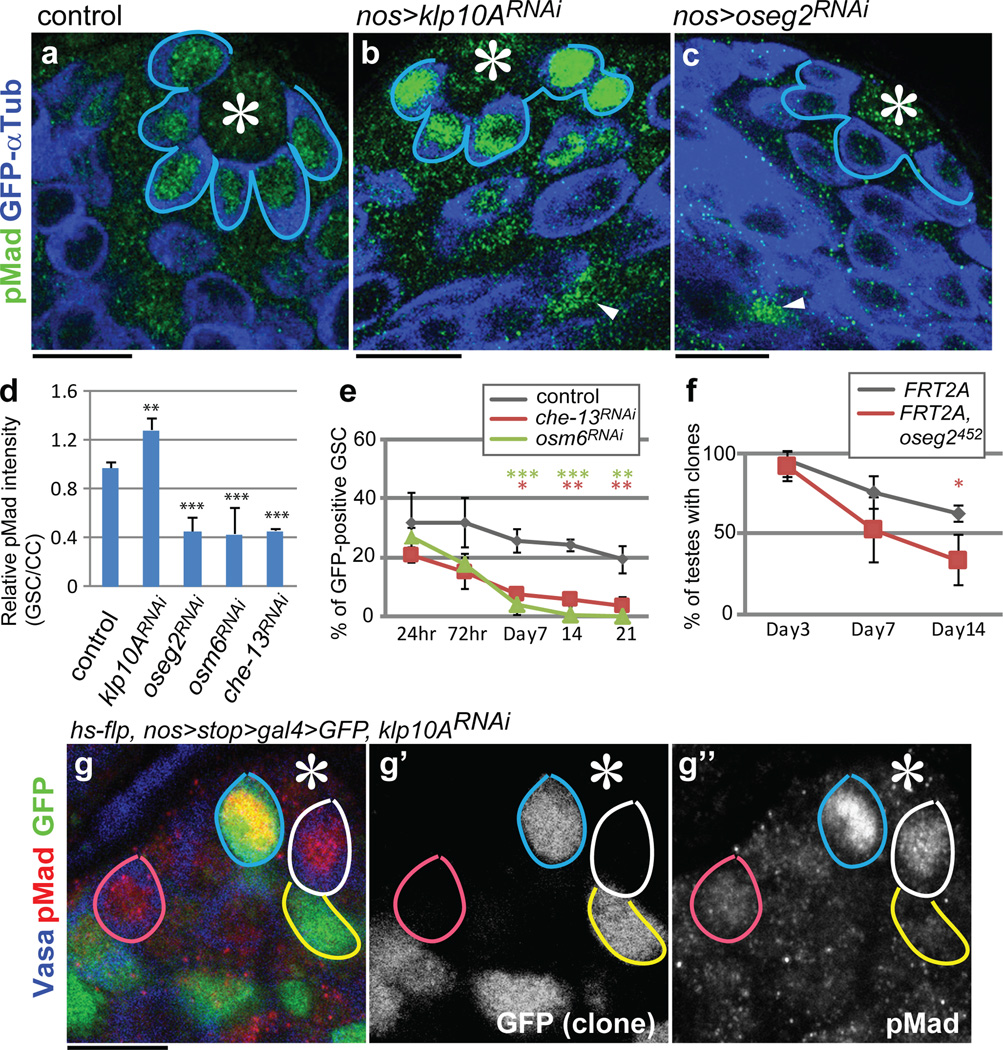
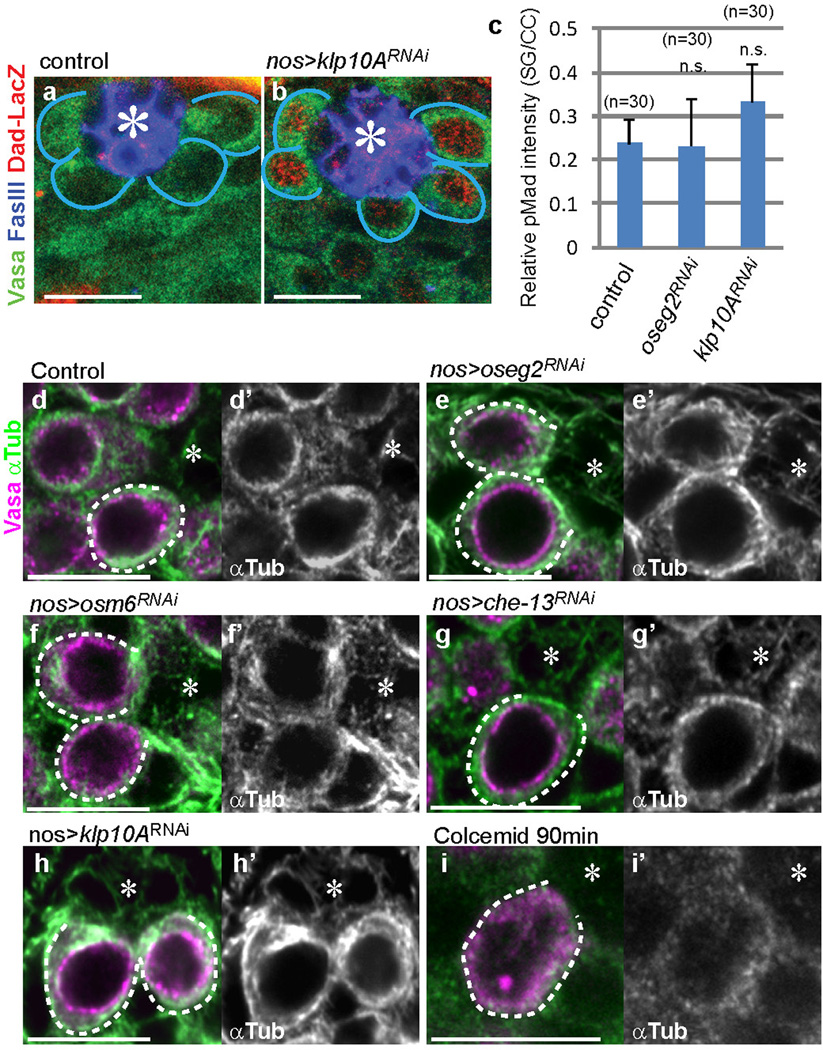
Knockdown of klp10A (klp10ARNAi) led to elevated pMad levels, a readout of Dpp pathway activation, in GSCs (Fig. 4a, b, d, Supplementary note2). By contrast, RNAi-mediated knockdown of oseg2, osm6 and che-13 (IFT-B components), which causes shortening of MT-nanotubes, reduced the levels of pMad in GSCs (Fig. 4c, d). Dad-LacZ, another readout of Dpp signaling activation, exhibited clear upregulation upon knockdown of klp10A (Extended Data Fig. 4a, b). GSC clones of che-13RNAi, osm6RNAi or oseg2452 were lost rapidly compared to control clones (Fig. 4e, f), consistent with the idea that MT-nanotubes help to promote Dpp signal transduction3,4. Knockdown of oseg2, che-13 and osm6 did not visibly affect cytoplasmic microtubules (Extended Data Fig. 4d-g), suggesting that GSC maintenance defects upon knockdown of these genes are likely mediated by their role in MT-nanotube formation. Global RNAi knockdown of these genes in all GSCs using nos-gal4 did not cause a significant decrease in GSC numbers (not shown), indicating that compromised Dpp signaling due to MT-nanotube reduction leads to a competitive disadvantage in regards to GSC maintenance only when surrounded by wild type GSCs.
Fig. 4. MT-nanotubes are required for Dpp signaling activation and GSC maintenance.
a-c) Phosphorylated Mad (pMad) staining in control (a), klp10ARNAi (b) and oseg2RNAi (c) testes. pMad signal in somatic cyst cells (arrowheads), which remains unaffected by germ-cell specific modulation of MT-nanotube components, was used to normalize pMad levels in GSCs. d) Quantification of pMad intensity in the GSCs of indicated genotypes. Indicated numbers of GSCs (Extended Data Table 1) from 2≤ independent crosses were scored for each data point. e, f) Maintenance of che-13RNAi, osm6RNAi (e) and oseg2452 (f) mutant GSC clones. Indicated numbers of GSCs (Supplementary Table 1) from 2≤ independent experiments were scored for each data point. g) A klp10ARNAi GSC clone (72 hours after clone induction, blue circle) with a higher pMad level, compared to control GSCs (white circle). klp10ARNAi SG clone (yellow circle) and control SG clone (pink circle) have similar pMad levels. Hub is indicated by asterisks. Bar: 10µm. Average value and standard deviations are shown in each graph. P values from t-test are provided as *P ≤ 0.05; **P ≤ 0.01; *** P ≤ 0.001; n.s.: non-significant (P > 0.05).
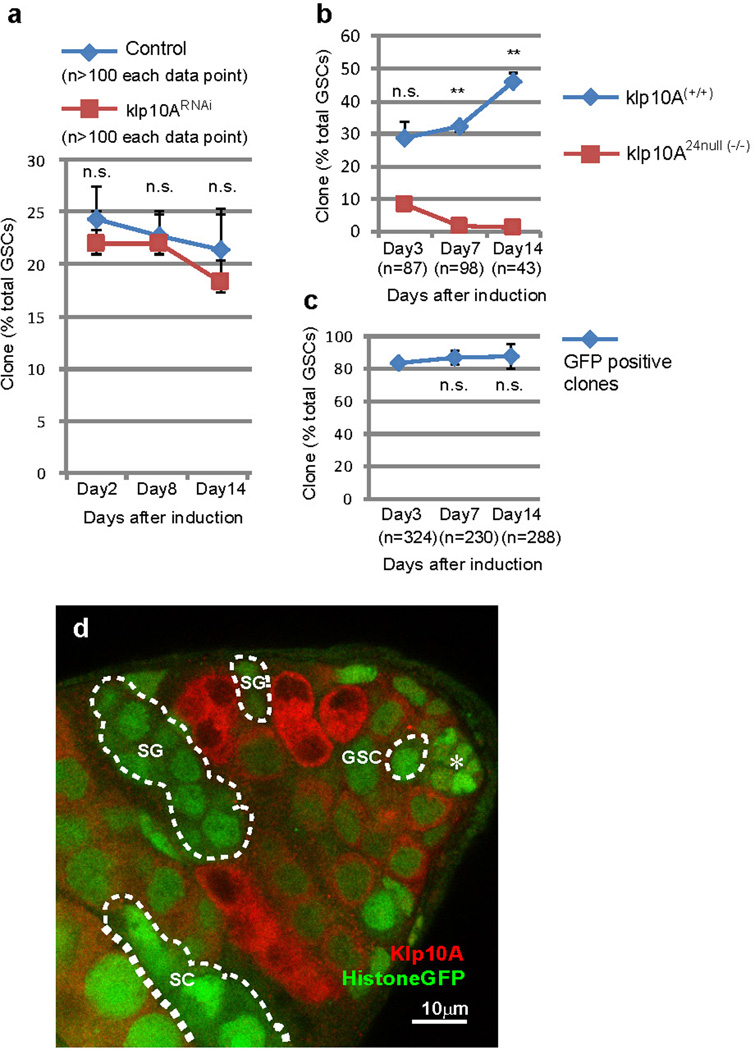
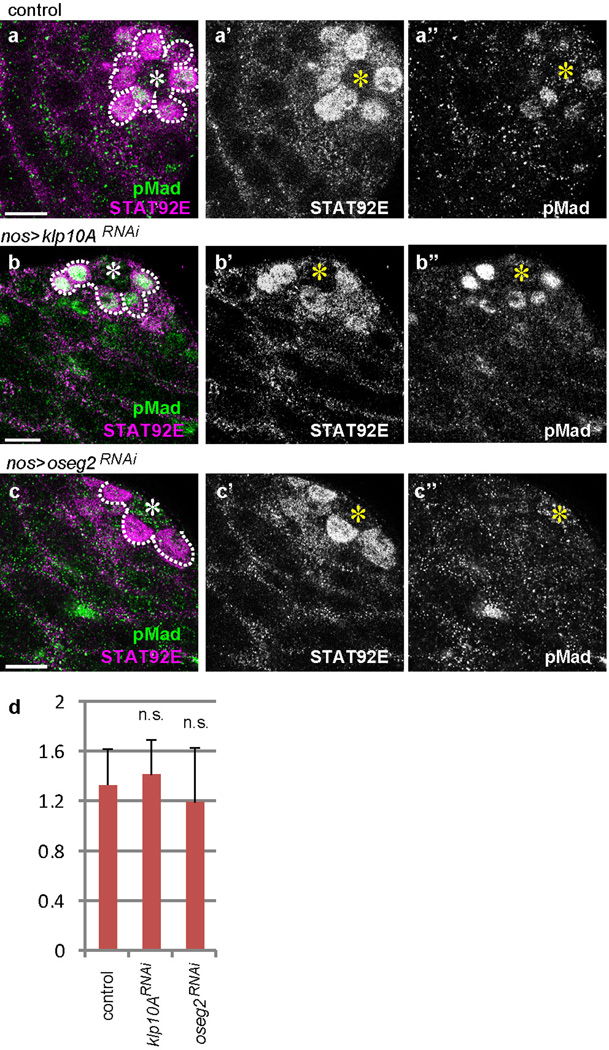
When klp10ARNAi GSC clones were induced, pMad levels specifically increased in those GSC clones, indicating that Klp10A acts cell-autonomously in GSCs to influence Dpp signal transduction (Fig. 4g-g”). Importantly, klp10ARNAi spermatogonia (SGs) (Fig. 4g-g”, yellow line) did not show a significant elevation in pMad level compared to control SGs (Fig.4.g-g”, pink line), demonstrating that Klp10A’s role in regulation of Dpp pathway is specific to GSCs. pMad levels did not change in SGs upon manipulation of MT-nanotube formation (Extended Data Fig. 4c). GSC clones of klp10ARNAi or klp10A null mutant (klp10A24) did not dominate in the niche, despite upregulation of pMad (Extended Data Fig.5), possibly because of its known role in mitosis20. Importantly, these conditions did not significantly change STAT92E levels, which reflect Upd-JAK-STAT signaling in GSCs2,21, revealing the selective requirement of MT-nanotubes in Dpp signaling (Extended Data Fig. 6). Together, these results demonstrate that MT-nanotubes specifically promote Dpp signaling and their role in enhancing the Dpp pathway is GSC specific.
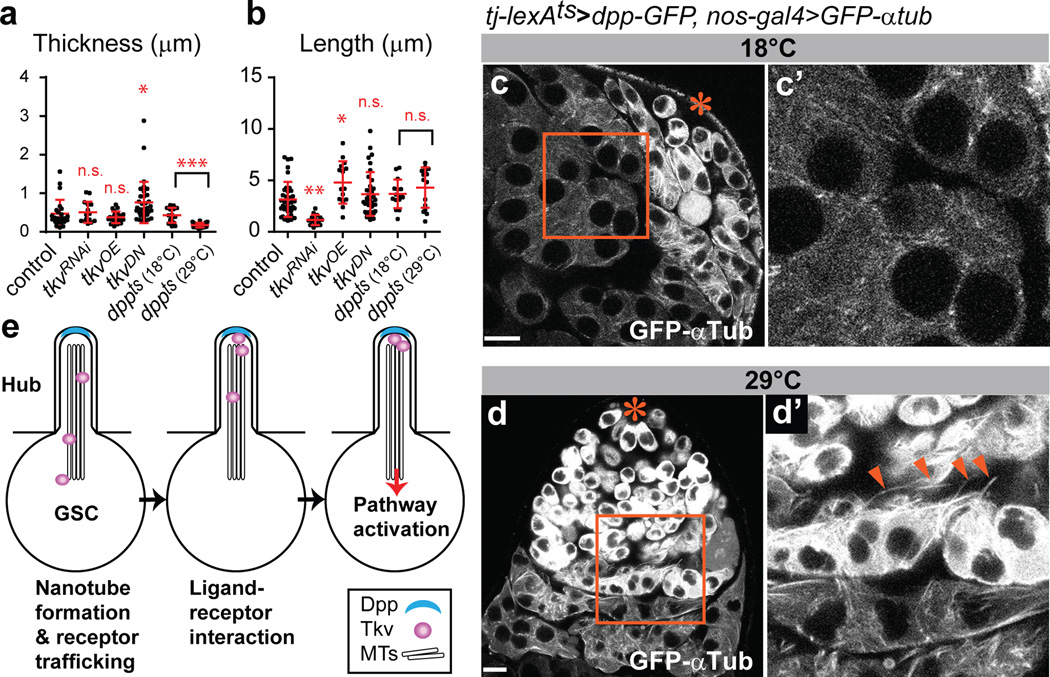
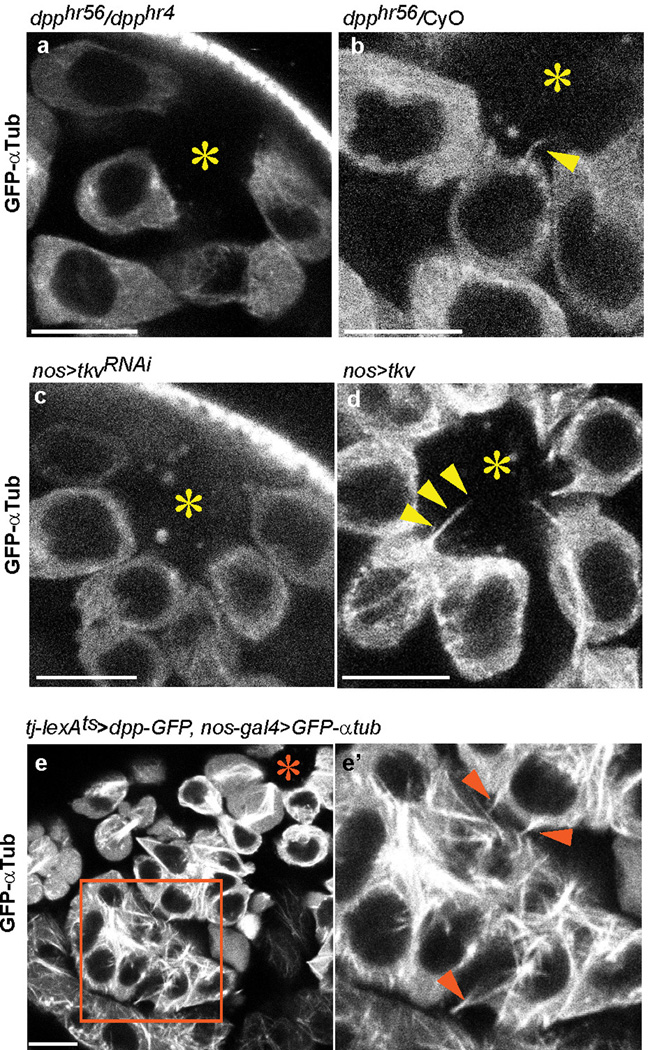
Since cytonemes are induced/stabilized by the signaling molecules themselves18, we explored the possible involvement of Dpp in MT-nanotube formation. First, we found that a temperature-sensitive dpp mutant (dpphr56/dpphr4) exhibited a dramatic decrease in the frequency of MT-nanotubes (0.067 MT-nanotubes/GSC, N=244 GSCs) and the remaining MT-nanotubes were significantly thinner (Fig. 5a, b, Extended Data Fig. 7a, b, Table 1). Knockdown of tkv (tkvRNAi) in GSCs also resulted in reduced length and frequency of MT-nanotubes (Fig. 5a, b, Extended Data Fig. 7c, Table 1). Conversely, overexpression of Tkv (tkvOE)22 in germ cells led to significantly longer MT-nanotubes (Fig. 5a, b, Extended Data Fig. 7d, Table 1). Interestingly, expression of a dominant negative Tkv (tkvDN), which has intact ligand-binding domain but lacks its intracellular GS domain and kinase domain resulted in thickening of MT-nanotubes, rather than reducing the thickness/length (Fig. 5a, b, Extended Data Table 1). This indicates that ligand-receptor interaction, but not downstream signaling events, is sufficient to induce MT-nanotube formation. Strikingly, upon ectopic expression of Dpp in somatic cyst cells (tj-lexA > dpp), spermatogonia/spermatocytes were observed to have numerous MT-nanotubes (Fig. 5 c-d, Extended Data Fig. 7e), suggesting that Dpp is necessary and sufficient to induce or stabilize MT-nanotubes in the neighboring germ cells. In turn, MT-nanotubes may promote selective ligand-receptor interaction between hub and GSCs, leading to spatially-confined self-renewal (Fig. 5e).
Fig. 5. Dpp signaling is necessary and sufficient for MT-nanotube formation.
a, b) Quantification of MT-nanotube thickness and length in GSCs of indicated genotypes. Each scored value is plotted as an dot. Red line indicates average value and standard deviations. Indicated numbers of nanotubes (Extended Data Table 1) from 2≤ independent crosses were scored for each genotypes. P values from t-test are provided as *P ≤ 0.05; **P ≤ 0.01; *** P ≤ 0.001; n.s.: non-significant (P > 0.05). c, d) MT-nanotube formation in absence (c) or presence (d) of Dpp expression in somatic cyst cells. c’, d’) Magnified images of squared regions of c, d. Arrowheads indicate ectopic MT-nanotubes. Hub is indicated by the asterisk. Bar: 10µm. e) Model. Dpp induces MT-nanotube formation, and receptor-ligand interaction occurs at the surface of MT-nanotubes, leading to signaling activation in GSCs.
Our study shows that previously unrecognized structures, MT-nanotubes, extend into the hub to mediate Dpp signaling. We propose that MT-nanotubes form a specialized cell surface area, where productive ligand-receptor interaction occurs. In this manner, only GSCs can access the source of highest ligand concentration in the niche via MT-nanotubes, whereas GBs do not experience the threshold of signal transduction necessary for self-renewal, contributing to the short-range nature of niche signaling. In summary, the results reported here illuminate a novel mechanism by which the niche specifies stem cell identity in a highly selective manner.
Online-only Methods
Fly Husbandry and Strains
All fly stocks were raised on standard Bloomington medium. The following fly stocks were used: 10XUAS-IVS-myr::GFP (BDSC32197), upd-gal4 (BDSC26796), UAS-GFP -αtub- (BDSC7253 or BDSC7373); UAS-dpp-GFP (BDSC53716); UAS-mCherry (BDSC35787) and hs-bam (BDSC24636) were obtained from Bloomington Stock Center. UAS-TIPF19; UAS-tkv-mCherry18; dpp-lexA (LHG)23; lexAop-dpp23; UAS-shits,18; UAS-diaRNAi,18 and UAS-tkvDN2dGSK-3D218 are generous gifts from Thomas Kornberg and Sougata Roy. dad-lacZ (FBti0009617) is a kind gift from Ting Xie. UAS-tkv-GFP transgene22 was a kind gift from Avidal Rodal. tkv-GFP protein trap line (CPTI-002487) is a kind gift from Brian McCabe. dpp loss of function alleles (dpphr4 and dpphr56)24,25 are kind gifts from Allan C. Spradling and Theodor E. Haerry, respectively. oseg2452, a null allele of oseg2, is a kind gift from Avidor-Reiss, T)26. klp10A24 null clones were generated by FLP-FRT-mediated removal of the rescue transgene in the background of klp10A null mutation on the X chromosome: klp10A24/y; klp10A P[acman]BAC (CH322-03M08), 42DFRT/histoneGFP, 42DFRT; hs-flp-MKRS/TM2. klp10A24 (FBal0280190) is a kind gift from Kim S. McKim27. P[acman]BAC (CH322-03M08) transgenic flies were generated using strain BDSC24483 by PhiC31 integrase-mediated transgenesis (BestGene, Inc.). Flies were heat-shocked at 37°C for 1 hour twice a day for 3 days and dissected after indicated time.
RNAi screening of candidate genes for MT-nanotube morphology/function was performed by driving UAS-RNAi constructs under the control of nos-gal4 (see below for validation method). Control crosses for RNAi screening were designed with matching gal4 and UAS copy number using TRiP background stocks (Bloomington Stock Center BDSC36304 or 35787). Expression of Dpp under the dpp-lexA (LHG) driver or tj-lexA driver (Bloomington Stock Center, BDSC54786) with tub-gal80ts (denoted as dpp-lexAts or tj-lexAts, respectively) was performed by culturing flies at 18°C to avoid lethality during development and shifted to 29°C upon eclosion for 24 hours before analysis. For shits expression, nos-gal4 > UAS-shits flies cultured at 18°C were shifted to 29°C upon eclosion for 24 hours before analysis. dpphr56/CyO; nos-gal4, UAS-GFP-αtub females were crossed with dpphr4/SM6 males at permissive temperature (18°C) and shifted to restrictive temperature (29°C) upon eclosion for 24 hours before analysis. nos-gal4ts (see below for transgenene construction) was used to achieve temporal control of UAS-tkv-mCherry to obtain similar expression level to dpp-lexAts > LexAop-dpp-GFP for co-localization analysis and quantification of Tkv-GFP puncta. Temperature shift (29°C) was performed upon eclosion for 72 hours before analysis. Expression of UAS-dome-EGFP28 (a kind gift from Stéphane Noselli) was performed at 18°C with nos-gal4 without VP16 (see below for transgene construction). Other fly crosses were performed at 25°C. Control experiments were conducted with matching temperature-shift schemes. For clonal expression of Tkv-mCherry and GFP-αTub, hs-FLP; nos-FRT-stop-FRT-gal4, UAS-GFP29 females were crossed with UAS-tkv-mCherry, UAS-GFP-αtub males and heat shocked at 37°C for 20min and observed 24hours after heat shock. A strong tkvRNAi (TRiP.HMS02185, Bloomington Stock Center BDSC40937) lead to complete loss of germ cells, while a weak knockdown (TRiP.GL01538, Bloomington Stock Center BDSC43194) maintained germ cells partially and was utilized for this study. Other stocks utilized in this study are listed in Extended Data Table 1.
Transgene construction
For constructions of UAS-dlic-GFP, UAS-dlic-VN and UAS-klp10A-VN, open reading flames were amplified from whole testis cDNA pool using polymerase chain reaction (PCR) with following primer pairs: For dlic: 5’-ctagatctctcaaaatggcgatgaacagtgggacgcaa-3’ and 5’-aactcgagacactcactctgcgacatgtcaattttcacac-3’. These primers amplify BglII-Kozak sequence-dlic-XhoI fragment. For klp10A: 5’-ctagatctctcaaaatggacatgattacggtgg-3’ and 5’-aactcgagacgcttgccattcggcgaattg-3’. These primers amplify BglII-Kozak sequence-klp10A-XhoI fragment. (BglII and XhoI sites are indicated by underline.) Amplified fragments were sequenced for validation and subcloned into BglII/XhoI sites of pUAST-EGFP-attB29 or pUAST-VenusN-attB vector (Containing N-terminal half portion of Venus instead of GFP). pUAST-VenusN-attB vector was constructed as follows. N-terminal half portion of Venus cDNA was amplified using primers, XhoI (underlined)-RSIAT (linker peptide, lower case)-Venus-F; 5’-AACTCGAGagatccattgcgaccATGGTGAGCAAGGGCGA-3’ and KpnI (underlined)-Venus-R; 5’-TCGGTACCTTAGGTGATATAGACGTTGTGGCTGATGTAGT-3’ and subcloned into XhoI/KpnI sites of pUAST-attB vector30. Transgenic flies were generated using strain BDSC24749 by PhiC31 integrase-mediated transgenesis (BestGene, Inc.). UAS-dlic-VN and UAS-klp10A-VN were used when GFP fluorescent was not necessary or undesirable. UAS-klp10ARNAi (dsRNA HMS00920) target sequence is within 5’ UTR of the gene and is not present in UAS-klp10A-VN construct, thus this transgene was used to rescue RNAi induced phenotypes (Extended Data Table 1).
To construct nos-gal4 without VP16, Scer\GAL4 cDNA was amplified from the pG4PN-2 vector (a kind gift from Cheng-Yu Lee) using the following primers: NdeI (underlined)-Kozak-gal4 ORF-F: 5’-aagcatatggtcaacatgaagctactgtcttctatc-3’ and EcoRI (underlined)-gal4 ORF-R: 5’-tactcgaattcttactctttttttgggtttgg-3’. NheI-BamHI flanked the 3.13-kb fragment from pCSpnosFGVP (containing the nanos 5’UTR-ATG (NdeI-start codon); the gal4-VP16-nanos 3’ UTR, a kind gift from Elizabeth R. Gavis) was subcloned into the NheI-BamHI site of the pUAST-attB vector30. NdeI-EcoRI flanking gal4-VP16 cassette was replaced by the NdeI-EcoRI-digested PCR fragment of Scer\GAL4 cDNA. Transgenes were introduced into the BDSC24482 strain using PhiC31 integrase-mediated transgenesis (BestGene Inc.). nos-gal4 without VP16 is used in combination with temperature-sensitive gal80 (tubulin-gal80ts) denoted as nos-gal4ts to distinguish it from nos-gal4-VP1631, which has been often referred to as nos-gal4.
Live imaging
For visualizing MT-nanotubes in unfixed samples, testes from newly eclosed flies (nos-gal4 > UAS-GFP-αtub) were dissected in 1ml of pre-warmed Schneider’s Drosophila medium supplemented with 10% fetal bovine serum and Glutamine-Penicillin-Streptomycin. Cytochalasin B (10µM, Sigma-Aldrich) or colcemid (250µM, Sigma-Aldrich) were added to the media and incubated at room temperature for 90 minutes. Hoechst 33342 (2µg/ml) were added as necessary and incubated at room temperature for 30minutes. Testes were washed twice with phosphate-buffered saline (PBS) prior to imaging. For MT-nanotube membrane visualization, testes were dissected in PBS and FM4-64FX Lipophilic Styryl Dye (5µg/ml, Molecular Probes) was added 1min prior to analysis. Imaging was performed in the presence of dye within 15min.
For time-lapse live imaging, testes were placed on a drop of medium on a microscope slide with coverslip spacers on both edges, and another coverslip was placed on top. Time course images of the areas around hub were taken once every minute or every 5 minutes for 60 minutes using a Zeiss LSM700 confocal microscope with a 40× oil immersion objective (1.4NA). 4D data sets (xyzt) were processed using Image J32.
Immunofluorescent Staining
Testes were dissected in PBS and fixed in 4% formaldehyde in PBS for 30 minutes. To preserve MT-nanotubes during fixation, taxol (1µM) was added to 4% formaldehyde/PBS solution. For anti-α-Tubulin staining, testes were fixed in 90% methanol, 3% formaldehyde for 10 min at −80°C. Fixed testes were briefly rinsed for 3 times and permeabilized in PBST (PBS + 0.3% TritonX-100) at room temperature for 1 hour, followed by incubation with primary antibody in 3% bovine serum albumin (BSA) in PBST at 4°C overnight. Samples were washed three times for 20 minutes in PBST, incubated with secondary antibody in 3% BSA in PBST at room temperature for 2 to 4 hours, and then washed for 60 minutes (three times 20 minutes) in PBST. Samples were then mounted using VECTASHIELD with 4',6-diamidino-2-phenylindole (DAPI). The primary antibodies used were as follows: mouse anti-γ-tubulin (1:500; GTU-88, Sigma), rabbit anti-β-galactosidase (1:500, Abcam), rabbit anti-Klp10A (1:2000, a kind gift from David Sharp33), rabbit anti-Ser453 and Ser455 phosphorylated Mad (1:1000, a kind gift from Ed Laufer), rat anti-Vasa (1:20; developed by A. Spradling and D. Williams), mouse anti-Fasciclin III (7G10, 1:40, developed by C. Goodman), mouse anti-Armadillo (N2 7A1, 1:20, developed by E. Wieschaus) and mouse anti-α-Tubulin 4.3 (1:50; developed by C. Walsh) were obtained from Developmental Studies Hybridoma Bank (DSHB). Guinea pig anti-STAT92E was generated using the synthetic peptide Ac-CSGTPHHAQESMQLGNGDFGMADFDTITNFENF-amide (Covance) and used at a dilution of 1:2000. STAT92E antibody was validated by immunofluorescent staining of nos-gal4ts > stat92ERNAi (Bloomington stock center, BDSC35600 and BDSC33637, data not shown). Guinea pig anti-Klp10A was generated as described previously33 (Covance) and used at a dilution of 1:2000. AlexaFluor-conjugated secondary antibodies were used at a dilution of 1:400. Images were taken using a Zeiss LSM700 confocal microscope with a 40× oil immersion objective (NA=1.4), or a Leica TCS SP8 confocal microscope with a 63× oil-immersion objective (NA=1.4) and processed using Image J32 and Adobe Photoshop software. 3d rendering was performed by imaris software.
Mosaic analysis and clonal knockdown
oseg2452 homozygous clone were generated by FLP/FRT mediated mitotic recombination34. Adult hs-flp, tub-gal4, UAS-GFP;; tub-gal80, 2AFRT/oseg2452, 2AFRT males were heat-shocked at 37°C for 1 hour twice a day for 3 days. hs-flp, tub-gal4, UAS-GFP;; tub-gal80, 2AFRT/2AFRT flies were used as controls. Testes were dissected indicated time after clone induction. The number of testes containing any GFP-positive oseg2452 homozygous clones was determined. For RNAi clonal analysis, hs-flp; nos-FRT-stop-FRT-gal4, UAS-GFP29 with UAS-che-13RNAi, UAS-osm6RNAi or UAS-klp10ARNAi flies were heat-shocked at 37°C for 30min. Testes were dissected at indicated time after clone induction. The percentage of GFP-positive GSC was determined. The means ± standard deviations from 2≤ independent experiments were plotted to the graph.
Quantification of pMad and STAT92E intensities
For pMad quantification, integrated intensity within the GSC nuclear region was measured for anti-pMad staining and divided by the area. To normalize the staining condition, data were further normalized by the average intensities of pMad from 4 cyst cells (CCs) in the same testes, and the ratio of relative intensities were calculated as each GSC/average CC. For STAT92E quantification, intensity within the GSC nuclear region was measured for anti-STAT92E staining and divided by the area. Data were normalized by DAPI signal intensities. The means ± standard deviations were plotted to the graph for each genotype.
Quantitative RT-PCR to validate RNAi-mediated knockdown of genes
nos-gal4 and c587-gal4 double driver females were crossed with males of indicated RNAi lines. Testes from 50 male progenies, age 0–2 days old, were collected and homogenized by pipetting in TRIzol Reagent (Invitrogen) and RNA was extracted following manufacturer's instruction. 1µg of total RNA was reverse transcribed to cDNA using SuperScript® III First-Strand Synthesis SuperMix (Invitrogen) with Oligo (dT)20 Primer. qPCR was performed, in triplicate, using Cybergreen Applied Biosystems Gene Expression Master Mix on an CFX96 Real-Time PCR Detection System (Bio-Rad). Control primer for αtub84B (5’-TCAGACCTCGAAATCGTAGC-3’/5’-AGCAGTAGAGCTCCCAGCAG-3’) and experimental primer for oseg1 (5’-TGATCATTCAGCACCTGATCTC-3’/5’-CGCCAGTCGATTCCGATAAA-3’), oseg2 (5’-TCTGAACGAGCGAGGAAATG-3’/5’-CCACTGGTCATCCTGCTAATC-3’), oseg3 (5’-ACTGGTTCTCGCAGGTAAAG-3’/5’-TAATGCCTCGCCAAGTGATAG-3’), osm6 (5’-CTTCCATCCCAAGGAGTGTATC-3’/5’- CTTCTCGTCACTGAAATCGTAGT-3’), che-13 (5’-GATGGAGCAGGAGCTGAAA-3’/5’-GGTCGGTGGTTTGGTTCT-3’), tkv (5’-GCCACGTCTCATCAACTCAA-3’/5’-CTTTGCACCAGCAATGGTAATC-3’) were used. Relative Quantitation was performed using the comparative CT method (ABI manual).
Statistical analysis and graphing
Statistical analysis and graphing were performed using Microsoft Excel 2010 or GraphPad prism 6 software. Data are shown as means ± standard deviation. The P-value (two-tailed Student’s t-test) is provided for comparison with the control shown as *P ≤ 0.05; **P ≤ 0.01; *** P ≤ 0.001; n.s.: non-significant (P > 0.05). MT-nanotube orientation was measured as the angle between the two lines using image J32: one formed by connecting germ cell center to hub center and the other formed by MT-nanotube. Each angle was plotted to Wind Rose graph by Origin 9.1 software (OriginLabs).
Extended Data
Extended Data Fig. 1. MT-nanotubes are MT-based structures that form in a cell cycle dependent manner.
a-c) Representative images of MT-nanotubes visualized by GFP-αTub (nos > GFP-αtub) after 90min ex vivo treatment of mock (a, DMSO), colcemid (b) or cytochalasin B (c). d) Thickness and length of MT-nanotubes after mock (DMSO), colcemid or cytochalasin B treatment. Each scored value is plotted as an open circle. Red line indicates average value with standard deviation. n indicates the number of MT-nanotubes scored from > 3 testes for each data point. e) Representative images of MT-nanotubes in each cell cycle stage visualized by GFP-αTub. Panels e’-e’’’ show magnified images of GSCs from panel e representing various stages of the cell cycle. e’) G1-S phase (prior to the completion of the cytokinesis). e”) G2 phase. e’’’) mitosis. f, g) Frequency of MT-nanotubes/GSC after mock (DMSO), colcemid or cytochalasin B treatment (f) or during cell cycle (g). N indicates the number of GSCs scored from > 10 testes from 3 independent experiments for each data point. h) Frames from a time-lapse live imaging of a MT-nanotube visualized by GFP-αTub. GSC in anaphase at 0 min is indicated by red dotted circle, which undergoes cell division and grows MT-nanotubes (arrowheads) at 40 min (See supplementary video 1). MT-nanotubes typically formed during telophase to early S phase of the next cell cycle, within an hour after mitotic entry (95.2%, N=21GSCs) from 3 independent experiments. i) An example of a GSC that does not have the centrosome (arrows) at the base of the MT-nanotubes. MT-nanotubes are indicated by arrowheads. Centrosomes are indicated by arrows. Hub is indicated by the asterisk (*). P values from t-test are provided as *P ≤ 0.05; **P ≤ 0.01; *** P ≤ 0.001. Bar: 10µm.
Extended Data Fig. 2. IFT proteins localize to MT-nanotubes.
(a-c) Examples of MT-nanotubes in wild type (a), oseg2RNAi (b) and klp10aRNAi (c) testes. nos-gal4 > GFP-αtub was used. Panels a-c are magnified views of squared area in a’-c’, showing examples of measuring length (L) and diameter (D, the base of the MT-nanotubes). d) An example of MT-nanotube stained by anti-Klp10A antibody in WT testis. e) Validation of anti-Klp10A antibody, showing that klp10A mutant clones (arrowheads and dotted circles) have completely lost the staining 3 days after clone induction. (f-i) Examples of testis apical tips expressing Oseg1-GFP (f), Oseg2-GFP (g), Oseg3-GFP (h), GFP-Dlic (i) driven by nos-gal4. Arrowheads indicate MT-nanotubes illuminated by anti-Klp10A staining. GSCs are indicated by blue lines or yellow dotted circles. Hub is indicated by the asterisk (*). Bar: 10µm.
Extended Data Fig. 3. Tkv-mCherry or mCherry colocalize with Tkv-GFP in the hub.
a) An apical tip of the testis expressing Tkv-GFP in germ cells (nos-gal4 > tkv-GFP). Hub is indicated by broken lines. b) An apical tip of the testis expressing GFP in germ cells (nos-gal4 > GFP). c) Fully functional Tkv-GFP protein trap shows punctate pattern within the hub area. d) Frames from a time-lapse live observation of Tkv-mCherry puncta (arrowheads) moving along a MT-nanotube. Hub is indicated by the asterisk (*). e) mCherry and Tkv-GFP expressed in germ cells (nos-gal4 > UAS-tkv-GFP, UAS-mCherry) colocalize in the hub (arrowheads). f) Tkv-mCherry and Tkv-GFP expressed together in germ cells (nos-gal4 > UAS-tkv-GFP, UAS-tkv-mCherry) colocalize in the hub (arrowheads). g) An apical tip of the testis expressing Dome-GFP in germ cells (nos-gal4 > dome-GFP raised at 18°C to reduce the expression level). h, i) Tkv-GFP localization in control (h, DMSO) or colcemid (i) treatment, revealing Tkv-GFP’s localization to the GSC cortex upon perturbation of MT-nanotubes. Hub is indicated by dotted hemi or full-circle. Bar: 10µm.
Extended Data Fig. 4. Effect of RNAi-mediated knockdown of IFT components on Dpp signaling and cytoplasmic microtubules.
a, b) Dad-LacZ staining was undetectable in control GSCs (a) but was enhanced in klp10ARNAi (b) GSCs. c) Quantification of pMad intensity in the 2 cell- or 4 cell-spermatogonia (SG) of indicated genotypes. Graph shows average value and standard deviations. n=30 GSCs were scored from 10≤ testes from 2≤ independent crosses for each data point. d-j) Cytoplasmic microtubule patterns stained with anti-αTubulin antibody upon RNAi-mediated knockdown of indicated genes (d-h) or colcemid treatment.for 90min (i). In control as well as upon knockdown of IFT-B components, cytoplasmic MTs, visible as fibrous cytoplasmic patterns, were not visibly affected, whereas colcemid treatment disrupted cytoplasmic MTs. klp10A knockdown led to hyper stabilization of cytoplasmic MTs (h). Hub is indicated by the asterisk (*). P values from t-test are provided as n.s.: non-significant (P > 0.05). Bar: 10µm.
Extended Data Fig. 5. klp10A mutant clones do not show a competitive advantage in GSC maintenance.
a) Maintenance of klp10ARNA GSC clones. b) Maintenance of klp10A24 null clones. The number of control GSC clones (+/+, determined by lack of GFP and the number of klp10A24 null GSC clones (−/−, determined by anti-Klp10A staining) were scored. c) Maintenance of GFP-positive GSC clones from the cross of 42DFRT X histoneGFP, 42DFRT; hs-flp-MKRS/TM2 as a control for klp10A24 null clones in b). GFP-positive GSC clones did not decrease compared with day3), excluding the possibility that klp10A24 null GSC clones were lost due to unrelated mutation(s) on the histoneGFP, 42DFRT chromosome. (a-c) Indicated numbers of GSCs were scored for each data point from 2≤ independent crosses. d) A representative image of a testis with klp10A24 null clones. klp10A24 null germ cells determined by anti-Klp10A staining were encircled by white broken lines. Hub is indicated by the asterisk (*). Bar: 10μm. Average value and standard deviations are plotted in graphs. P values from t-test are provided as *P ≤ 0.05; **P ≤ 0.01; *** P ≤ 0.001; n.s.: non-significant (P > 0.05).
Extended Data Fig. 6. STAT92E level is not affected by modulation of MT-nanotube formation.
a-c) Double staining of STAT92E and phospho-Mad (pMad) in control (a), klp10ARNAi (b) and oseg2RNAi (c) testes. Hub is indicated by the asterisk (*). GSCs (and GBs that are still connected to GSCs) are circled by dotted line. d) Quantification of STAT92E intensity. n=30 GSCs from > 5 testes from 2 independent crosses were scored for each data point. Average value and standard deviations are shown. P values from t-test are provided as n.s.: non-significant (P > 0.05).
Extended Data Fig. 7. Dpp pathway is required for the MT-nanotube formation.
dpphr56/dpphr4 (a) or dpphr56/CyO (b) testes expressing GFP-αTub in germ cells (nos-gal4 > GFP-αtub) at restrictive temperature. c, d) MT-nanotube formation upon knockdown (c) or overexpression (d) of Tkv visualized by GFP-αTub. e) Ectopic MT-nanotube formation in SGs upon expression of Dpp in somatic cyst cells. e’) Magnified view of a squared region of e. Arrowheads indicate ectopic MT-nanotubes, Hub is indicated by the asterisk. Bar: 10µm.
Extended Data Table 1. Effects of primary cilium or cytoneme genes on MT-nanotube formation.
UAS-transgenes were driven by nos-gal4 with UAS-GFP-αtub.
|
Transgenes |
Sources, references |
Thickness at the base (µm)† (number of nanotube scored) |
Length (µm)† (number of nanotube scored) |
MT-nanotube number /GSC (number of GSC scored from n>7 testes) |
pMad level GSC/CC †, ‡ |
RNAi validation |
|---|---|---|---|---|---|---|
| UAS-GFP-αtub§ | Bloomington stock center35 | 0.432 (51) | 3.32 (82) | 0.822 (584) | 0.93 (34) | |
| UAS-Dlic-VN | This study | ND | ND | ND | 1.01* (15) | |
| UAS-DlicRNAi KK10W7892 | VDRC | 0.412 (17) | 1.91* (15) | 0.519 (42)↓ | 0.534*** (15) | |
| UAS-klp10A-VN | This study | 0.398 (39) | 2.26* (21) | 0.490 (79)↓ | 0.551*** (15) | |
| UAS-klp10ARNAi TRiP.HMS00920 | Bloomington stock center | 0.827*** (105) | 3.7 (65) | 0.776 (58) | 1.28** (40) | IHC |
| UAS-klp10ARNAi with UAS-klp10A-VN | RNAi rescue‖ | 0.482 (40) | 4.21* (40) | 0.960 (75) | 0.781 (15) | |
| UAS-oseg1RNAi KK101551 | VDRC | 0.569 (16) | 3.42 (15) | 0.536 (41) | 0.722 (15) | qPCR 0.57* |
| UAS-oseg2RNAi GD8122 | VDRC36 | 0.473 (25) | 1.60*** (48) | 0.194 (72)↓ | 0.448*** (44) | qPCR 0.68* |
| UAS-oseg3RNAi KK100864 | VDRC | 0.552 (15) | 2.51 (15) | 0.663 (66) | 0.707 (15) | qPCR 0.19*** |
| UAS-oseg1-GFP | Avidor-Reiss, T26 | ND | ND | ND | 0.832 (15) | |
| UAS-oseg2-GFP | Avidor-Reiss, T26 | 0.482 (32) | 3.99 (309) | 0.727 (39) | 1.14* (15) | |
| UAS-oseg3-GFP | Avidor-Reiss, T26 | 0.501 (15) | 3.66 (15) | 0.750 (37) | 0.911 (15) | |
| UAS-oseg4-GFP | Avidor-Reiss, T26 | ND | ND | ND | 0.701 (15) | |
| UAS-oseg5-GFP | Avidor-Reiss, T26 | 0.255* (15) | 2.62 (15) | 0.333 (50)↓ | 0.458*** (15) | |
| UAS-osm6RNAi GD24068 | VDRC | 0.477 (15) | 2.01* (17) | 0.331 (51)↓ | 0.429*** (15) | qPCR 0.72** |
| UAS-che-13RNAi GD5096 | VDRC | 0.494 (15) | 2.16* (33) | 0.306 (80)↓ | 0.449*** (30) | qPCR 0.20*** |
| dpphr56/dpphr4 (29°C 24hr) | Haerry, TE, Spradling, AC24, 25 | 0.173* (20) | 4.30 (15) | 0.0614 (244)↓ | ND | |
| dpphr56/dpphr4 (18°C) | Haerry, TE, Spradling, AC24, 25 | 0.412 (15) | 3.02 (15) | 0.545 (33) | ND | |
| UAS-tkv-GFP | Rodal, A22 | 0.378 (21) | 4.89* (15) | 0.784 (51) | 1.25** (15) | |
| UAS-tkvDN (2d-GSK-3D2) | Roy, S18 | 0.779** (34) | 3.67 (35) | 0.649 (114) | 0.679* (15) | |
| UAS-tkvRNAi TRiP.HMS02185 | Bloomington stock center | 0.580 (15) | 1.16** (15) | 0.234 (90)↓ | 0.463** (15) | qPCR 0.76* |
| UAS-capsDN | Roy, S18 | 0.581 (15) | 3.71 (15) | 0.850 (60) | 0.714 (15) | |
| UAS-diaRNAi | Roy, S18 | 0.407 (15) | 3.34 (15) | 0.667 (30) | 0.991 (15) | |
| UAS-shits (29°C 24hr) | Roy, S18 | 0.536 (15) | 3.22 (15) | 0.632 (48) | 0.894 (15) | |
| UAS-shits (18°C) | Roy, S18 | 0.481 (15) | 3.78 (15) | 0.701 (44) | 0.811 (15) | |
ND: Not determined. For all data points, data were obtained from 2≤independent crosses.
15≤ randomly selected MT-nanotubes or 15≤GSCs from 7< testes were scored.
See method for quantification.
Control.
See method for rescue experiment design.
P values from t-test are provided as *P ≤ 0.05; **P ≤ 0.01; *** P ≤ 0.001; n.s.: non-significant (P>0.05). Arrows were shown based on the significances (P ≤ 0.05).
Supplementary Material
Acknowledgements
We thank Thomas Kornberg, Sougata Roy, Tomer Avidor-Reiss, Ed Laufer, Avidal Rodal, David Sharp, Stéphane Noselli, Allan C. Spradling, Theodor E. Haerry, Elizabeth R. Gavis, Cheng-Yu Lee, Ting Xie, Brian McCabe, Kim S. McKim, Bloomington Drosophila Stock Center, Vienna Drosophila Resource Center, and the Developmental Studies Hybridoma Bank for reagents, Sougata Roy, Thomas Kornberg, Grace Boekhoff-Falk and David King for comments and advice, Kate Luby-Phelps, Abhijit Bugde and Melih Acar for advice for imaging/image data processing, and the Yamashita and Buszczak lab members for discussion. The research in the Yamashita laboratory is supported by Howard Hughes Medical Institute. YMY is supported by MacArthur Foundation.
Footnotes
Author Contributions
MI conceived the project, and executed experiments. All authors designed experiments, analyzed the data, wrote and edited the manuscript.
Competing financial interest
The authors declare no competing financial interests.
References
- 1.Morrison SJ, Spradling AC. Stem cells and niches: mechanisms that promote stem cell maintenance throughout life. Cell. 2008;132:598–611. doi: 10.1016/j.cell.2008.01.038. [DOI] [PMC free article] [PubMed] [Google Scholar]
- 2.Tulina N, Matunis E. Control of stem cell self-renewal in Drosophila spermatogenesis by JAK-STAT signaling. Science. 2001;294:2546–2549. doi: 10.1126/science.1066700. [DOI] [PubMed] [Google Scholar]
- 3.Kiger AA, Jones DL, Schulz C, Rogers MB, Fuller MT. Stem cell self-renewal specified by JAK-STAT activation in response to a support cell cue. Science. 2001;294:2542–2545. doi: 10.1126/science.1066707. [DOI] [PubMed] [Google Scholar]
- 4.Shivdasani AA, Ingham PW. Regulation of Stem Cell Maintenance and Transit Amplifying Cell Proliferation by TGF-β Signaling in Drosophila Spermatogenesis. Curr. Biol. 2003;13:2065–2072. doi: 10.1016/j.cub.2003.10.063. [DOI] [PubMed] [Google Scholar]
- 5.Kawase E, Wong MD, Ding BC, Xie T. Gbb/Bmp signaling is essential for maintaining germline stem cells and for repressing bam transcription in the Drosophila testis. Development. 2004;131:1365–1375. doi: 10.1242/dev.01025. [DOI] [PubMed] [Google Scholar]
- 6.Yamashita YM, Jones DL, Fuller MT. Orientation of asymmetric stem cell division by the APC tumor suppressor and centrosome. Science (80-.) 2003;301:1547–1550. doi: 10.1126/science.1087795. [DOI] [PubMed] [Google Scholar]
- 7.Davis DM, Sowinski S. Membrane nanotubes: dynamic long-distance connections between animal cells. Nat. Rev. Mol. Cell Biol. 2008;9:431–436. doi: 10.1038/nrm2399. [DOI] [PubMed] [Google Scholar]
- 8.Ramírez-Weber Fa, Kornberg TB. Cytonemes: cellular processes that project to the principal signaling center in Drosophila imaginal discs. Cell. 1999;97:599–607. doi: 10.1016/s0092-8674(00)80771-0. [DOI] [PubMed] [Google Scholar]
- 9.Avasthi P, Marshall WF. Stages of ciliogenesis and regulation of ciliary length. Differentiation. 2012;83:S30–S42. doi: 10.1016/j.diff.2011.11.015. [DOI] [PMC free article] [PubMed] [Google Scholar]
- 10.Pedersen LB, Rosenbaum JL. Intraflagellar transport (IFT) role in ciliary assembly, resorption and signalling. Curr Top Dev Biol. 2008;85:23–61. doi: 10.1016/S0070-2153(08)00802-8. [DOI] [PubMed] [Google Scholar]
- 11.Goetz SC, Anderson KV. The primary cilium: a signalling centre during vertebrate development. Nat. Rev. Genet. 2010;11:331–344. doi: 10.1038/nrg2774. [DOI] [PMC free article] [PubMed] [Google Scholar]
- 12.Perrone CA, et al. A novel dynein light intermediate chain colocalizes with the retrograde motor for intraflagellar transport at sites of axoneme assembly in chlamydomonas and Mammalian cells. Mol. Biol. Cell. 2003;14:2041–2056. doi: 10.1091/mbc.E02-10-0682. [DOI] [PMC free article] [PubMed] [Google Scholar]
- 13.Kobayashi T, Tsang WY, Li J, Lane W, Dynlacht BD. Centriolar kinesin Kif24 interacts with CP110 to remodel microtubules and regulate ciliogenesis. Cell. 2011;145:914–925. doi: 10.1016/j.cell.2011.04.028. [DOI] [PubMed] [Google Scholar]
- 14.Iomini C, Li L, Esparza JM, Dutcher SK. Retrograde intraflagellar transport mutants identify complex A proteins with multiple genetic interactions in Chlamydomonas reinhardtii. Genetics. 2009;183:885–896. doi: 10.1534/genetics.109.101915. [DOI] [PMC free article] [PubMed] [Google Scholar]
- 15.Tran PV, et al. THM1 negatively modulates mouse sonic hedgehog signal transduction and affects retrograde intraflagellar transport in cilia. Nat. Genet. 2008;40:403–410. doi: 10.1038/ng.105. [DOI] [PMC free article] [PubMed] [Google Scholar]
- 16.Qin J, Lin Y, Norman RX, Ko HW, Eggenschwiler JT. Intraflagellar transport protein 122 antagonizes Sonic Hedgehog signaling and controls ciliary localization of pathway components. Proc. Natl. Acad. Sci. U.S.A. 2011;108:1456–1461. doi: 10.1073/pnas.1011410108. [DOI] [PMC free article] [PubMed] [Google Scholar]
- 17.Cortellino S, et al. Defective ciliogenesis, embryonic lethality and severe impairment of the Sonic Hedgehog pathway caused by inactivation of the mouse complex A intraflagellar transport gene Ift122/Wdr10, partially overlapping with the DNA repair gene Med1/Mbd4. Dev. Biol. 2009;325:225–237. doi: 10.1016/j.ydbio.2008.10.020. [DOI] [PMC free article] [PubMed] [Google Scholar]
- 18.Roy S, Huang H, Liu S, Kornberg TB. Cytoneme-mediated contact-dependent transport of the Drosophila decapentaplegic signaling protein. Science. 2014;343:1244624. doi: 10.1126/science.1244624. [DOI] [PMC free article] [PubMed] [Google Scholar]
- 19.Michel M, Raabe I, Kupinski AP, Perez-Palencia R, Bokel C. Local BMP receptor activation at adherens junctions in the Drosophila germline stem cell niche. Nat Commun. 2011;2:415. doi: 10.1038/ncomms1426. [DOI] [PubMed] [Google Scholar]
- 20.Goshima G, Vale RD. Cell cycle-dependent dynamics and regulation of mitotic kinesins in Drosophila S2 cells. Mol. Biol. Cell. 2005;16:3896–3907. doi: 10.1091/mbc.E05-02-0118. [DOI] [PMC free article] [PubMed] [Google Scholar]
- 21.Schulz C, et al. A misexpression screen reveals effects of bag-of-marbles and TGF beta class signaling on the Drosophila male germ-line stem cell lineage. Genetics. 2004;167:707–723. doi: 10.1534/genetics.103.023184. [DOI] [PMC free article] [PubMed] [Google Scholar]
- 22.Dudu V, et al. Postsynaptic Mad Signaling at the Drosophila Neuromuscular Junction. Curr. Biol. 2006;16:625–635. doi: 10.1016/j.cub.2006.02.061. [DOI] [PubMed] [Google Scholar]
References for Online-only Methods
- 23.Yagi R, Mayer F, Basler K. Refined LexA transactivators and their use in combination with the Drosophila Gal4 system. Proc. Natl. Acad. Sci. U.S.A. 2010;107:16166–16171. doi: 10.1073/pnas.1005957107. [DOI] [PMC free article] [PubMed] [Google Scholar]
- 24.Wharton K, Ray RP, Findley SD, Duncan HE, Gelbart WM. Molecular Lesions Associated With Alleles of decapentaplegic Identify Residues Necessary for TGF-{beta}/BMP Cell Signaling in Drosophila melanogaster. Genetics. 1996;142:493–505. doi: 10.1093/genetics/142.2.493. [DOI] [PMC free article] [PubMed] [Google Scholar]
- 25.Xie T, Spradling AC. decapentaplegic Is Essential for the Maintenance and Division of Germline Stem Cells in the Drosophila Ovary. Cell. 1998;94:251–260. doi: 10.1016/s0092-8674(00)81424-5. [DOI] [PubMed] [Google Scholar]
- 26.Avidor-Reiss T, et al. Decoding Cilia Function. Cell. 2004;117:527–539. doi: 10.1016/s0092-8674(04)00412-x. [DOI] [PubMed] [Google Scholar]
- 27.Radford SJ, Harrison AM, McKim KS. Microtubule-depolymerizing kinesin KLP10A restricts the length of the acentrosomal meiotic spindle in Drosophila females. Genetics. 2012;192:431–440. doi: 10.1534/genetics.112.143503. [DOI] [PMC free article] [PubMed] [Google Scholar]
- 28.Ghiglione C. The Drosophila cytokine receptor Domeless controls border cell migration and epithelial polarization during oogenesis. Development. 2002;129:5437–5447. doi: 10.1242/dev.00116. [DOI] [PubMed] [Google Scholar]
- 29.Salzmann V, Inaba M, Cheng J, Yamashita YM. Lineage tracing quantification reveals symmetric stem cell division in drosophila male germline stem cells. Cell. Mol. Bioeng. 2013;6:441–448. doi: 10.1007/s12195-013-0295-6. [DOI] [PMC free article] [PubMed] [Google Scholar]
- 30.Bischof J, Maeda RK, Hediger M, Karch F, Basler K. An optimized transgenesis system for Drosophila using germ-line-specific phiC31 integrases. Proc. Natl. Acad. Sci. U.S.A. 2007;104:3312–3317. doi: 10.1073/pnas.0611511104. [DOI] [PMC free article] [PubMed] [Google Scholar]
- 31.Van Doren M, Williamson AL, Lehmann R. Regulation of zygotic gene expression in Drosophila primordial germ cells. Curr Biol. 1998;8:243–246. doi: 10.1016/s0960-9822(98)70091-0. [DOI] [PubMed] [Google Scholar]
- 32.Rasband WS. ImageJ. Bethesda, MD: U.S. National Institutes Heal; 1997–2014. Avairable at hhtp://imagej.nih.gov/ij/ [Google Scholar]
- 33.Rogers GC, et al. Two mitotic kinesins cooperate to drive sister chromatid separation during anaphase. Nature. 2004;427:364–370. doi: 10.1038/nature02256. [DOI] [PubMed] [Google Scholar]
- 34.Xu T, Rubin GM. Analysis of genetic mosaics in developing and adult Drosophila tissues. Development. 1993;117:1223–1237. doi: 10.1242/dev.117.4.1223. [DOI] [PubMed] [Google Scholar]
References for Extended Data Table 1
- 35.Grieder NC, de Cuevas M, Spradling AC. The fusome organizes the microtubule network during oocyte differentiation in Drosophila. Development. 2000;127:4253–4264. doi: 10.1242/dev.127.19.4253. [DOI] [PubMed] [Google Scholar]
- 36.Kuzhandaivel A, Schultz SW, Alkhori L, Alenius M. Cilia-mediated hedgehog signaling in Drosophila. Cell Rep. 2014;7:672–680. doi: 10.1016/j.celrep.2014.03.052. [DOI] [PubMed] [Google Scholar]
Associated Data
This section collects any data citations, data availability statements, or supplementary materials included in this article.


