Abstract
The degree of polarization (uniformity) has attracted increased interest as a functional contrast in optical coherence tomography (OCT). However, its computation from a single polarization state suggests an ambiguity that is strongly dependent on a sample's orientation. We here propose an improved metric to present depolarization with respect to the optical system rather than the propagating field. Using numerical simulations and optical frequency domain imaging, we evaluate the conventional DOP(U) for different polarization states and compare its performance with the unambiguous depolarization index.
Polarization-sensitive (PS) optical-coherence tomography (OCT) enables depth-resolved imaging of the polarization properties of biological samples [1]. Recently developed polarization mixing techniques [2–4] enable the direct measurement of the depth-resolved Jones vector and Jones matrix [5]. The detected interferometric signal arises only from the component of the backscattered light that is coherently mixed with the reference beam of a fully polarized field. In contrast to the inherently coherent Jones formalism, the intensity-based Stokes domain encompasses partially coherent imaging thereby permitting depolarization properties to be investigated. Depolarization couples polarized light into unpolarized light due to a process associated with scattering, diattenuation, and retardance, which vary in space, time, and/or wavelength. In OCT, this information is only accessible indirectly through incoherent spatial averaging over a few speckle. To identify multiply scattered light, Adie et al. correlated a polarization state with a mean in its vicinity via spatial Stokes averaging [6]. Götzinger et al. extended this framework to formally provide a measure of depolarization through the degree of polarization uniformity (DOPU), which is closely related to the conventional degree of polarization (DOP) [7]. Although DOPU has recently attracted increased interest as a basis for functional contrast [6–9], its computation from a single-polarization state suggests an ambiguity that is strongly dependent on a sample's retardation, diattenuation, and depolarization axes. This inherent dependency can give rise to apparent image texture that may be misinterpreted as structure or composition variation within the sample. Indeed, DOP(U) are metrics that, to first order, characterize the depolarization of a partially coherent field and only to second order the depolarization properties of a sample. In this Letter, we propose the depolarization index as an improved metric to investigate depolarization with respect to an optical system rather than the propagating field. Using numerical simulations and optical frequency domain imaging (OFDI) [10], we demonstrate the advantage of the depolarization index by providing a robust measure of depolarization independent of a sample's orientation.
The degree of polarization, DOP = (1 − F/I2)1/2, is proportional to a positive-semidefinite quadratic form, F = I2–Q2–U2–V2, associated with a Stokes vector, S = (I Q U V)T. In the same way the degree of polarization of an optical field is determined, we can define the depolarization power or polarization power of an optical system. Our discussion follows directly the derivation by Gil and Bernabeu [11]. For an incident light beam of Stokes vector S, the Stokes vector of an outgoing beam is given by SA = MAS, where MA is the sample Müller matrix. The Müller matrix that describes the optical system in the reversed direction is related to MA as , where R = diag(1, 1, 1, −1) is a diagonal matrix. We consider a set of different, totally polarized Stokes vectors, Spi and Sni (i = 1, 2, 3), given by Sp1 = Q, Sp2 = U, Sp3 = V and Sn1 = −Q, Sn2 = −U, Sn3 = −V, where Q, U, V are vectors representing the three axes of the Poincaré sphere. Considering the direction A for the incident light beams, the Stokes vectors are given by and . The corresponding positive-semidefinite quadratic forms are then written as
| (1) |
When considering the reversed direction matrix, MB, we arrive at a similar expression for the quadratic forms denoted as and . The average of the forms for all i = 1, 2, 3, as well as , provides a new positive-semidefinite quadratic form, , written as
| (2) |
which is insensitive to the incoming polarization and propagation direction. Applying the same relation used to define the DOP, the depolarization index, DD, of the sample can then be written as
| (3) |
We note that DD is restricted to the limits 0 ≤ DD ≤ 1, where DD = 1 corresponds to a non-depolarizing medium and DD = 0 represents a total depolarizer.
The direct reciprocal polarization index, PD, can be derived if we consider an incident unpolarized light beam. For an output Stokes vector given by SA=MA(1 0 0 0)T= (m00 m10 m20 m30)T, the polarization index can be written by using the quadratic form associated with SA, , as
| (4) |
gives information on the polarization power of the sample in the direction corresponding to MA. Similarly, one can derive the polarization power for the reciprocal direction associated to MB. Only for a non-depolarizing sample is equal to , in which case the sample can be considered a total polarizer if [11].
To further highlight deficiencies obtained from DOP compared to DD, we present numerical simulations composed of the following formalism. A homogeneous Müller matrix can be written in differential form dS/dz = mS, where m = dM/dz M−1 is the SO(3,1) differential Müller matrix relating the change of the four-element Stokes vector along the propagation direction, z. Decomposition of m separates diattenuation and retardation, , from their associated uncertainties that describe depolarization, , with G = diag(1, −1, −1, −1) [12,13],
| (5) |
Here, τ1,2,3 are the birefringence coefficients for the three pairs of axes of the Poincaré sphere, τ4,5,6 represents diattenuation for light polarized in each of the three axes of the Poincaré sphere, ζ1−9 are the nine depolarization coefficients, and κ0 is the attenuation. For simplicity, we ignored attenuation (κ0 = 0), and only considered the dominant, diagonal depolarization components (ζ7,8,9) in our simulations. For selected depolarization, diattenuation, and retardation parameters, the sample Müller matrix was then obtained as M = expm(mz), where expm(·) is the matrix exponential. Simulations were conducted for different input polarization states given by Spi and Sni (i = 1, 2, 3) as described above for forward propagation, MA, and backward propagation, MB. The simulations illustrate DOP, , DD, and PD, where is the average DOP of all Spi and Sni in the forward and backward direction.
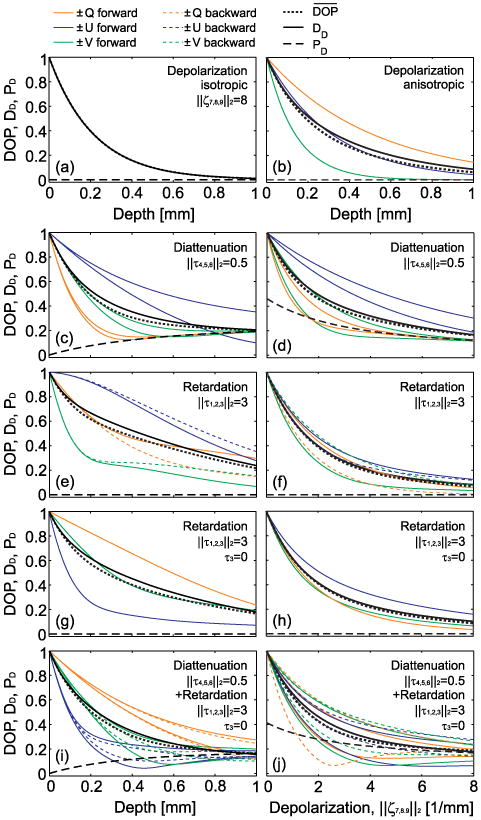
We evaluated the case of isotropic depolarization, ζ7 = ζ8 = ζ9 [Fig. 1(a)], as well as anisotropic depolarization with an arbitrarily chosen depolarizing axis [Fig. 1(b)]. In both cases, ‖(ζ7 ζ8 ζ9)T‖2 = 8 mm−1, while diattenuation and retardation was set to zero, and where ‖·‖2 represents L2 generalization. Evidently, for isotropic depolarization, no dependency of the DOP on the input polarization state or sample direction is observed. However, tissue frequently scatters anisotropically, yielding anisotropic depolarization that causes a strong dependency on the input polarization state [Fig. 1(b)]. Although DOP is a quantitative metric, this large variation precludes its use for robust segmentation and tissue characterization. Figure 1(c) shows the case of anisotropic diattenuation with ‖(τ4 τ5 τ6)T‖2 = 0.5 mm−1 as a function of depth with ‖(ζ7 ζ8 ζ9)T‖2 = 8 mm−1, while Fig. 1(d) illustrates this as a function of depolarization at z = 1 mm. With diattenuation present, we notice a different DOP for the orthogonal components (parallel in Stokes space). Moreover, depending on the incident polarization state, DOP can recover because diattenuation has polarizing properties. This is reflected by the increase in PD as diattenuation gradually increases with depth until finding an equilibrium with depolarization eventually [Fig. 1(c)]. Indeed, Fig. 1(d) shows that for low depolarization the polarization power, PD (which indicates the strength of the optical system to polarize) is higher than the tendency of the optical system to depolarize (which is shown by the complement of the depolarization index) due to dominant diattenuation. Figures 1(e) and 1(f) depict the case when retardation is present with ‖(τ1 τ2 τ3)T‖2 = 3 mm−1 (no diattenuation). We observe a dependency on forward and backward sample propagation. The source of this dependency arises from the τ3 component (circular birefringence) of the differential Müller matrix that causes a matrix asymmetry. Indeed, when τ3 = 0 [Figs. 1(g) and 1(h)], this dependency diminishes, hinting to the well-known fact that circular birefringence is not measurable in OCT where symmetry is regained after double pass. Figures 1(i) and 1(j) illustrate the scenario where both diattenuation and retardation are present. Interestingly, although no circular birefringence is present (τ3 = 0), a strong dependency on propagation direction is observed. While τ1 and τ2 induce a continuous linear birefringence, τ6 (diattenuation) breaks the symmetry for forward and backward propagation and biases the Stokes vector elements.
Fig. 1.

DOP, DD, PD as a function of depth and depolarization: (a) isotropic depolarization; (b) anisotropic depolarization; (c), (d) aniso. dep. with diattenuation; (e), (f) aniso. dep. with retardation; (g), (h) aniso. dep. with retardation but no circular birefringence; (i), (j) aniso. dep. with diattenuation and retardation.
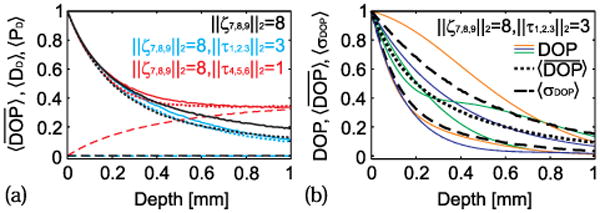
In Fig. 2(a) we plot similar scenarios as shown in Fig. 1 after compounding 4000 orientations for depolarization, ‖ζ7,8,9‖2 = 8 mm−1, retardation, ‖τ1,2,3‖2 = 3 mm−1, and diattenuation, ‖τ4,5,6‖2 = 1 mm−1. This offers expected values for the average DOP, (dotted line), depolarization index, 〈DD〉 (solid line), and polarization index, 〈PD〉 (dashed line). All orientations were distributed uniformly across the Poincaré sphere by utilizing normally distributed axis components following L2 generalization. Due to the polarization power of diattenuation (red), the expected average DOP plateaus faster compared to no diattenuation, preventing it from reaching total depolarization with increasing depth. Interestingly, the previously observed difference in DOP for orthogonal polarization states (parallel in Stokes space) is now missing, leading to the conclusion that both share the same mean DOP [not shown in Fig. 2(a)]. Similar observations are made when retardation is present (blue). The previously observed difference in DOP for forward and backward propagation is now averaged to a common mean DOP for all input states [not shown in Fig. 2(a)]. Moreover, with increasing retardation, the depolarization index deviates less from the expected average DOP, . This can be appreciated when considering that retardation mixes the Stokes vector elements with depth, thus averaging possible DOP formations for the different input states. Because retardation has no polarization power, the expected average DOP is comparable to that without retardation (black).
Fig. 2.

Expected values for, , DD, PD for 4000 orientations (a) and two computations of DOP together with expected and expected standard deviation obtained from 4000 computations (b).
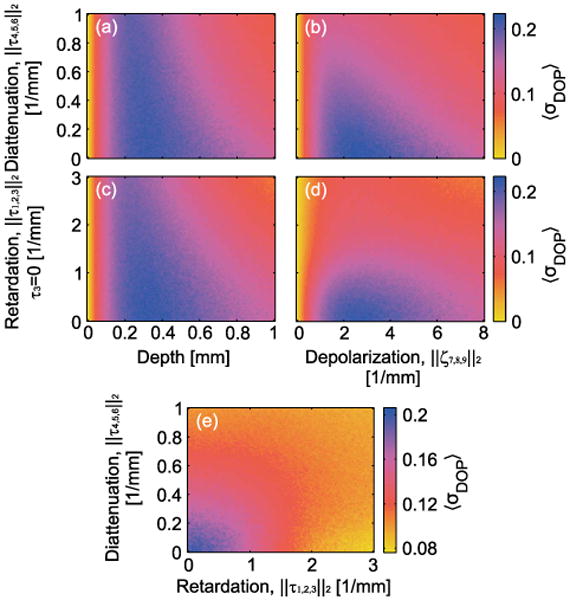
To obtain a better appreciation for the variance of the DOP for the 6 input states and two propagation directions, in Fig. 2(b), we plot the DOP for two arbitrarily chosen orientations, shown as before in orange, blue, and green, together with the expected standard deviation, 〈σDOP〉, and expected average DOP obtained from 4000 orientations with ‖ζ7,8,9‖2 = 8 mm−1 and ‖τ1,2,3‖2 = 3 mm−1 (τ3 = 0). Both computations yield dramatically different DOPs for the same input states. Possible deviations of DOP are formally highlighted by 〈σDOP〉. For a more general analysis, in Fig. 3, we plot the expected standard deviation of the DOPs for 500 arbitrarily chosen axis orientations (averaged DOP standard deviation for 500 axis orientations). For increasing diattenuation, Figs. 3(a) and 3(b) points toward a decrease in the standard deviation with increasing depth and/or depolarization. This is because with increasing diattenuation, the DOP of all input states plateaus earlier due to higher polarization power. Similar observations were made when retardation was present [Figs. 3(c) and 3(d)]. Here 〈σDOP〉 decreases with increasing retardation as possible DOP formations for different input states are increasingly compounded. Both scenarios are illustrated again in Fig. 3(e) for ‖ζ7,8,9‖2 = 4 mm−1 and z = 1 mm, leading to similar conclusions.
Fig. 3.

Expected standard deviation of DOP for 500 uniformly chosen orientations: (a), (c) ‖ζ7,8,9‖2=8mm−1; (b), (d) z = 1 mm; (e) ‖ζ7,8,9‖2 = 4 mm−1, z = 1 mm.
For experimental verification, DOPU and DD are compared for different input polarization states, Q, U, V, obtained from a stretched rubber phantom, using a PS–OFDI configuration. The optical system was comprised of a wavelength-swept laser with λ0 = 1298 nm, Δλ = 115 nm, 50-kHz sweeping frequency, and an optical power of 9 mW incident at the sample. The sensitivity of the system was measured as 97 dB. Polarization-diverse detection allowed to cast the returning depth-resolved Jones vector. Two polarization states, orthogonal in Jones space, Jh and Jv (±Q in Stokes space), were delivered to the sample simultaneously using a frequency multiplexing scheme [4,14]. Both input polarizations were demodulated from different fringe-modulation offsets. A phase correction was applied using a calibration signal as described by Braaf et al. [15]. The depth-resolved Stokes vectors were calculated from the measured Jones vectors. After spatial averaging in Stokes space, using a Hanning-shaped kernel, extending over wz= 3rz and wx= 3rx, with rz,x the axial and lateral resolution, i.e., speckle size, respectively, we obtained the degree of polarization uniformity, , where 〈·〉 indicates spatial averaging. The two orthogonal polarization states provided by the frequency-multiplexed system rigorously comprised any possible polarization state incident at the sample. The two polarization states were used to synthesize linear 45° polarized and circularly polarized Jones vectors as J45° = 1/√2(Jh ± Jv) and Jc = 1/√2(Jh ± iJv) for further analysis. The multiplexed polarization states are altered arbitrarily by the sample arm fiber. Assuming the fiber to be a pure retarder, however, the original orthogonality (in Jones space) is preserved at the sample, thus permitting the analysis of DOPU contrast for any polarization state.
Furthermore, the two incident polarization states, orthogonal in Jones space, directly cast the system Jones matrix, JS, as ψout = JAψin, where ψin is the 2×2 identity matrix containing the two orthogonal input polarization states. In order to compute the depolarization index, the system Jones matrix was converted into a Jones–Müller matrix by applying the tensor Kronecker product. Each Jones–Müller matrix element was then spatially averaged using the same Hanning-shaped kernel as described before for obtaining the Stokes vectors, eventually offering the system Müller matrix. The depolarization index and polarization index were obtained from the Müller matrix using Eqs. (3) and (4).
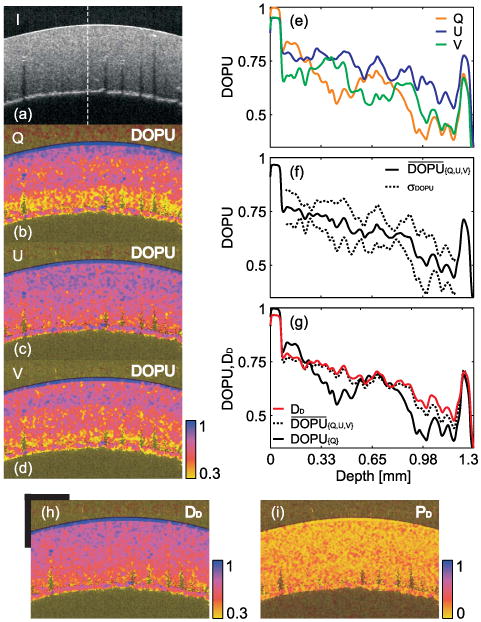
Figures 4(b)–4(d) show the DOPU for different incident polarization states. Indeed, a strong variation in DOPU contrast was observed for the three polarization states. In the case of Q as input state, depolarization appears much stronger with depth compared to the U input state. Figure 4(e) plots the cross-section of the DOPU indicated by the white line in the intensity plot [Fig. 4(a)], while Fig. 4(f) shows the standard deviation and mean of the DOPU for the three polarization states. In the worst case scenario, the standard deviation yields a DOPU ambiguity that ranged from 0.63 to 0.36 at a depth of 980 μm. Figure 4(g) compares the DOPU for the Q input state (black, solid line) with the averaged DOPU between Q, U, V (black, dotted line). Indeed, the averaged DOPU matches the calculated depolarization index (red line) well. Unlike the DOPU for Q input polarization (black, solid line), DD gradually decreases with depth as it is expected from a homogenous, i.e., nonlayered sample. Finally, we complete this Letter by showing the reconstructed images of the depolarization index and polarization index in Figs. 4(h) and 4(i), respectively.
Fig. 4.

Images of a rubber phantom: (a) intensity image; (b)-(d) DOPU images for Q, U, V input polarization state; (e) DOPU cross-sections shown by white line in (a); (f) mean and standard deviation of DOPUs shown in (e); (g) comparison of DOPU, average DOPU and DD; (h), (i) depolarization index and polarization index images of the phantom. Scale bars = 1 mm.
Acknowledgments
Funding. National Institute of Health (P41 EB015903); Terumo Corporation.
References
- 1.de Boer JF, Milner TE, van Gemert MJC, Nelson JS. Opt Lett. 1997;22:934. doi: 10.1364/ol.22.000934. [DOI] [PubMed] [Google Scholar]
- 2.Saxer CE, de Boer JF, Park BH, Zhao Y, Chen Z, Nelson JS. Opt Lett. 2000;25:1355. doi: 10.1364/ol.25.001355. [DOI] [PubMed] [Google Scholar]
- 3.Jiao S, Todorovic M, Stoica G, Wang LV. Appl Opt. 2005;44:5463. doi: 10.1364/ao.44.005463. [DOI] [PubMed] [Google Scholar]
- 4.Oh WY, Yun SH, Vakoc BJ, Shishkov M, Desjardins AE, Park BH, de Boer JF, Tearney GJ, Bouma BE. Opt Express. 2008;16:1096. doi: 10.1364/oe.16.001096. [DOI] [PMC free article] [PubMed] [Google Scholar]
- 5.Park BH, Pierce MC, Cense B, de Boer JF. Opt Lett. 2004;29:2512. doi: 10.1364/ol.29.002512. [DOI] [PMC free article] [PubMed] [Google Scholar]
- 6.Adie SG, Hillman TR, Sampson DD. Opt Express. 2007;15:18033. doi: 10.1364/oe.15.018033. [DOI] [PubMed] [Google Scholar]
- 7.Götzinger E, Pircher M, Geitzenauer W, Ahlers C, Baumann B, Michels S, Schmidt-Erfurth U, Hitzenberger CK. Opt Express. 2008;16:16410. doi: 10.1364/oe.16.016410. [DOI] [PMC free article] [PubMed] [Google Scholar]
- 8.Ju MJ, Shin JG, Hoshi S, Yasuno Y, Lee BH, Tang S, Eom TJ. J Biomed Opt. 2014;19:030503. doi: 10.1117/1.JBO.19.3.030503. [DOI] [PubMed] [Google Scholar]
- 9.Makita S, Hong YJ, Miura M, Yasuno Y. Opt Lett. 2014;39:6783. doi: 10.1364/OL.39.006783. [DOI] [PubMed] [Google Scholar]
- 10.Yun SH, Tearney GJ, de Boer JF, Iftimia N, Bouma BE. Opt Express. 2003;11:2953. doi: 10.1364/oe.11.002953. [DOI] [PMC free article] [PubMed] [Google Scholar]
- 11.Gil JJ, Bernabeu E. Opt Acta. 1986;33:185. [Google Scholar]
- 12.Devlaminck V. J Opt Soc Am A. 2013;30:2196. doi: 10.1364/JOSAA.30.002196. [DOI] [PubMed] [Google Scholar]
- 13.Villiger M, Bouma BE. Opt Lett. 2014;39:1779. doi: 10.1364/OL.39.001779. [DOI] [PMC free article] [PubMed] [Google Scholar]
- 14.Zhang EZ, Oh WY, Villiger ML, Chen L, Bouma BE, Vakoc BJ. Opt Express. 2013;21:1163. doi: 10.1364/OE.21.001163. [DOI] [PMC free article] [PubMed] [Google Scholar]
- 15.Braaf B, Vermeer K, Sicam V, van Zeeburg E, van Meurs J, de Boer JF. Opt Express. 2011;19:20886. doi: 10.1364/OE.19.020886. [DOI] [PubMed] [Google Scholar]


