

Abstract
Background
Parkinson’s disease (PD), traditionally considered a movement disorder, has been shown to affect executive function such as the ability to adapt behavior in response to new environmental situations.
Objective
to identify the impact of PD on neural substrates subserving two specific components of normal movement which we refer to as activation (initiating an un-cued response) and inhibition (suppressing a cued response).
Methods
We used fMRI to measure pre-movement processes associated with activating an un-cued response and inhibiting a cued response plan in 13 PD (ON anti-parkinsonian medications) and 13 control subjects. Subjects were shown a visual arrow cue followed by a matched or mismatched response target that instructed them to respond with a right, left, or bilateral button press. In mismatched trials, an un-cued (new) response was initiated, or the previously cued response was suppressed.
Results
We were able to isolate pre-movement responses in dorsolateral prefrontal cortex, specifically in the right hemisphere. During the activation of an un-cued movement, PD subjects showed decreased activity in the putamen and increased cortical activity in bilateral DLPFC, SMA, subcentral gyrus and inferior frontal operculum. During inhibition of a previously cued movement, the PD group showed increased activation in SMA, S1/M1, premotor and superior parietal areas.
Conclusion
Right DLPFC plays a role in pre-movement processes, and DLPFC activity is abnormal in PD. Decreased specificity of responses was observed in multiple ROI’s. The basal ganglia are involved in circuits that coordinate activation and inhibition involved in action selection as well as execution.
Keywords: executive function, dorsolateral prefrontal cortex, fMRI
Introduction
In the past, the signs of Parkinson’s disease (PD) were often ascribed to isolated dysfunction within the basal ganglia (BG). Accumulating evidence suggests, however, that a more fruitful perspective is to view PD pathophysiology as dysfunction within macro-scale neuronal circuits that interconnect different regions of the BG, thalamus, and cortex [1]. Anatomically-segregated BG-thalamocortical circuits normally subserve different functions, such as skeletomotor behavior or cognitive function [1, 2], and focal disruption of neuronal activity in one of these circuits selectively elicits, depending on the site of disruption, discrete disorders of movement or cognition [3, 4]. Thus, while cognitive and motor performance are intimately intertwined, it is clear that the cognitive impairments of PD have unique functional correlates separate from motor deficits.
The BG-thalamocortical circuit that subserves executive function originates in dorsolateral prefrontal cortex of the frontal lobe and projects primarily to the dorsolateral head of the caudate nucleus [1, 2]. The caudate is connected, via the direct and indirect pathways to the globus pallidus, substantia nigra and subthalamic nucleus. Pallidal and nigral neurons of the circuit project to the thalamus, which in turn is connected back to dorsolateral prefrontal cortex. Cognitive deficits appear to be related to the effects of the loss of dopaminergic innervation of the caudate nucleus and consequent change in basal ganglia outflow in this cognitive circuit [5–8]. Consequently, patients with PD display deficits in executive function, which comprises the ability to elaborate or adapt behavior in response to new environmental situations. Two major components of parkinsonian executive dysfunction are an impaired ability to select context-appropriate actions, and impaired inhibition of prepotent actions [9, 10].
The classical model of parkinsonian pathophysiology proposes that the motor deficits in PD are due, at least in part, to an imbalance between activation and inhibition within basal ganglia-thalamocortical circuits, impairing patients’ ability to initiate desired movements and inhibit competing movements [11]. According to that proposal, when activity of the direct and indirect pathways through the basal ganglia (BG) are in balance, the aggregate effects disinhibit the thalamus appropriately so that desired motor responses can occur without interfering effects of prepotent irrelevant or undesired responses.
This general activation-inhibition model of motor execution has been extended to include cognitive function, such as filtering of movement relevant information [12, 13], and Simmonds and colleagues [14] reviewed evidence for the hypothesis that a group of cortical brain areas might comprise a circuit underlying processes of response inhibition including such regions as prefrontal and parietal cortex, dorsal cingulate, and insula. People with PD demonstrate deficits consistent with impairment of both the activation and inhibition of motor responses [15–17], which are components of a process termed ‘switching’. Switching which consists of both the activation of a desired response and inhibition of the previous response [18–20]. Recent fMRI studies of brain activity related to switching [21–23] suggest that frontal areas that share basal ganglia circuits play a role in maintaining the action program once it is activated. However, other fMRI studies reveal a lack of consistency as to the involvement of frontal lobe in switch tasks [24, 25]. Thus, there has been a lack of consensus regarding the exact nature of the pathophysiology of these deficits in PD.
Our goal was to test the hypothesis that PD results in abnormal activation of the frontostriatal network subserving cognitive function during initiation of an un-cued response and inhibition of a cued response. Unlike previous work, we were able to dissociate the more abstract planning (activation and inhibition) aspects of the task from the motor execution components so that we could disentangle brain areas associated with pre-movement processes from those associated with motor execution.
Materials and Methods
Subjects
Thirteen right-handed PD subjects and 13 controls (Table 1) were enrolled after screening for contraindication to MRI, history of stroke or significant head trauma, significant uncorrected vision impairment, and history of brain surgery or claustrophobia. All subjects provided written informed consent and the study was performed with the approval of the University of California, Davis Committee for Human Research. Clinical diagnosis of PD was made according to Queen Square Brain Bank criteria and confirmed by review of medical records. Subjects performed the task in the best ON medicated state, while on levodopa with carbidopa, dopamine agonist, and/or COMT inhibitor treatment for Parkinson’s disease (Levadopa equivalents 867± 517mg).
Table 1.
Demographic data. Values are means (SD).
| Age (years) | gender | PD Duration (years) | H&Y Score | Levadopa Equivalents (MG) | Total N | |
|---|---|---|---|---|---|---|
| PD | 57.5 (11.8) | m=8 | 6.5(3.9) | 1.5(0.7) | 867(517) | 13 |
| Control | 63.9 (7.0) | m=8 | - | - | - | 13 |
Stimulus Presentation
Stimuli consisted of a visually presented cue arrow followed by a target arrow that indicated the correct button press response. Subjects were instructed to focus on the fixation point that was present at all times. A cue arrow (in orange) was presented at fixation, followed by a delay interval. At the end of the delay interval, a blue target arrow was presented at the fixation point (Figure 1A).
Figure 1.
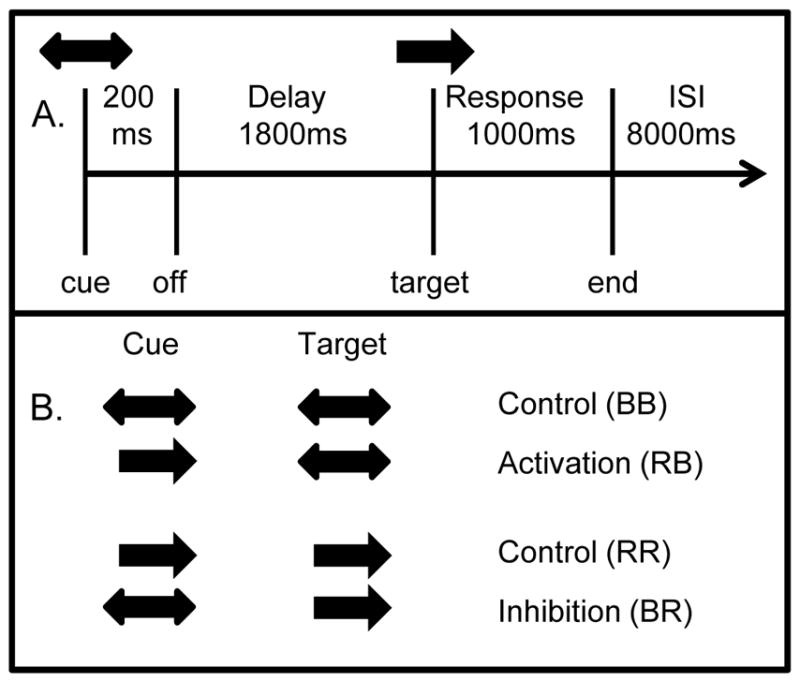
Task description. A) Subjects were presented with a cue arrow lasting 200 ms, which was followed by a delay interval of 1800ms. A target stimulus (arrow or arrows) then occurred. The target disappeared as soon as a button press occurred, or after a 1000 ms response period. Following the response period was an inter-stimulus interval (ISI) of 8000 ms, making a total of 11 seconds from cue to cue. An example trial from the inhibition condition is shown, with a bilateral cue and a right hand target. This trial required the subject to inhibit a cued response in the left hand. B) Activation (top) and Inhibition (bottom) trials are shown for the right hand. Trials for the left hand were identical except unilateral cue arrows pointed to the left. BB = bilateral cue and bilateral target, RB = right cue and bilateral target, RR = right cue and right target, BR = bilateral cue and right target.
Cue and target stimuli consisted of unidirectional arrows pointing to either the left or right, or bidirectional (double-headed) arrows (Figure 1B). Subjects were instructed to respond to the target arrow with either uni-manual (in the direction of a single-headed arrow) or bimanual (in the case of bidirectional arrows) button presses. One of seven possible pairs of cue/target stimuli was presented. Control trials were right cue and right target (RR), and left cue and left target (LL) and bilateral cue and bilateral target (BB). Mismatched trials were right or left cue and bilateral target (RB, LB), bilateral cue and right or left target (BR, BL). There were two types of mismatched trials designed to examine two different behaviors. For activation trials subjects were required to initiate an un-cued button press movement, as in the case of RB and LB trials. For inhibition trials subjects were required to suppress a cued button press movement, as in the BR and BL trials. Thirty-two trials of each stimulus type were presented. Stimuli were broken into 8 runs each containing 28 trials so that subjects could rest briefly between the 7-minute runs during the 1.5 hour scan. Stimuli were presented in random order within each run.
A fiber-optic button box (Photon Control Inc., http://www.photon-control.com/) was held in both left and right hands. Stimuli were generated on a PC using Presentation software (www.neurobs.com/presentation). Subjects were supine and stimuli were viewed on an 83 × 61.5 cm rear-projection screen located at the subject’s feet through a mirror 6 cm above the eyes and 290 cm from the mirror with a 0.3 degree visual angle. Stimuli were projected onto the rear projection screen through an LCD projector (XG-G20XU, Sharp Electronics, New Jersey).
Behavioral Data Acquisition
Reaction time data was collected from a subset of PD (N=6) and control (N=5) subjects outside the MRI scanner. Data was collected using a Dell Precision pws380 running Windows and Presentation software and ADC channel buttons (Ablenet Inc., Roseville, MN; http://www.ablenetinc.com). Psychophysical data was collected on a separate day following fMRI scanning.
MRI Acquisition
Scanning was performed on a 1.5 T GE Signa scanner at the University of California, Davis Research Imaging Center. An event related design was used with whole brain volumes collected every 2 seconds. Eight runs were acquired with each run consisting of 200 brain volumes each: 4 frames at the start to help the scanner reach saturation, plus 196 frames of stimulus delivery (28 blocks of 7 frames each).
FMRI data were collected using an interleaved gradient echo echo planar sequence (TR= 2000ms, TE = 50 ms) from 20 six mm-thick axial slices (64 × 64 matrix, FOV = 220mm) using a whole-head RF coil. A co-planar high resolution T1-weighted image was also acquired within the same session (FOV= 220 mm, matrix = 256×256, TE = 6 ms, TR = 35 ms, flip angle = 30 degrees, 0.86 × 0.86 × 1.2 mm3).
Post-processing
High-resolution T1 images were re-sliced to 1 × 1 × 1 mm3 resolution, and the cortical surfaces were identified and inflated using FreeSurfer (surfer.nmr.mgh.harvard.edu). FMRI data in each run were spatially realigned using SPM5 (www.fil.ion.co.uk/spm2). For cortical data, anatomical space analysis [26] was used to improve spatial localization by co-registering all fMRI images from a given subject with the subject’s high-resolution anatomical, and then reslicing and extracting each frame’s data at the white-gray junction onto the registered cortical surface. Cortical and subcortical region of interest (ROI) data was extracted from each fMRI frame using the individual subject ROIs defined by FreeSurfer and by other methods (Table 2). Data were obtained from ROI’s that included structures involved in the sensory-motor and associate loops (Figure 2). ROI’s were chosen because they are part of the sensory motor or cognitive-associative BG-thalamocortical circuits (Table 2).
Table 2.
Identification of Regions of Interest. Program and references for the identification of ROI boundaries. Median MNI space coordinate location within the ROI is also given.
| ROI Name | Method |
|---|---|
| Hand region of sensory motor cortex | HMAT M1 and S1 restricted to MNI z-coordinate range (+43,+65) determined via a reanalysis of finger activation [61, 62). M1 (−40, −21, +55); (+38, −21, +54) and S1 (−46, −29, +52); (+44, −30, +52) |
| SMA/preSMA | HMAT SMA (−7, −16, +62); (+5, −13, +63) and preSMA (−6, +10, +59); (+6, +9, +60) |
| Premotor - dorsal and lateral | HMAT PMd (−33, 0, +56); (+32, −1, +55) and Juelich premotor6 lateral part (−15, −13, +70); (+20, −17, +72) |
| Inferior Frontal Operculum | FreeSurfer Inf_Front_Operculum (+48, +12, +10); (−50, +14, +10) and Subcentral_G (+56, −10, +14); (−58, −12, +14) |
| Inferior Frontal Sulcus | FreeSurfer S_frontal_inferior (+40, +24, +22); (−40, +24, +22) and S_precentral-Inferior-part (+44; +4, +30); (−46, +2, +28) |
| Anterior Cingulate | FreeSurfer caudalanteriorcingulate (+4, +22, +26); (−6, +20, +26) |
| Dorsolateral Prefrontal | Meta-analysis of expert-labeled DLPFC locations in the SumsDB stereotaxic coordinate database (sumsdb.wustl.edu/sums) on the mean cortical surface. (−44, +31, +24); (+41, +32, +22) |
| Inferior Parietal | Juelich atlas IPC_PFt (−53, −27, +38); (+49, −26, +41) and FreeSurfer G_parietal_inferior_Supermarginal (+30, −58, +42); (−30, −60, +40) |
| Superior Parietal | FreeSurfer IPS (+30, −58, +42); (−30, −60, +40) and G_superior_parietal (+22, −62, +62); (−22, −64, +58) |
| Basal Ganglia | FreeSurfer Putamen (+26, 0, −2);(−26, 0, −2) and Pallidum (+18, −4, −4);(−20, −4, −4) |
| Caudate | FreeSurfer Caudate (+12, +10, +8); (−12, +8, +8) |
| Motor-related Thalamus | FreeSurfer Thalamus restricted to primary motor and premotor subregions of the Oxford Thalamic cortical connectivity atlas projected onto each individual [63] (+16,−18,+6); (−18,−16,+6) |
Figure 2.

A) Cortical ROI’s displayed on an unfolded brain. Green lines indicate ROI boundaries. Anterior is to the right and left, top=superior. B) Lateral view of the map for the activation condition for the BB – RB contrast. Blue = RB > BB. C) Lateral view of the map for the inhibition condition for the RR – BR contrast. Blue = BR > RR. All maps shown are BOLD % difference maps masked by a fixed-effect z statistic of 6 and a minimum cluster size of 0.2 cm2 displayed on a mean cortical surface generated from anatomical images of 60 young control subjects processed using FreeSurfer and SPM5’s MNI normalization (www.nitrc.org/projects/vamca).
ROI Statistical Analysis
Percent signal change within each ROI was determined by subtracting the average of frames 1 and 7 within each block from those of frames 3, 4, and 5. Multifactorial ANOVAs using CLEAVE software (www.ebire.org/hcnlab/cleave) were used to detect the random effects group differences. Planned comparisons were performed for movement initiation (BB vs. RB, BB vs. LB) and inhibition (RR vs. BR, LL vs. BL). Similarly, to examine group differences we compared mismatched trials across groups (e.g. BR, PD vs. control).
Cortical Activation Visualization
Spatial smoothing was applied to individual cortical surface functional image data using a 5-mm FWHM Gaussian surface filter [27]. Time-series smoothing was accomplished using a high-pass polynomial filter to remove noise below 0.02 Hz. Statistical F-maps for condition comparisons were then generated by using images 3 through 5 within a block as a factor while taking into account the expected positive direction of BOLD activation [28]. We used F-maps to identify reliable BOLD fluctuations within a block [29].
Results
Behavioral Results
There were no reaction time (RT) differences across trial types or between groups (Table 3). There were also no significant differences in error rates across trials or between groups (PD mean, SD: 3.0, 6.7%; Control: 1.3, 4.5%).
Table 3.
Reaction Time Data. Mean (SD) reaction time (ms) for each trial type. Means are for both left and right hands for all trial types.
| Activated Hand | Cued Hand | Bilateral Control | Inhibition | Unilateral Control | |
|---|---|---|---|---|---|
| Control | 555(86) | 554(89) | 564(196) | 533(73) | 479(83) |
| PD | 549(119) | 536(109) | 539(87) | 508(216) | 478(133) |
Activation of an Un-cued Movement, Group Differences
To evaluate the pre-movement processed associated with activation of an un-cued response, we compared unilateral cue/bilateral target trials versus bilateral cue/ bilateral target trials. We identified a significant difference in dorsolateral prefrontal cortex (DLPFC), where control subjects showed greater signal intensity in the right hemisphere during response activation regardless of the laterality of the response (F(1,24)=6.1, p<0.05; Figures 2B, 3). In contrast, the PD group did not display this activation-specific interhemispheric asymmetry in DLPFC. Rather, the PD group showed a bilateral response-related increase in BOLD signal in DLPFC during both activation and control trials.
Figure 3.

A&B) Mean (SD) BOLD signal over time for the initiation (RB) and bilateral control (BB) conditions from the DLPFC ROI. Data from the PD and control groups are shown for the right (RH) and left (LH) hemispheres. C) Mean (SD) BOLD signal over time for the initiation condition from the putamen ROI. Note that responses are significantly delayed in the PD group as well as reduced during movement initiation. D) Mean (SD) BOLD signal over time for the initiation condition from the IFO ROI.
We also found several differences in BOLD signal between the PD and control groups when comparing initiation trials across groups. The PD group showed a delayed latency in the BOLD response of the BG which also was highly variable (F(2,48)=5.2, p<0.05; Figure 3). There was also a small but significant time course difference between the control and PD groups in the supplementary motor area (SMA; F(2,48)=3.5, p<0.05). In the subcentral gyrus and inferior frontal operculum (IFO), the PD group showed a sustained increase in signal intensity compared to controls in both the activation and control conditions (F(2,48)=7.4, p<0.005). There were no differences across groups in motor cortex, motor related thalamus or parietal ROIs.
Inhibiting a Cued Movement, Group Differences
To evaluate pre-movement processed associated with inhibition of a cued movement, we compared bilateral cue/unilateral target trials with unilateral cue/unilateral target trials. While the right hemisphere tended to be more active during inhibition in DLPFC in the control group, there was no statistically significant asymmetry of response for the inhibition conditions in the control or PD groups (Figure 2C). There was also no difference in BOLD signal intensity between the inhibition and control trials for the PD or control groups.
Significant differences between groups for inhibition trials included a larger BOLD response in the SMA in the PD group (F(1,24)=4.6, p<0.05; Figure 4). In addition, the PD group showed reduced hemispheric asymmetry in the cortex. In S1/M1 the control group showed a greater BOLD signal in the hemisphere contralateral to the unilateral button press compared to the ipsilateral hemisphere (Figure 4). In contrast, the PD group showed a bilateral BOLD increase in S1/M1 in response to unilateral button press under both trial types (F(1,24)=5.9, p<0.05; Figure 4). A similar relative enhancement of ipsilateral BOLD activity in the PD group occurred in premotor and superior parietal areas (F(1,24)=4.7, 6.4, respectively, all p<0.05). Inhibition trials also resulted in activation in both the PD and control groups in the subcentral gyrus. However, the inferior frontal operculum (IFO) was more active in the PD group (F(1,24)=9.0, p<0.05; Figure 4) compared to controls.
Figure 4.

A & B) An example of the contralateral response to the unilateral matched (RR) and inhibition (BR) conditions in the S1/M1 ROI. The mean (SD) BOLD signal over time shows a unilateral response in the control group (solid), but the difference between hemispheres was significantly decreased in the PD group (open). A similar pattern was evident for inhibition trials executed with the right and left hand. C) Mean (SD) BOLD signal over time for the inhibition condition from the IFO ROI. BOLD signal change was not significant in the Control group. D) Mean (SD) BOLD signal over time for the inhibition condition from the SMA ROI. SMA was significantly overactive in the PD group for both activation and inhibition conditions.
Bold Signal and Levadopa Equivalents
To evaluate the relationship between the BOLD signal and dopamine replacement therapy we calculated the correlations between the mean BOLD contrast (mean signal intensity from time points 3,4, 5 versus time points 1 and 7 across all conditions) with levadopa equivalent data from individual PD subjects. Significant correlations (p < 0.01) were observed in SMA (R2=0.69), M1S1 (R2=0.50), IFO (R2=0.49) and subcentral gyrus (R2=0.62).
Discussion
We examined critical brain regions that comprise the frontal-thalamo-striatal circuits subserving movement initiation and inhibition, and we were able to dissociate brain circuitry subserving these processes in DLPFC. We also identified abnormalities in BOLD activation patterns in PD, measuring decreased selectivity of responses in multiple regions of interest. These key findings will be discussed in terms of their implications for the neural circuits involved in the healthy brain and in the brain affected by PD.
Differentiating Activation and Inhibition
In the current study, pre-movement processes underlying activation and inhibition of responses could be differentiated from processes underlying movement execution, specifically in DLPFC. Activation of an un-cued response resulted in a significant increase in BOLD signal in the right hemisphere. A similar, albeit non-significant, trend was observed for inhibition of a cued movement. Data on movement activation is relatively sparse and inconsistent. Fassbender and colleagues [30] found that the right DLPFC was active during both cued and un-cued trials of a go/no-go task, which is in agreement with the current findings. However, unlike previous work, we were able to isolate pre-movement aspects of the task from the motor execution components. For example, Aron and colleagues [15] reported activity that tended to be contralateral to the responding hand, for example in M1 and thalamus in response to “go” trials. In contrast, in our study, the control motor output condition allowed us to isolate pre-movement activity to DLPFC on movement activation trials.
Existing work suggests that switching and response inhibition tasks have a common substrate in the right inferior frontal cortex [31], and lesioning the right inferior frontal gyrus (IFG) results in poorer performance on stop-signal inhibition tasks [32]. Chambers and colleagues [33] administered transmagnetic stimulation (TMS) over right and left hemispheres, including over the IFG and dorsal premotor areas, during performance of go/no-go/flanker tasks. They found no change in performance when TMS was administered over the left hemisphere, but impaired inhibition when TMS was applied over the right IFG.
In a review of ten response inhibition studies, Simmonds and colleagues [14] found support for the hypothesis that a group of cortical brain areas might comprise a circuit underlying processes of response inhibition. For example, Blasi et al., [34] reported inhibition related activity which was lateralized to right PFC, parietal cortex, dorsal cingulate, and insula. Furthermore, a review by Vanderhasselt et al. [35] suggests that hemispheric differences depend on the type of task used. Kaller et al. [36] found that the left DLPFC was involved with goal hierarchy, such as ordering several goals to reach a desired outcome, while the right DLPFC was more active during lower order switching within a class of rules [37], as in the task used in the current study. Taken together, the present findings suggest that regions of the prefrontal cortex are involved in pre-movement activation and inhibition of simple responses. While individual tasks yielded different patterns of activation, specific functions tend to be lateralized irrespective of the lateralization of the response.
Loss of Selectivity
Our findings suggest that people with PD fail to modulate cortical activation to the same extent seen in controls. For example, activation of an un-cued movement resulted in significant activity in the right DLPFC compared to the control condition in the healthy subjects regardless of which hand was used for the initiated movement. This hemispheric asymmetry was not observed in PD subjects, who showed activity in both hemispheres in DLPFC during initiation. Similarly, in the control group, the frontal operculum was active only during activation, while in the PD group it was active during both activation and inhibition. Furthermore, somatomotor cortex was differentially activated for unilateral and bilateral responses in the control group, while the PD group tended to show bilateral activity in S1/M1 for all stimulus conditions. Increased ipsilateral BOLD activity was also observed in the PD group in the SMA, premotor, and superior parietal areas during unilateral responses.
These findings are consistent with the concept that PD results in a loss of functional segregation in parallel BG-thalamocortical circuits. Abundant evidence indicates that the normal functional selectivity of neuronal responses in the basal ganglia is dramatically reduced in PD [38]. During movement, neurons in normal BG modulate activity to specific parameters of movement including velocity, direction, force, and amplitude [39–42]. These neurons also appear to be organized somatotopically [43–45]. These patterns of specific movement-related modulation of activity have been described at all levels of the BG [for review, see 38].
However in PD, this level of selectivity is lost. Electrophysiological recording data from humans and MPTP non-human primate animal models indicates that somatotopy breaks down, with an increase in kinesthetic cells responding to multiple joints or body parts as well as ipsilateral limbs [44, 46–49]. A similar loss of specificity has been reported for the thalamus [50], and our results extend these findings, suggesting that this loss of specificity is also present in the cortex. Furthermore, while previous work has focused on motor circuits, we have described a similar pattern in regions that make up the associative loop such as DLPFC. The loss of specificity in BG-thalamocortical associative circuits likely contributes to the deficits in cognitive flexibility observed in PD [51].
Parkinsonian Imbalance in Activation and Inhibition Circuitry
In the present study, people with PD showed abnormal brain activity during initiation and inhibition of a response even during periods of optimal dopamine replacement where behavior was at normal levels. During the activation of an un-cued movement, PD subjects showed decreased activity in the putamen and increased cortical activity, specifically in bilateral DLPFC, SMA, subcentral gyrus and IFO. Similarly, during inhibition of a previously cued movement, the PD group showed increased activation in the SMA, S1/M1, premotor and superior parietal areas. Consistent with earlier results from studies of motor execution, it seems that the described abnormalities of activation/inhibition also reflect properties of focused selection in relation to pre-movement processes. Our view is consistent with the notion that the basal ganglia, which failed to show normal patterns of activation in PD, provide an interface between input and output processes, in that these nuclei are involved in circuits that coordinate activation and inhibition involved in action selection and execution [see 52]. Our findings support the model proposed by Mink [11], extending it by illustrating the importance of the frontal portions of the striatal-thalamic-frontal loops involved in maintaining an appropriate balance between activation and inhibition within these complex circuits.
Dopamine Replacement
While our study was not designed to examine the relationship between dopamine and pre-movement processes, it is interesting that with dopamine replacement therapy optimized, subjects with PD still showed abnormalities in brain activity in the absence of behavioral differences across groups. Increased dopamine equivalent dose was associated with increased BOLD response to stimulation in several ROI’s, all of which showed abnormal activation patterns in mismatched trials in the PD compared to the control group. Specifically, PD subjects showed increased cortical activity in bilateral SMA, subcentral gyrus and IFO during activation, and in SMA and S1/M1 during inhibition. All of these regions also showed a correlation between the BOLD signal and dopamine equivalent dose.
The phasic activity of dopamine neurons is known to signal the salience of task events [53] and to regulate synaptic plasticity related to learning [54, for review see 55, 56]. Thus the parkinsonian abnormalities in the BOLD signal that we observed might be a product of the chronic absence of task-related phasic dopamine release. Indeed, several lines of evidence suggest that the symptoms of PD, and their physiologic correlates, develop slowly through processes of aberrant learning [57–59] and structural reorganization [60] that are unlikely to be reversed entirely by simple dopamine replacement therapy.
Acknowledgments
This work was supported by a grant from the National Institute of Neurological Disorders and Stroke (R01NS064040) to ED.
Footnotes
Conflict of Interest
The authors have no conflict of interest to report.
References
- 1.Alexander GE, Crutcher MD, DeLong MR. Basal ganglia- thalamocortical circuits: parallel substrates for motor, oculomotor, ‘prefrontal’ and ‘limbic’ functions. Prog Brain Res. 1990;85:119–146. [PubMed] [Google Scholar]
- 2.Alexander GE, DeLong MR, Strick PL. Parallel organization of functionally segregated circuits linking basal ganglia and cortex. Annu Rev Neurosci. 1986;9:357–381. doi: 10.1146/annurev.ne.09.030186.002041. [DOI] [PubMed] [Google Scholar]
- 3.Grabli D, McCairn K, Hirsch EC, Agid Y, Feger J, Francois C, et al. Behavioural disorders induced by external globus pallidus dysfunction in primates: I. Behavioural study. Brain. 2004;127:2039–2054. doi: 10.1093/brain/awh220. [DOI] [PubMed] [Google Scholar]
- 4.Worbe Y, Baup N, Grabli D, Chaigneau M, Mounayar S, McCairn K, et al. Behavioral and movement disorders induced by local inhibitory dysfunction in primate striatum. Cereb Cortex. 2009;19:1844–1856. doi: 10.1093/cercor/bhn214. [DOI] [PubMed] [Google Scholar]
- 5.Brück A, Portin R, Lindell A, Laihinen A, Bergman J, Haaparanta M, Solin O, Rinne J. Positron emission tomography shows that impaired frontal lobe functioning in Parkinson’s disease is related to dopaminergic hypofunction in the caudate nucleus. Neurosci Lett. 2001;311:81–84. doi: 10.1016/s0304-3940(01)02124-3. [DOI] [PubMed] [Google Scholar]
- 6.Holthoff-Detto VA, Kessler J, Herholz K, Bonner H, Pietzyk U, Wurker M, Ghaemi M, Wienhard K, Wagner R, Heiss WD. Functional effects of striatal dysfunction in Parkinson disease. Arch Neurol. 1997;54:145–50. doi: 10.1001/archneur.1997.00550140025008. [DOI] [PubMed] [Google Scholar]
- 7.Rinne JO, Portin R, Ruottinen H, Nurmi E, Bergman J, Haaparanta M, Solin O. Cognitive impairment and the brain dopaminergic system in Parkinson disease, [18F]Fluorodopa positron emission tomography study. Arch Neurol. 2000;57:470–75. doi: 10.1001/archneur.57.4.470. [DOI] [PubMed] [Google Scholar]
- 8.Cummings J. Frontal-Subcortical Circuits and Human Behavior. Arch Neurol. 1993;50:873–880. doi: 10.1001/archneur.1993.00540080076020. [DOI] [PubMed] [Google Scholar]
- 9.Praamstra P, Plat FM. Failed suppression of direct visuomotor activation in Parkinson’s disease. J Cogn Neurosci. 2001;13:31–43. doi: 10.1162/089892901564153. [DOI] [PubMed] [Google Scholar]
- 10.Obeso I, Wilkinson L, Jahanshahi M. Levodopa medication does not influence motor inhibition or conflict resolution in a conditional stop signal task in Parkinson’s disease. Exp Brain Res. 2011;213:435–45. doi: 10.1007/s00221-011-2793-x. [DOI] [PubMed] [Google Scholar]
- 11.Mink JW. The basal ganglia: focused selection and inhibition of completing motor programs. Prog Neurobiol. 1996;50:381–425. doi: 10.1016/s0301-0082(96)00042-1. [DOI] [PubMed] [Google Scholar]
- 12.Merian N. Modeling cognitive control in task-switching. Psychol Res. 2000;63:234–249. doi: 10.1007/s004269900004. [DOI] [PubMed] [Google Scholar]
- 13.Redgrave P, Prescott TJ, Gurney K. The basal ganglia: a vertebrate solutions to the selction problem. Neuroscience. 1999;89:1009–23. doi: 10.1016/s0306-4522(98)00319-4. [DOI] [PubMed] [Google Scholar]
- 14.Simmonds DJ, Pekar JJ, Mostofsky SH. Meta-analysis of Go/No-go tasks demonstrating that fMRI activation associated with response inhibition is task-dependent. Neuropsychologia. 2008;46:224–32. doi: 10.1016/j.neuropsychologia.2007.07.015. [DOI] [PMC free article] [PubMed] [Google Scholar]
- 15.Aron AR, Poldrack RA. Cortical and subcortical contributions to Stop signal response inhibition: role of the subthalamic nucleus. J Neurosci. 2006;26:424–33. doi: 10.1523/JNEUROSCI.4682-05.2006. [DOI] [PMC free article] [PubMed] [Google Scholar]
- 16.Chambers CD, Bellgrove MA, Stokes MG, Henderson TR, Garavan H, Robertson IR, et al. Executive “brake failure” following deactivation of human frontal lobe. J Cognit Neurosci. 2006;18:444–55. doi: 10.1162/089892906775990606. [DOI] [PubMed] [Google Scholar]
- 17.Franz EA, Miller J. Effects of response readiness on reaction time and force output in people with Parkinson’s disease. J Brain. 2002;125(Pt 8):1733–1750. doi: 10.1093/brain/awf192. [DOI] [PubMed] [Google Scholar]
- 18.Hayes AE, Davidson MC, Keele SW, Rafal RD. Toward a functional analysis of the basal ganglia. J Cogn Neurosci. 1998;10:178–198. doi: 10.1162/089892998562645. [DOI] [PubMed] [Google Scholar]
- 19.Monchi O, Petrides M, Doyon J, Postuma RB, Worsley K, Dagher A. Neural basis of set-shifting deficits in Parkinson’s disease. J Neurosci. 2004;24:702–710. doi: 10.1523/JNEUROSCI.4860-03.2004. [DOI] [PMC free article] [PubMed] [Google Scholar]
- 20.Shook SK, Franz EA, Higginson CI, Sigvardt KA. Dopamine dependency of intradimensional and extradimensional switching operations in Parkinson’s patients. Neuropsychologia. 2005;43:1990–1999. doi: 10.1016/j.neuropsychologia.2005.03.024. [DOI] [PubMed] [Google Scholar]
- 21.Escola L, Michelet T, Macia F, Guehl D, Bioulac B, Burbaud P. Disruption of information processing in the supplementary motor area of the MPTP–treated monkey: a clue to the pathophysiology of akinesia? Brain. 2003;126:95–114. doi: 10.1093/brain/awg004. [DOI] [PubMed] [Google Scholar]
- 22.Monchi O, Petrides M, Strafella AP, Worsley K, Doyon J. Functional role of the basal ganglia in planning and execution of action. Ann Neurology. 2006;59:257–264. doi: 10.1002/ana.20742. [DOI] [PubMed] [Google Scholar]
- 23.Brass M, von Cramon DY. Decomposing components of task preparation with functional MRI. J Cogn Neurosci. 2004;16:609–620. doi: 10.1162/089892904323057335. [DOI] [PubMed] [Google Scholar]
- 24.Lie CH, Specht K, Marshall JC, Fink GR. Using fMRI to decompose the neural processes underlying the Wisconsin Card Sorting Test. NeuroImage. 2006;30:1038–1049. doi: 10.1016/j.neuroimage.2005.10.031. [DOI] [PubMed] [Google Scholar]
- 25.Monchi O, Petrides M, Mejia-Constain B, Sttrafella AP. Cortical activity in Parkinson’s disease during executive processing depends on striatal involvement. Brain. 2007;130:233–44. doi: 10.1093/brain/awl326. [DOI] [PMC free article] [PubMed] [Google Scholar]
- 26.Kang X, Yung EW, Herron TJ, Woods DL. Improving the resolution of functional brain imaging: Analyzing functional data in anatomical space. J Magn Reson Imaging. 2007;25:1070–78. doi: 10.1016/j.mri.2006.12.005. [DOI] [PubMed] [Google Scholar]
- 27.Chung MK, Worsley KJ, Robbins S, Paus T, Taylor J, Giedd JN, et al. Deformation-based surface morphometry applied to gray matter deformation. NeuroImage. 2003;18:198–213. doi: 10.1016/s1053-8119(02)00017-4. [DOI] [PubMed] [Google Scholar]
- 28.Clare S, Humberstone M, Hykin J, Blumhardt LD, Bowtell R, Morris P. Detecting activations in event-related fMRI using analysis of variance. Magn Reson Med. 1999;42:1117–1122. doi: 10.1002/(sici)1522-2594(199912)42:6<1117::aid-mrm16>3.0.co;2-j. [DOI] [PubMed] [Google Scholar]
- 29.D’Esposito M, Deouell L, Gazzaley A. Alterations in the BOLD fMRI signal with ageing and disease: A challenge for neuroimaging. Nat Rev Neurosci. 2003;4:863–872. doi: 10.1038/nrn1246. [DOI] [PubMed] [Google Scholar]
- 30.Fassbender C, Hester R, Murphy K, Foxe JJ, Foxe DM, Garavan H. Prefrontal and midline interactions mediating behavioural control. Eur J Neurosci. 2009;29:171–177. doi: 10.1111/j.1460-9568.2008.06557.x. [DOI] [PMC free article] [PubMed] [Google Scholar]
- 31.Aron AR, Monsel S, Sahakian BJ, Robbins TW. A componential analysis of task-switching deficits associated with lesions of the left and right frontal cortex. Brain. 2004;127:1561–73. doi: 10.1093/brain/awh169. [DOI] [PubMed] [Google Scholar]
- 32.Aron AR, Fletcher PC, Bullmore ET, Sahakian BJ, Robbins TW. Stop-signal inhibition disrupted by damage to right inferior frontal gyrus in humans. Nature Neurosci. 2003;6:115–16. doi: 10.1038/nn1003. [DOI] [PubMed] [Google Scholar]
- 33.Chambers CD, Bellgrove MA, Gould IC, English T, Garavan H, McNaught, et al. Dissociable mechanisms of cognitive control in prefrontal and premotor cortex. J Neurophys. 2007;98:3638–47. doi: 10.1152/jn.00685.2007. [DOI] [PubMed] [Google Scholar]
- 34.Blasi G, Goldberg T, Weickert T, Das S, Kohn P, Zoltick B, et al. Brain regions underlying response inhibition and interference monitoring and suppression. Eur J Neurosci. 2006;23:1658–64. doi: 10.1111/j.1460-9568.2006.04680.x. [DOI] [PubMed] [Google Scholar]
- 35.Vanderhasselt MA, De Raedt R, Baeken C. Dorsolateral prefrontal cortex and Stroop performance: tackling the lateralization. Psychon Bull Rev. 2009;16:609–12. doi: 10.3758/PBR.16.3.609. [DOI] [PubMed] [Google Scholar]
- 36.Kaller CP, Rahm B, Spreer J, Weiller C, Unterrainer JM. Dissociable contributions of left and right dorsolateral prefrontal cortex in planning. Cereb Cortex. 2001;21:307–317. doi: 10.1093/cercor/bhq096. [DOI] [PubMed] [Google Scholar]
- 37.Yoshida W, Funakoshi H, Ishii S. Hierarchical rule switching in prefrontal cortex. Neuroimage. 2010;50:314–322. doi: 10.1016/j.neuroimage.2009.12.017. [DOI] [PubMed] [Google Scholar]
- 38.Bronfeld M, Bar-Gad I. Loss of specificity in basal ganglia related movement disorders. Front Syst Neurosci. 2011;5:1–13. doi: 10.3389/fnsys.2011.00038. [DOI] [PMC free article] [PubMed] [Google Scholar]
- 39.Iansek R, Porter R. The monkey globus pallidus: neuronal discharge properties in relation to movement. J Physiol. 1980;301:439–55. doi: 10.1113/jphysiol.1980.sp013216. [DOI] [PMC free article] [PubMed] [Google Scholar]
- 40.Georgopoulos AP, DeLong MR, Crutcher MD. Relations between parameters of step-tracking movements and single cell discharge in the globus pallidus and subthalamic nucleus of the behaving monkey. J Neurosci. 1983;3:1586–1598. doi: 10.1523/JNEUROSCI.03-08-01586.1983. [DOI] [PMC free article] [PubMed] [Google Scholar]
- 41.Crutcher MD, DeLong MR. Single cell studies of the primate putamen. II. Relations to direction of movement and pattern of muscular activity. Exp Brain Res. 1984;53:244–258. doi: 10.1007/BF00238154. [DOI] [PubMed] [Google Scholar]
- 42.Turner RS, Anderson ME. Pallidal discharge related to the kinematics of reaching movements in two dimensions. J Neurophysiol. 1997;77:1051–1074. doi: 10.1152/jn.1997.77.3.1051. [DOI] [PubMed] [Google Scholar]
- 43.DeLong MR, Crutcher MD, Georgopoulos AP. Primate globus pallidus and subthalamic nucleus: functional organization. J Neurophysiol. 1985;53:530–543. doi: 10.1152/jn.1985.53.2.530. [DOI] [PubMed] [Google Scholar]
- 44.Baker KB, Lee JY, Mavinkurve G, Russo G, Walter B, DeLong MR, Bakay RA, Vitek JL. Somatotopic organization in the internal segment of the globus pallidus in Parkinson’s disease. Exp Neurol. 2010;222:219–225. doi: 10.1016/j.expneurol.2009.12.030. [DOI] [PMC free article] [PubMed] [Google Scholar]
- 45.Alexander GE, DeLong MR. Microstimulation of the primate neostriatum. II. Somatotopic organization of striatal microexcitable zones and their relation to neuronal response properties. J Neurophysiol. 1985;53:1417–1430. doi: 10.1152/jn.1985.53.6.1417. [DOI] [PubMed] [Google Scholar]
- 46.Boraud T, Bezard E, Bioulac B, Gross CE. Ratio of inhibited-to-activated pallidal neurons decreases dramatically during passive limb movement in the MPTP-treated monkey. J Neurophysiol. 2000;83:1760–1763. doi: 10.1152/jn.2000.83.3.1760. [DOI] [PubMed] [Google Scholar]
- 47.Filion M, Tremblay L, Bedard PJ. Abnormal influences of passive limb movement on the activity of globus pallidus neurons in parkinsonian monkeys. Brain Res. 1988;444:165–176. doi: 10.1016/0006-8993(88)90924-9. [DOI] [PubMed] [Google Scholar]
- 48.Levy R, Dostrovsky JO, Lang AE, Sime E, Hutchison WD, Lozano AM. Effects of apomorphine on subthalamic nucleus and globus pallidus internus neurons in patients with Parkinson’s disease. J Neurophysiol. 2001;86:249–260. doi: 10.1152/jn.2001.86.1.249. [DOI] [PubMed] [Google Scholar]
- 49.Taha JM, Favre J, Baumann TK, Burchiel KJ. Characteristics and somatotopic organization of kinesthetic cells in the globus pallidus of patients with Parkinson’s disease. J Neurosurg. 1996;85:1005–1012. doi: 10.3171/jns.1996.85.6.1005. [DOI] [PubMed] [Google Scholar]
- 50.Pessiglione M, Guehl D, Rolland AS, Francois C, Hirsch EC, Feger J, Tremblay L. Thalamic neuronal activity in dopamine-depleted primates: evidence for a loss of functional segregation within basal ganglia circuits. J Neurosci. 2005;25:1523–1531. doi: 10.1523/JNEUROSCI.4056-04.2005. [DOI] [PMC free article] [PubMed] [Google Scholar]
- 51.Kelly RM, Strick PL. Macro-architecture of basal ganglia loops with the cerebral cortex: use of rabies virus to reveal multisynaptic circuits. Prog Brain Res. 2004;143:449–459. doi: 10.1016/s0079-6123(03)43042-2. [DOI] [PubMed] [Google Scholar]
- 52.Franz EA. Converging evidence of the basal ganglia’s role in focused action selection and inhibition of competing information. In: Bezard E, editor. Recent breakthroughs in basal ganglia research. Nova Science; New York: 2006. pp. 227–39. [Google Scholar]
- 53.Berridge KC. The debate over dopamine’s role in reward: the case for incentive salience. Psychopharmacology (Berl) 2007;191(3):391–431. doi: 10.1007/s00213-006-0578-x. [DOI] [PubMed] [Google Scholar]
- 54.Shen W, Flajolet M, Greengard P, Surmeier DJ. Dichotomous dopaminergic control of striatal synaptic plasticity. Science. 2008;321(5890):848–51. doi: 10.1126/science.1160575. [DOI] [PMC free article] [PubMed] [Google Scholar]
- 55.Schultz W. Getting Formal with Dopamine and Reward. Neuron. 2002;36:241–263. doi: 10.1016/s0896-6273(02)00967-4. [DOI] [PubMed] [Google Scholar]
- 56.Schultz W. Updating Dopamine Reward Systems. Curr Opin Neurobiol. 2012 doi: 10.1016/j.conb.2012.11.012. Epub ahead of print. [DOI] [PMC free article] [PubMed] [Google Scholar]
- 57.Dowd E, Dunnett SB. Movement without dopamine: striatal dopamine is required to maintain but not to perform learned actions. Biochem Soc Trans. 2007;35(Pt 2):428–32. doi: 10.1042/BST0350428. [DOI] [PubMed] [Google Scholar]
- 58.Lemaire N, Hernandez LF, Hu D, Kubota Y, Howe MW, Graybiel AM. Effects of dopamine depletion on LFP oscillations in striatum are task- and learning-dependent and selectively reversed by L-DOPA. Proc Natl Acad Sci U S A. 2012;109(44):18126–18131. doi: 10.1073/pnas.1216403109. [DOI] [PMC free article] [PubMed] [Google Scholar]
- 59.Dejean C, Nadjar A, Le Moine C, Bioulac B, Gross CE, Boraud T. Evolution of the dynamic properties of the cortex-basal ganglia network after dopaminergic depletion in rats. Neurobiol Dis. 2012;46(2):402–13. doi: 10.1016/j.nbd.2012.02.004. [DOI] [PubMed] [Google Scholar]
- 60.Gittis AH, Hang GB, LaDow ES, Shoenfeld LR, Atallah BV, Finkbeiner S, Kreitzer AC. Rapid target-specific remodeling of fast-spiking inhibitory circuits after loss of dopamine. Neuron. 2011;71(5):858–68. doi: 10.1016/j.neuron.2011.06.035. [DOI] [PMC free article] [PubMed] [Google Scholar]
- 61.Indovina I, Sanes JN. On somatotopic representation centers for finger movements in human primary motor cortex and supplementary motor area. Neuroimage. 2001;13:1027–34. doi: 10.1006/nimg.2001.0776. [DOI] [PubMed] [Google Scholar]
- 62.Mayka MA, Corcos DM, Leurgans SE, Vaillancourt DE. Three-dimensional locations and boundaries of motor and premotor cortices as defined by functional brain imaging: a meta-analysis. Neuroimage. 2006;31(4):1453–1474. doi: 10.1016/j.neuroimage.2006.02.004. [DOI] [PMC free article] [PubMed] [Google Scholar]
- 63.Behrens TE, Johansen-Berg H, Woolrich MW, Smith SM, Wheeler-Kingshott CA, Boulby PA, Barker GJ, Sillery EL, Sheehan K, Ciccarelli O, Thompson AJ, Brady JM, Matthews PM. Non-invasive mapping of connections between human thalamus and cortex using diffusion imaging. Nat Neurosci. 2003;6(7):750–757. doi: 10.1038/nn1075. [DOI] [PubMed] [Google Scholar]