Summary
Objectives
This paper aims to predict childhood obesity after age two, using only data collected prior to the second birthday by a clinical decision support system called CHICA.
Methods
Analyses of six different machine learning methods: RandomTree, RandomForest, J48, ID3, Naïve Bayes, and Bayes trained on CHICA data show that an accurate, sensitive model can be created.
Results
Of the methods analyzed, the ID3 model trained on the CHICA dataset proved the best overall performance with accuracy of 85% and sensitivity of 89%. Additionally, the ID3 model had a positive predictive value of 84% and a negative predictive value of 88%. The structure of the tree also gives insight into the strongest predictors of future obesity in children. Many of the strongest predictors seen in the ID3 modeling of the CHICA dataset have been independently validated in the literature as correlated with obesity, thereby supporting the validity of the model.
Conclusions
This study demonstrated that data from a production clinical decision support system can be used to build an accurate machine learning model to predict obesity in children after age two.
Keywords: Obesity, artificial intelligence, decision trees, Bayes theorem, predictive analytics
1. Introduction
Childhood obesity has increased at an alarming rate in the United States in the past few decades. As stated by the CDC, “The percentage of children aged 6–11 years in the United States who were obese increased from 7% in 1980 to nearly 18% in 2010. Similarly, the percentage of adolescents aged 12–19 years who were obese increased from 5% to 18% over the same period” [1].
Much research has been done to identify interventions to prevent and remediate obesity in children, since obesity in adulthood has several adverse health effects [2–5]. Prevention may be key since reversing already established obesity in grade school children and adolescents through exercise, nutrition, and other lifestyle interventions is difficult. Poor eating habits and a sedentary lifestyle are often ingrained at this point and hard to change [6, 7].
Typically, a child is not considered obese until approximately 2 years of age. Before then, Body Mass Index (BMI) percentiles cannot be reliably calculated due to variability of growth patterns in infants. Along with more stable growth, mature eating patterns become more developed by age two since children no longer drink formula and reduce consumption of milk in favor of adult foods [8, 9]. Therefore, this age is a prime target for obesity intervention. If clinicians could predict at age two which children would later become obese based on clinical data collected for that child before age two, early intervention programs could target those at risk.
Machine learning techniques provide an attractive modeling method for analyzing early clinical data to predict later obesity in children. Such techniques can encompass the complexity of this problem more completely than simpler modelling techniques like linear regression and other statistical techniques [10]. Clinical data are inherently noisy, though, and machine learning techniques provide more robust methods for handling missing and incorrectly recorded data. We hypothesized that machine learning could be an effective approach to predicting future obesity among children younger than two years.
1.1 Survey of the Literature
A limited number of publications exist that address using machine learning techniques to predict childhood obesity. Three describe algorithms only and do not provide actual experimental results [11–13]. Of the remaining three, one [14] uses data from 9 to 11 year olds to predict obesity, an age when obesity is believed by many to be well established and harder to remediate. Another [15] finds data with specific idiosyncrasies and improves the performance only on that tiny subset (12 subjects). A study by Zhang et al. [16] is the only one that comprehensively analyzes machine learning techniques to predict childhood obesity.
Zhang et al. do an excellent job of comparing the performance metrics of several machine learning techniques. However, the best sensitivity (which the study notes is most important in predicting obesity) of any of the algorithms, based on the dataset used, was 62%, when looking at obesity prediction after the second birthday. Zhang et al. do not provide accuracy or specificity for this analysis.
We suspected that Zhang et al’s work could be improved by considering a different set of attributes for the model. Zhang’s group analyzed the Wirral child database, which was limited to basic demographics (like sex) and biometrics (like height, weight, and BMI). By using a broader range of attributes collected by a production clinical decision support system, we hypothesized, the model accuracy can be improved, and some light can be shed on what predictors are most influential in determining future obesity in children.
2. Objectives
The goal of this study was to leverage machine learning techniques to analyze clinical data collected before age 2 to predict future obesity in children after the second birthday. Clinicians could use such a model to identify candidate children for early obesity interventions, thereby targeting at risk children at a critical age of development related to establishing eating and lifestyle habits.
3. Methods
3.1 Clinical Dataset Used for Analysis
Data collected from a pediatric clinical decision support system called CHICA (Child Health Improvement through Computer Automation) [17] were used for the analysis. The data include nine years of clinical information collected from 4 different community health centers affiliated with Eskenazi Health, a safety net hospital system. The CHICA system provides clinical decision support to physicians based on dynamic patient questionnaires and past clinical history. The CHICA system presents a parent with a 20 question survey (►Figure 1) with questions tailored to the pediatric patient based on age, other demographics, and previous clinical history. The survey is dynamic, presenting a unique set of questions to every child at every visit. The parent fills out the questionnaire on an electronic tablet or scannable paper form, and a medical assistant or nurse enters biometrics such as height, weight, etc. The system then uses these data as input to create a custom physician worksheet (►Figure 2) with six dynamically generated prompts based on the parent’s responses to the questionnaire and previous clinical history.
Fig. 1.

CHICA 20 question survey
Fig. 2.
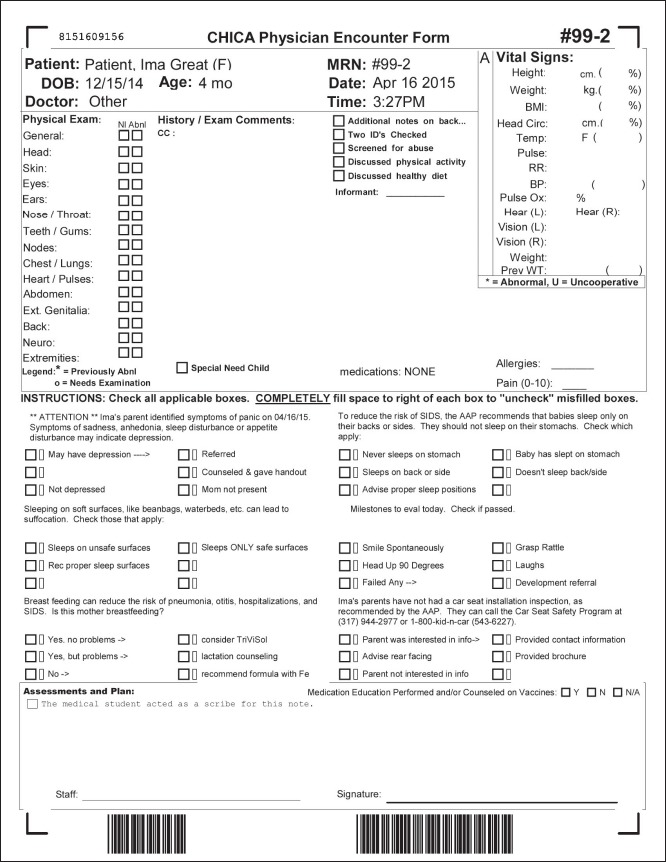
Physician worksheet
In this analysis, the CHICA data were mined for all children with at least one BMI percentile recorded after the second birthday, and at least one visit prior to age 2. The data was pulled from the parent questionnaire, the physician worksheet, and vitals collected by the clinical staff. The parent questionnaire and physician worksheets were optional and not always fully completed. The cohort was comprised of 7 519 patients. ►Table 1 describes some basic demographics of the cohort.
Table 1.
Demographics
| Sex | |
|---|---|
| Male | 51% |
| Female | 49% |
| * Race/Ethnicity | |
| Hispanic | 45% |
| Black | 43% |
| White | 10% |
| Other/Unknown | 2% |
| Asian Pacific / Islander | < 1% |
| Insurance | |
| Medicaid | 65% |
| Unknown | 31% |
| Self Pay | 3% |
| Commercial | 1% |
* Note: Race/Ethnicity is not reported using the Office of Management and Budget coding standard. The data was received from an external EHR and could not be standardized by CHICA.
The patient population was primarily minority race and low income. Since CHICA has been running for 9 years, the cohort consists only of children ranging from age 2 to 10. In the data set, 167 attributes collected before the patient’s second birthday were analyzed for each patient. A data label of OBESE (yes/no) was created based on the BMI percentile after the second birthday. If the child had a BMI percentile greater than or equal to 95 percent based on CDC growth curves [9] at any point after the second birthday, the child was labeled as obese.
Since multiple answers could exist for a single attribute across multiple visits, one value needed to be chosen for each patient. For categorical attributes, the most common value was chosen. For height and weight, the only non-categorical attributes analyzed, nominal attributes were created to indicate whether a child was overweight, obese, tall, or very tall at different age points (2, 6, 12, 18, and 24 months), based on percentiles published by the CDC.
After data transformations, the dataset contained one row per patient with 167 attributes plus the OBESE category label. If an attribute did not exist for the patient, the coded value MISSING was recorded.
3.2 Machine Learning Models
Since the data set included categorical data, Bayes and Decision Tree classifiers were the most appropriate models. In principle, the categorical attributes can be converted to numerical ones by assigning numerical codes to their values, allowing the application of a quantitative classifier model such as an artificial neural network. However, we felt the arbitrary nature of such attribute conversion would make the model non-intuitive and non-robust. Therefore, six models were tested in our study: RandomTree, RandomForest, ID3, J48 (Java implementation of C4.5 algorithm), NaiveBayes, and BayesNet [18].
RandomTree: considers K randomly chosen attributes at each node and does not prune the tree.
RandomForest: creates a forest of random trees and outputs the mode of the classes created by individual trees.
ID3: creates a tree based on the ID3 algorithm with no pruning.
J48: creates a tree based on the C4.5 algorithm with pruning.
NaiveBayes: creates a classifier based on the Naïve Bayes method which assumes all attributes are independent. Local search methods were used.
BayesNet: creates a classifier based on non-Naïve Bayes which does not assume all attributes are independent. Local search methods were used.
Weka [19], an open source machine learning software written in java, was used to run the analyses. The analysis for each method was run with 10 cross folds validation [20], meaning the dataset was randomly divided into 10 parts and 10 runs of the model were executed with each run consisting of one of the 10 parts being the testing data and the remaining 90% being the training data. Performance statistics were then averaged across all 10 runs. Three analyses were run over all six methods.
The first analysis applied each machine learning technique to the entire dataset with no resampling or manipulation of the data. The idea was to establish a baseline among the different machine learning methods for the given dataset.
The second analysis was similar to the first but the data were resampled. Resampling is a common technique used in statistics to select a subset of the data points for learning of a model to cope with non-uniformity of class labels. Since the obesity prevalence in this population after the second birthday was about 30%, the second analysis hoped to improve on the first by resampling the obesity categorization so that the dataset had a uniform distribution of the classification category of OBESE. Weka randomly resamples the data to balance the distribution.
In the third analysis, the goal was to find the attribute set for each of the six models with the minimum number of misclassified and unclassified values across all 10 folds. The algorithm first ran the full model over the resampled data (the analysis described in the previous paragraph). After running the full model, the algorithm then iterated through each attribute in the data set, removed the attribute, trained the model, and evaluated the accuracy. If the number of misclassified and unclassified values was less than or equal to the previous dataset’s value, the attribute was marked and the loop continued. The attribute would be added back into the dataset and the same process would continue for the remaining attributes. After removing all attributes one at a time, whichever attribute minimized the misclassified and unclassified values the most would be removed from the dataset. The new dataset was then analyzed again by removing attributes one at a time. This process continued until the next step of attribute removal decreased the accuracy. The final model was the minimum number of attributes that provided that optimal accuracy.
The accuracy of the models was evaluated using the following measures:
Sensitivity: proportion of individuals classified obese to total number of actual obese cases.
Specificity: proportion of individuals classified non-obese to total number of actual non-obese cases.
Positive predictive value: proportion of obese individuals to total number classified as obese.
Negative predictive value: proportion of non-obese individuals to total number classified as non-obese.
Overall accuracy: the number of correctly classified values over the total size of the cohort.
4. Results
The first analysis with no resampling provided fairly poor results. ►Table 2 details the overall accuracy, sensitivity, specificity, positive predictive value (PPV), and negative predictive value (NPV) of each of the models. The best sensitivity was achieved by the BayesNet model at .58, which is fairly poor.
Table 2.
Analysis 1 metrics (RT - RandomTree, RF - RandomForest, NB - NaiveBayes, BN - BayesNet)
| Method | Accuracy | Sensitivity | Specificity | PPV | NPV |
|---|---|---|---|---|---|
| RT | 69% | .26 | .88 | .50 | .73 |
| RF | 69% | .26 | .88 | .50 | .73 |
| ID3 | 62% | .40 | .75 | .41 | .74 |
| J48 | 70% | .29 | .88 | .51 | .73 |
| NB | 66% | .52 | .71 | .45 | .77 |
| BN | 63% | .58 | .68 | .65 | .62 |
The second analysis attempted to improve on the performance of the previous models by resampling the data so there was a uniform distribution of data points classified as obese and not obese. ►Table 3 details the same set of accuracy measures as reported for the non-resampled models.
Table 3.
Analysis 2 metrics
| Method | Accuracy | Sensitivity | Specificity | PPV | NPV |
|---|---|---|---|---|---|
| RT | 84% | .88 | .80 | .81 | .87 |
| RF | 86% | .86 | .85 | .84 | .86 |
| ID3 | 84% | .88 | .82 | .83 | .88 |
| J48 | 79% | .82 | .76 | .78 | .81 |
| NB | 63% | .58 | .69 | .65 | .62 |
| BN | 63% | .58 | .68 | .65 | .62 |
The tree models improved significantly. The non-Naïve Bayes model remained the same and the Naïve Bayes model actually degraded slightly in performance.
The third analysis aimed to improve upon the models created in the second analysis by removing “noisy” attributes. It iterated through each attribute in the model to see if the attribute could be removed without negatively affecting the accuracy of the model. ►Table 4 details the same set of accuracy measures as reported for the previous two analyses. Only two of the six models showed improvement when removing attributes.
Table 4.
Analysis 3 metrics
| Method | Accuracy | Sensitivity | Specificity | PPV | NPV |
|---|---|---|---|---|---|
| ID3 | 85% | .89 | .83 | .84 | .88 |
| NB | 65% | .59 | .70 | .66 | .63 |
The data illustrate a slight increase in the performance of both ID3 and Naïve Bayes over the previous analysis. The accuracy measures modestly improved but the size of the attribute set necessary for the model was significantly reduced. The ID3 model was reduced from 167 attributes to 87 attributes. The NaiveBayes model was reduced to 107 attributes.
4.1 ID3 Structure and Obesity Prediction
Based on the results of the three analyses, the Random tree and ID3 methods had the highest sensitivity. The ID3 model was slightly more sensitive in predicting obesity.
The structure of the resulting ID3 tree is also important to consider. Since the ID3 algorithm builds the tree in a way that maximizes the reduction in entropy at each level, the structure of the tree gives us some insight into what the most important predictors of future obesity are in this cohort. In ►Figure 3, we see a detail of attributes contained in the first 3 levels of the tree. Please refer to the supplementary material for details about each attribute. The percentages within the tree indicate the percentage of patients with the given characteristics that were obese after age two.
Fig. 3.
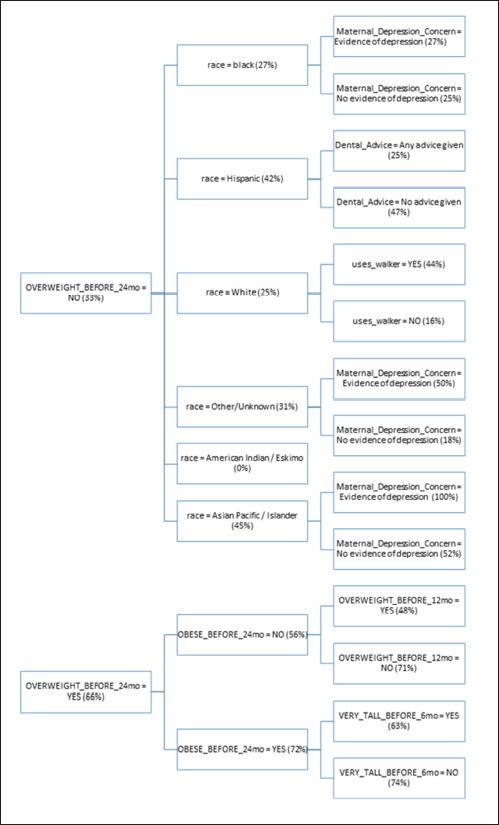
Attributes contained in the first three levels of the tree.
4.2 Clinical Applications for the Decision Tree
The ID3 tree has maximum depth of 24. Since a path in the decision tree corresponds to an implication logical operator whose premise is a conjunction of all the attribute tests, this implies that the model, thus constructed, is not exhaustively testing all attributes along all paths. Further, this implies that in theory, at most, a 24 step dynamic questionnaire could be created to move through the decision tree nodes to predict future chance of obesity based on answers to the earlier questions. Since the RandomTree method has comparable performance to the ID3 method and the algorithm allows a maximum depth value to be defined, we can examine how performance metrics change based on tree depth. ►Figures 4 through 6 illustrate the relationship between tree depth and accuracy, sensitivity, and area under the ROC curve for the RandomTree method.
The performance metrics increase fairly steeply as the tree gets deeper but level off around 17 to 20 questions, depending on the metric of interest. Once again, this indicates that the model is a non-exhaustive one, using only a relatively small set of attributes along any path. Researchers can also use this information to determine the tradeoff of respondent burden, i.e. number of questions to answer, versus the performance of different metrics.
5. Discussion
The most influential attribute of the tree is OVERWEIGHT_BEFORE_24mo. In the pediatric community, there is not clear evidence that being overweight prior to age two is correlated with later obesity status. From the tree, we see that a child is twice as likely to be obese after age two if the child is overweight at some point prior to 24 months. Being obese before 24 months slightly increases the chances the child will later be obese to 72%. What is interesting, however, is that if a child is not obese before age 24 months and is not overweight before 12 months, they are nearly as likely (71%) to be obese after age two. That seems to indicate that being overweight between age 12 and 24 months is a key risk factor for obesity after the second birthday. Furthermore, it is more of a risk factor if the child was not overweight prior to age 12 months. In other words, accelerated weight gain seems to be the real risk factor.
We also note that being very tall before 6 months old appears to be somewhat protective against obesity. Children who are both overweight and obese prior to 24 months have a 72% chance of being obese later, but if they are very tall prior to 6 months, that risk is reduced to 63%. This seems to indicate that if a child is proportionally large at a young age, i.e. both very heavy and very tall, the child could still have a healthy weight.
If a child is not overweight prior to 24 months, we see that minority race increases the chance of being obese after age two. A child has a 34% chance of later being obese if non-white but a 25% chance if white. Race has been independently verified in the literature as a predictor of future obesity in children which further validates our model [21]. Children of minority race and ethnicity are at higher risk of obesity than non-Hispanic white children.
The model also shows children that are not overweight before 24 months with race black, Asian Pacific / Islander, or Other/Unknown are slightly more likely to become obese if they have evidence of depression in a parent (28%) versus no evidence (25%). In the literature, there are known correlations between maternal depression and increased risk of childhood obesity [22].
For white children that are not overweight before 24 months, using a walker seems to be a significant risk factor for obesity. A child who uses a walker is nearly 3 times as likely to be obese after two years, even if the child was not overweight before 24 months. The authors are not aware of any literature previously associating walkers and childhood obesity.
Finally, having the pediatrician provide any dental advice at all seems to be protective against later obesity in Hispanic children. The overall risk of obesity in Hispanic children drops from 42% to 25% when the physician provides dental advice. Part of the dental advice provided by CHICA includes reducing bottle usage and night feeding which may explain the reduction in obesity. Previous work has suggested the combined reduction of weight gain and dental caries from dietary interventions, particularly in Native North Americans [23].
After analyzing the structure of the tree, it appears that the basic model is valid since several of the most influential attributes in the tree have been independently verified as predictors of future obesity.
As with any study, the analyses in this paper could be improved and expanded. One notable area of exploration should be to delve deeper into the Bayes models. Local search methods were used in this analysis with fairly poor results. Such methods only employ a local search algorithm (such as hill-climbing) over possible model structures (topologies) to determine a “good” candidate in terms of explaining the data. Convergence to a local maximum, rather than a global one, is a common problem with such local search methods. Global methods, which employ global search over the model structure space, require considerably more computing power than their local counterparts but have the potential to provide considerably better predictive accuracy, by avoiding relatively poor local minima. Constructing the best possible Bayesian network is, in general, a computationally hard problem whose complexity grows exponentially with the number of attributes. The use of probabilistic semi-global search methods (such as simulated annealing and genetic algorithms) can be explored towards this end.
These analyses considered the entire CHICA dataset from its inception. By nature, clinical decision support systems are dynamic and new rules are introduced and old rules are retired on an ongoing basis. It would be interesting to re-analyze the data in a more abbreviated timeframe, such as within the last year to see how the model changes. The idea is that if the rule set is more cohesive the model’s predictive power could be stronger.
In terms of data, a limitation of this analysis is that a single erroneous weight or height measure after age two could incorrectly mark the child as obese. However, the fact that the screening tool is highly accurate, in spite of this, shows how well the machine learning models can handle errors and missing data. Additionally, height and weight were modeled as discrete versus continuous values due to required input types for the machine learning models employed, which could have potentially reduced the statistical power of the resulting models. Another limitation of the data is that the population is mostly minority, low income, and concentrated in one particular geographic area. Finally, race and ethnicity are reported as a single value in the dataset instead of being properly split into two categories.
Additionally, further work could be done in modeling the data to predict obesity for ages older than 2 to see if the data recorded before the second birthday can predict obesity at ages 3, 4, and older. The resulting trees could possibly contain different attributes for predicting short term childhood obesity versus long term obesity.
Even with these limitations, our model improves upon analyses such as [24] by using supervised machine learning techniques to discover novel associations not discovered by traditional statistical techniques. By using robust machine learning techniques, our model is able to handle the missing data of a clinical dataset without the need to carefully curate a longitudinal dataset for analysis.
6. Conclusions
In conclusion, this study demonstrated that data from a production clinical decision support system can be used to build a valid and accurate machine learning model to predict obesity in children. Real clinical data are, by nature, messy with missing and erroneous values. In spite of this, our model performed well and provided a high level of accuracy and sensitivity.
Our model was highly accurate at 85% and sensitive at nearly 90%. Many of the most influential nodes in the tree have been independently validated in the literature as well.
A further area of research would be to incorporate the tiered structure questionnaire indicated by the ID3 tree into the CHICA clinical decision support system to screen children at the two year checkup to see which children are likely to become obese. This would provide clinicians with the tools to provide targeted interventions at a critical age of development to stop obesity before it has a chance to take hold. By doing so, they can hopefully protect those children against the epidemic of obesity.
Supplementary Material
Fig. 4.
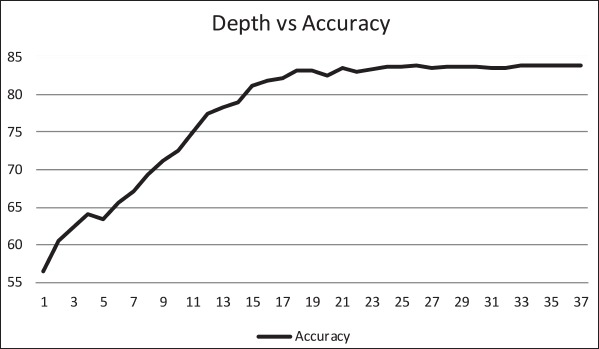
Relationship between tree depth and accurancy.
Fig. 5.
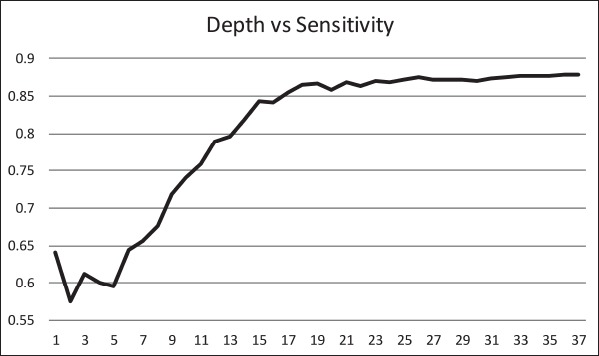
Relationship between tree depth and sensitivity.
Fig. 6.
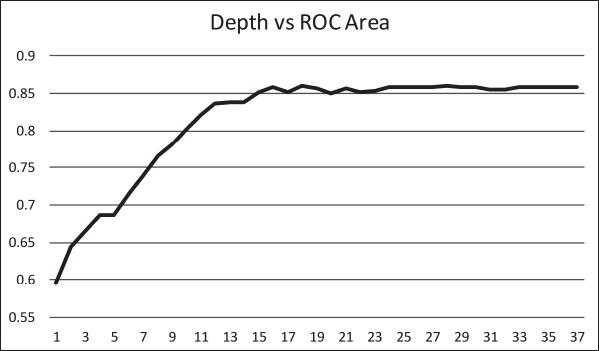
Relationship between tree depth and area under the ROC curve.
Acknowledgments
I would like to thank Htaw Htoo for his help in pulling data for these analyses. Development of the CHICA system was supported, in part, by grants number 1R01HS020640–01A1, R01 HS017939, and 1R01HS018453–01 from the Agency for Healthcare Research and Quality, and grants number R01 LM010031Z and R01LM010923 from the National Library of Medicine.
Footnotes
Clinical Relevance Statement
The results of our research provide a pathway for creating a highly accurate dynamic questionnaire to screen very young children for future obesity. It provides a key screening tool to facilitate early obesity intervention in children. We plan to implement this screener in the CHICA system and study its effectiveness.
Conflicts of Interest
The authors declare that they have no conflicts of interest in the research.
Protection of Human and Animal Subjects
The study was performed in compliance with the World Medical Association Declaration of Helsinki on Ethical Principles for Medical Research Involving Human Subjects and was reviewed by Indiana University Institutional Review Board.
References
- 1.CDC. [12/3/2013]. Available from: http://www.cdc.gov/healthyyouth/obesity/facts.htm.
- 2.Khan NA, Raine LB, Drollette ES, Scudder MR, Pontifex MB, Castelli DM, Donovan SM, Evans EM, Hillman CH. Impact of the FITKids Physical Activity Intervention on Adiposity in Prepubertal Children. Pediatrics 2014; 133: e875–e883. [DOI] [PMC free article] [PubMed] [Google Scholar]
- 3.Mollard RC, Senechal M, MacIntosh AC, Hay J, Wicklow BA, Wittmeier KD, Sellers EA, Dean HJ, Ryner L, Berard L, McGavock JM. Dietary determinants of hepatic steatosis and visceral adiposity in overweight and obese youth at risk of type 2 diabetes. The American journal of clinical nutrition 2014; 99: 804–812. [DOI] [PubMed] [Google Scholar]
- 4.Wing RR, Bolin P, Brancati FL, Bray GA, Clark JM, Coday M, Crow RS, Curtis JM, Egan CM, Espeland MA, Evans M, Foreyt JP, Ghazarian S, Gregg EW, Harrison B, Hazuda HP, Hill JO, Horton ES, Hubbard VS, Jakicic JM, Jeffery RW, Johnson KC, Kahn SE, Kitabchi AE, Knowler WC, Lewis CE, Maschak-Carey BJ, Montez MG, Murillo A, Nathan DM, Patricio J, Peters A, Pi-Sunyer X, Pownall H, Reboussin D, Regen-steiner JG, Rickman AD, Ryan DH, Safford M, Wadden TA, Wagenknecht LE, West DS, Williamson DF, Yanovski SZ. Cardiovascular effects of intensive lifestyle intervention in type 2 diabetes. New England journal of medicine 2013; 369: 145–154. [DOI] [PMC free article] [PubMed] [Google Scholar]
- 5.Wadden TA, Volger S, Sarwer DB, Vetter ML, Tsai AG, Berkowitz RI, Kumanyika S, Schmitz KH, Diewald LK, Barg R, Chittams J, Moore RH. A two-year randomized trial of obesity treatment in primary care practice. New England journal of medicine 2011; 365: 1969–1979. [DOI] [PMC free article] [PubMed] [Google Scholar]
- 6.Pahor M, Guralnik JM, Ambrosius WT, Blair S, Bonds DE, Church TS, Espeland MA, Fielding RA, Gill TM, Groessl EJ, King AC, Kritchevsky SB, Manini TM, McDermott MM, Miller ME, Newman AB, Rejeski WJ, Sink KM, Williamson JD. Effect of structured physical activity on prevention of major mobility disability in older adults: the LIFE study randomized clinical trial. JAMA the journal of the American Medical Association 2014; 311: 2387–2396. [DOI] [PMC free article] [PubMed] [Google Scholar]
- 7.Davis CL, Pollock NK, Waller JL, Allison JD, Dennis BA, Bassali R, Melendez A, Boyle CA, Gower BA. Exercise dose and diabetes risk in overweight and obese children: a randomized controlled trial. JAMA the journal of the American Medical Association 2012; 308: 1103–1112. [DOI] [PMC free article] [PubMed] [Google Scholar]
- 8.Monteiro PO, Victora CG. Rapid growth in infancy and childhood and obesity in later life--a systematic review. Obesity reviews: an official journal of the International Association for the Study of Obesity 2005; 6: 143–154. [DOI] [PubMed] [Google Scholar]
- 9.CDC. [6/27/2014]. Available from: http://www.cdc.gov/healthyweight/assessing/bmi/childrens_bmi/about_childrens_bmi.html.
- 10.Michie D, Spiegelhalter DJ, Taylor CC. Machine learning, neural and statistical classification. 1994. [Google Scholar]
- 11.Muhamad Adnan M, Husain W, Damanhoori F. A survey on utilization of data mining for childhood obesity prediction. Information and Telecommunication Technologies (APSITT) 2010; 1–6. [Google Scholar]
- 12.Novak B, Bigec M. Application of artificial neural networks for childhood obesity prediction. Artificial Neural Networks and Expert Systems 1995; 377–380. [Google Scholar]
- 13.Novak B, Bigec M. Childhood obesity prediction with artificial neural networks. Computer-Based Medical Systems 1996; 77–82. [Google Scholar]
- 14.Adnan MHBM, Husain W, Rashid N. Parameter Identification and Selection for Childhood Obesity Prediction Using Data Mining. 2nd International Conference on Management and Artificial Intelligence 2012. [Google Scholar]
- 15.Adnan M, Hariz M, Husain W, Rashid A. A hybrid approach using Naïve Bayes and Genetic Algorithm for childhood obesity prediction. Computer & Information Science (ICCIS) 2012; 281–285. [Google Scholar]
- 16.Zhang S, Tjortjis C, Zeng X, Qiao H, Buchan I, Keane J. Comparing data mining methods with logistic regression in childhood obesity prediction. Information Systems Frontiers 2009; 11: 449–460. [Google Scholar]
- 17.Anand V, Biondich PG, Liu G, Rosenman M, Downs SM. Child Health Improvement through Computer Automation: the CHICA system. Studies in health technology and informatics 2004; 107: 187–191. [PubMed] [Google Scholar]
- 18.Russell S, Norvig P. Artificial Intelligence: A modern approach. Prentice-Hall, Englewood Cliffs: 1995; 25. [Google Scholar]
- 19.Hall M, Frank E, Holmes G, Pfahringer B, Reutemann P, Witten IH. The WEKA data mining software: an update. SIGKDD Explor Newsl 2009; 11: 10–18. [Google Scholar]
- 20.Han J, Kamber M. Data mining: concepts and techniques. Morgan Kaufmann Publishers, Burlington: 2000. [Google Scholar]
- 21.Singh GK, Kogan MD, Van Dyck PC, Siahpush M. Racial/ethnic, socioeconomic, and behavioral determinants of childhood and adolescent obesity in the United States: analyzing independent and joint associations. Annals of epidemiology 2008; 18: 682–695. [DOI] [PubMed] [Google Scholar]
- 22.Gross RS, Velazco NK, Briggs RD, Racine AD. Maternal Depressive Symptoms and Child Obesity in Low-Income Urban Families. Academic Pediatrics 2013; 13: 356–363. [DOI] [PubMed] [Google Scholar]
- 23.Maupome G, Karanja N, Ritenbaugh C, Lutz T, Aickin M, Becker T. Dental caries in American Indian toddlers after a community-based beverage intervention. Ethnicity & disease 2010; 20: 444–450. [PMC free article] [PubMed] [Google Scholar]
- 24.Morandi A, Meyre D, Lobbens S, Kleinman K, Kaakinen M, Rifas-Shiman SL, Vatin V, Gaget S, Pouta A, Hartikainen AL, Laitinen J, Ruokonen A, Das S, Khan AA, Elliott P, Maffeis C, Gillman MW, Jarvelin MR, Froguel P. Estimation of newborn risk for child or adolescent obesity: lessons from longitudinal birth cohorts. PloS one 2012; 7: e49919. [DOI] [PMC free article] [PubMed] [Google Scholar]
- 25.Kroenke K, Spitzer RL, Williams JB. The Patient Health Questionnaire-2: validity of a two-item depression screener. Medical care 2003; 41: 1284–1292. [DOI] [PubMed] [Google Scholar]
Associated Data
This section collects any data citations, data availability statements, or supplementary materials included in this article.


