

Summary
Background
Adoption of a common data model across health systems is a key infrastructure requirement to allow large scale distributed comparative effectiveness analyses. There are a growing number of common data models (CDM), such as Mini-Sentinel, and the Observational Medical Outcomes Partnership (OMOP) CDMs.
Objectives
In this case study, we describe the challenges and opportunities of a study specific use of the OMOP CDM by two health systems and describe three comparative effectiveness use cases developed from the CDM.
Methods
The project transformed two health system databases (using crosswalks provided) into the OMOP CDM. Cohorts were developed from the transformed CDMs for three comparative effectiveness use case examples. Administrative/billing, demographic, order history, medication, and laboratory were included in the CDM transformation and cohort development rules.
Results
Record counts per person month are presented for the eligible cohorts, highlighting differences between the civilian and federal datasets, e.g. the federal data set had more outpatient visits per person month (6.44 vs. 2.05 per person month). The count of medications per person month reflected the fact that one system’s medications were extracted from orders while the other system had pharmacy fills and medication administration records. The federal system also had a higher prevalence of the conditions in all three use cases. Both systems required manual coding of some types of data to convert to the CDM.
Conclusions
The data transformation to the CDM was time consuming and resources required were substantial, beyond requirements for collecting native source data. The need to manually code subsets of data limited the conversion. However, once the native data was converted to the CDM, both systems were then able to use the same queries to identify cohorts. Thus, the CDM minimized the effort to develop cohorts and analyze the results across the sites.
Keywords: Common data model, big data, comparative effectiveness
1. Introduction
Worldwide, the business of healthcare research and quality improvement is increasingly focused on “big data” [1–3]. Evidence of the transformation is that observational outcomes from electronic health record (EHR) systems are increasingly important in comparative effectiveness analyses [4, 5].
Administrative claims databases have long been used (and criticized) for secondary analysis in research [6, 7]. However, the increasing adoption of EHRs as part of the Meaningful Use incentive program along with the availability of Medicare Part-D databases for outpatient prescription drug claims is spurring renewed interest in observational comparative effectiveness studies using secondary datasets [8, 9]. EHRs may become the focus of clinical effectiveness as informatics tools prove effective at divining knowledge and wisdom [10–12]. Big data research will certainly be lower cost than clinical trials, estimated between a low of $60 to $31 million to a high of $100 to $67 million for phase II or phase III trials, respectively [13]. The FDA has demonstrated its capability to research drug safety questions with its Mini-Sentinel System, a distributed electronic health data safety monitoring system [14, 15].
Adoption of a common data model (CDM) across health care systems is a key infrastructure requirement to allowing large scale distributed comparative effectiveness research [16]. Without a CDM, the investment in developing algorithms to identify cases and perform analyses is not transferrable to other organizations. Differences in data models and phenotyping algorithms across organizations may have contributed to the significant variance in results across sites seen in a recent review of rofecoxib [17].
2. Objective
To provide a case report of the challenges of moving a federal and civilian health system into a CDM [18], the Observational Medical Outcomes Partnership (OMOP) with three comparative effectiveness use cases. Systematic differences between data sources are highlighted in the context of the cohort selection.
3. Methods
The two health systems participating in the study were a community system, Partners Healthcare in Massachusetts (Partners), and a federal system, the Veterans Affairs (VA) MidSouth Healthcare Network (VISN9).
Partners, the larger of the two systems with twelve acute care hospitals, was ahead of many hospitals in mandating use of electronic systems in 2007 [19]. Partners harvested their systems to create a d e-identified research patient data repository used for this study.
The federal system, MidSouth Healthcare Network (VISN9), included six hospital systems in Tennessee, Kentucky, and West Virginia. VISN9, as is true of the VA healthcare system overall, was an early adopter of electronic records. Although electronic charts were used exclusively at the VA, documentation received from outsourced fee based care was sometimes incomplete or not machine readable.
The OMOP CDM (Version 4) used in this study, selected after a syntactic and semantic interoperability review described elsewhere [20], was developed by a consortium of groups including PhRMA, the FDA, and the Foundation of the National Institutes of Health [21]. The OMOP CDM transforms observational data, both administrative and clinical, standardizing the content and format of the data allowing the use of common queries and analysis tools. The OMOP model included tools for extraction, loading, and transformation (ETL) to vocabularies described elsewhere [21–23]. The electronic data used in this study included administrative billing data and extended to laboratory results, physician orders, pharmacy dispensing, and medication administration. The OMOP data were demographics, visits, procedures, observations, medications, conditions, and death.
Cohort Development: Cohorts were developed for three comparative effectiveness use cases comparing emerging cardiac drug therapies to treatment standards, e.g. warfarin and dabigatran among patients with (1) atrial fibrillation, and (2) venous thromboembolism and clopidogrel and prasugrel among (3) patients with drug eluting stents. All patients hospitalized from January 1, 2009 to June 30, 2012 were eligible for inclusion in the clinical use cases. The VA performed the OMOP ETL process on all hospitalized patients during the study period and Partners conducted an ETL on all hospitalized patients meeting the first inclusion/exclusion step (►Figure 1). The project used standard sequel query language (SQL) using concepts from the CDM to develop the cohort according to inclusion and exclusion criteria described in ►Figure 1.
Fig. 1.
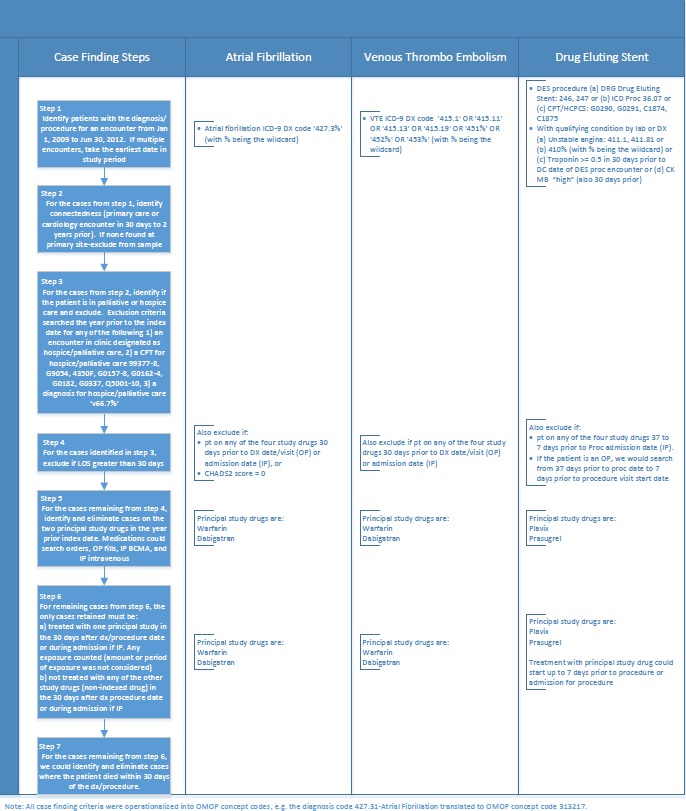
Use case inclusion exclusion criteria
4. Results
►Table 1 presents a summary description of the two organizations in the study, and ►Table 2 presents a summary of the data record counts for the eligible population. We used percent of records loaded from the source to the CDM as a measure of data quality as have other studies [22–25]. The eligible population at the VA and Partners system differed not only in funding sources but also in representation of females (3% vs. 45%, respectively). The Partners health system was larger than VISN9. The higher ratio of inpatient to outpatient visits at Partners may reflect its tertiary-care model vs. the VA’s comprehensive care model. There were some differences in billing datasets such as the lack of Ambulatory Patient Classification coding at the VA.
Table 1.
Population and organizational characteristics
| Description | VA VISN9 (6 Hospital Systems) | Partners (2 Hospital Systems) |
|---|---|---|
| Ownership | Federally owned budget-based costs of care | Not for profit, fee for service |
| Revenue-Partners/Cost-VA (billions) | $2.3 | $6.1 |
| Physicians/providers | 1 544 | 6 400 |
| Beds | 1 676 | 2 700 |
| Admissions | 39 987* | 151 000 |
| OP Visits | 3 283 572** | 4 300 000 |
| Percent electronic health record (estimate) | 90–95% | Outpatient 95% Inpatient 20% |
| Average Age | 67 Years | 66 Years |
| Percent Females | 3% | 45% |
| Percent Caucasian | 82% | 81% |
| Percent African/American | 14% | 8% |
| Percent Other Unknown | 4% | 11% |
*VA admissions do not include 34% non-VA bed days
**VA outpatient visits do not include 11% non-VA outpatient visits
Table 2.
Records in OMOP Common Data Model for eligible persons
| Data Category | Percent of Qualified Records for 60 Study Months | Rows per Person Month | ||
|---|---|---|---|---|
| VISN9 (n=21 002) | Partners (n=25 641) | VISN9 | Partners | |
| Drug Exposure – Subset* | 99.0% (out of 556 894) | 94.9% (out of 215 145) | 0.44 | 0.13 |
| Condition Exposure | 100.0% (out of 8 582 589) | 90.2% (out of 6 909 958) | 6.81 | 4.05 |
| Observations – Subset** | 99.8% (out of 2 579 109) | 100.0% (out of 2 226 963) | 2.04 | 1.45 |
| Procedures | 99.8% (out of 10 007 359) | 99.28% (out of 8 011 290) | 7.92 | 5.17 |
| Visits/encounters | 100.0% (out of 8 112 358) | 100.0% (out of 3 147 382) | 6.44 | 2.05 |
| Deaths | 100.0% (out of 5 909) | 94.0% (out of 5 344) | 0.005 | 0.003 |
*Partners native drug data used multiple drug coding standards, some of which were not included in the OMOP crosswalks to RxNorm. Since the uses cases did not require dose or formulation we identified drugs with string searches for generic and trade names for only the drugs used in study and manually coded them to the OMOP coding standard for drugs (RxNorm).
**Laboratory data in observations required manual coding because many laboratory tests were profiled without the OMOP coding standard for laboratory (LOINC). For example, about 16% of Prothrombin/INR test results were missing a LOINC code.
The biggest difference in record counts between the two sites was in the number of visits per person month – the VA had more than three times as many visits as Partners (6.44 vs. 2.05 per person month, respectively). There was a greater prevalence of outpatient vs. inpatient visits in the VA when compared with Partners. However, the VA also used “visits” to document professional services and mental health services in inpatient stays as required by VHA Directive 2009–002, Patient Care Data Capture [26]. For example, for a VA inpatient with a 28 day stay, the patient could have an average of 7 visits per day including group therapy, chaplain, pulmonary therapy, and the nursing unit. The ratio of deaths per person month was also higher at the VA (0.005 vs. 0.003), a possible reflection of more comorbidities [27].
The larger number of visits at the VA may account in part for a larger count of diagnoses at the VA vs. Partners (6.81 vs. 4.05 per person month, respectively). The only source data for conditions in both systems was ICD-9-CM codes. The OMOP common vocabulary for conditions, SNOMED-CT, did not cover all ICD-9-CM codes (88.6%) [21]. For example, all of the five digit codes for ‘453.7-Chronic venous embolism and thrombosis of other specified vessels’ were unavailable in SNOMED-CT. These critical codes were custom added to the data at higher less-specific SNOMED-CT concept levels so they could appear in outcomes (►Table 3).
Table 3.
Challenges and opportunities in implementing the OMOP CDM
| Description | VA | Partners | Lessons learned |
|---|---|---|---|
| Effort to load and transform | Over 6 person months | 1–2 person months | CDM transformation probably not feasible for a single study |
| Memory/space requirements to load | Required partitioning the data into subsets* | Conduct feasibility assessments prior to execution of full ETL to estimate hardware requirements. | |
| ICD-9-CM codes must map to specific SNOMED-CT codes or dropped | Rolled more specific ICD-9-CM codes to less specific SNOMED-CT codes** | Custom mapping minimized dropped codes | |
| Diagnosis must connect to “visits” | Diagnosis with just dates and no „visit” were dropped | Within CDM parameters | Missing or mis-formatted data affects data limitations |
| Visits within “visits” | Selected the longest visit that included the diagnosis of interest | Within CDM parameters | Missing data affects data limitations and required standardization in rules |
| Start dates and end dates required for visits regardless of type of encounter | Populate the same date to both start and end date | Missing data affects data limitations for clinic encounters. | |
| DRGs only profiled in “costs” | Populated the DRGs of interest for identifying drug eluting stent procedures | Also would have missed some cases but most drug eluting stents did have ICD-9-CM procedure codes | Custom mapping of DRG’s required to identify procedures |
| Abnormal flag for laboratory results | Missing flag field | Required custom field to hold the flag | |
| CDM needed quantity field for procedures (needed especially the bleeding outcome, e.g. transfusions) | Took the quantity field used for CPT/HCPCS coding and populated custom field | Required custom field to hold the quantity | |
| Manual coding of some data | Had LOINC codes but some missing, e.g. 10% of Troponin results had no LOINC Code, 16% of INR results had no LOINC code | No single drug vocabulary was used across Partners sites. Some sites did not use a medication vocabulary that had an available crosswalk to RXNORM. | If the organization wants to participate in a CDM model, then assign a group to code data where needed. If the organization has no long term commitment to supporting codified data, then assess the feasibility of coding the data only where the use case requires it. |
*Merged columns represent similar processes/findings at VA and Partners.
**The pulmonary embolism outcome used for the atrial fibrillation use case would have missed 75% of cases had the unmapped ICD-9 codes been dropped at VISN9.
Medication and laboratory data sources were loaded for only a subset of the source data because manual coding was required at Partners for medications and at the VA for laboratory tests. ►Table 2 reflects this limited subset. Again VA had a higher count than Partners (2.04 vs. 1.45 per person month, respectively).
The count of drugs per person month was three times as high at the VA when compared to Partners (0.44 vs. 0.13 per person month, respectively). This higher count must also reflect the higher number of drug records in the VA resulting from the use of medication administration records for inpatients and fill records for outpatients while Partners used only physician orders for medications. Observation records were limited to laboratory test results.
►Table 3 presents a summary of key challenges encountered in implementing the common data model, some of which are being addressed in subsequent releases of the CDM. The VA had a higher prevalence of the conditions in all three use cases (►Table 4, ►Figure 2)
Table 4.
Case counts by step with prevalence
| Step | Atrial Fibrillation Count | Venous Thromboembolism Count | Drug Eluting Stent Count | |||||||||
|---|---|---|---|---|---|---|---|---|---|---|---|---|
| VISN9 | % of Total | Partners | % of Total | VISN9 | % of Total | Partners | % of Total | VISN9 | % of Total | Partners | % of Total | |
| 1 | 14 204 | 16 427 | 6 998 | 1 183 | 1 278 | 1 720 | ||||||
| 2 | 11 616 | 82% | 13 124 | 80% | 5 692 | 81% | 8 725 | 86% | 1 067 | 83% | 1 160 | 67% |
| 3 | 11 350 | 80% | 12 981 | 79% | 5 445 | 78% | 8 413 | 83% | 1 062 | 83% | 1 157 | 67% |
| 4 | 4 814 | 34% | 5 529 | 34% | 3 854 | 55% | 7 485 | 74% | 886 | 69% | 986 | 57% |
| 5 | 4 591 | 32% | 5 313 | 32% | 3 135 | 45% | 6 973 | 68% | 732 | 57% | 789 | 46% |
| 6 | 1 278 | 9% | 908 | 6% | 1 246 | 18% | 1 138 | 11% | 634 | 50% | 660 | 38% |
| 7 | 1 248 | 9% | 889 | 5% | 1 207 | 17% | 1 120 | 11% | 625 | 49% | 658 | 38% |
| Prevalence | 0.011 | 0.001 | 0.011 | 0.001 | 0.006 | 0.001 | ||||||
| Comparison Prevalence | Go AS et al., 2001 | White RH, 2003 | Nielsen KM et al., 2007 | |||||||||
| 0.950* | 0.100 | 0.002 | ||||||||||
Population VA = 109 339
Population Partners = 1 275 000
*Go AS et al., 2001 included all atrial fibrillation vs. only newly diagnosed atrial fibrillation in this study.
Fig. 2.
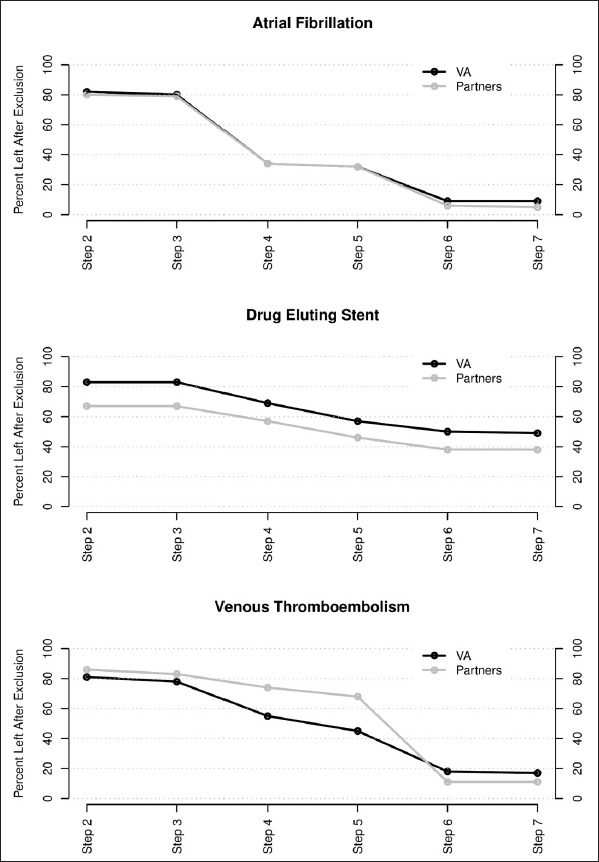
Percent of cases eligible by case finding step
Note: Steps 1–7 reference the inclusion and exclusion criteria in Figure 1.
5. Discussion
Sample sizes and generalizability of findings can be increased by including multiple healthcare delivery systems, but researchers must assure that the data are standardized. In our initiative, the adopted CDM, OMOP, was successful in allowing the case finding and outcome rules to be developed once and applied with minimal adaptation across sites, but required substantial resources to map local data into the underlying CDM. The process highlighted significant heterogeneity between healthcare systems.
The algorithm logic for each of the cohort selection processes noted above were developed by a single team and deployed across both healthcare systems. The same logic could be applied across other OMOP installations with no additional development cost, underscoring the scalability in the use of CDMs. Developing the logic for the 2nd and 3rd use case was also more efficient than for the 1st use case. The use cases also reinforced the need for large data sets to pursue comparative effectiveness studies, as the volume of eligible patients declined rapidly when inclusion and exclusion criteria were applied. However, cohort selection rigor is essential in improving the strength of findings disseminated from observational data sources, as all observational cohort data suffer from confounding and bias. One of the noted limitations of a similar study done by the Mini-Sentinel initiative (although a comparative risk vs. comparative effectiveness assessment) was their reliance on only administrative data, lack of adjustment for confounders, and less rigorous inclusion and exclusion criteria [28–32]. These issues can impact study results, as biases and limitations of data sources can be associated with 20–40% of outcome results moving from a statistically positive association to a negative association depending on the database [33].
There were a number of systematic differences noted in the data collected within Partners and the VISN9 VA healthcare systems. The VA population in general is older, poorer, may have disabilities as part of military service, and have more comorbidities compared with civilians [34]. Previous studies of prevalence for the conditions were higher than both organizations in the study (►Table 4), possibly because of the stringent exclusion criteria we applied [35–37]. Although the two organizations harmonized on drug ingredient, formulation and type/reliability (medication administration/prescription fills vs. orders) of exposure differed. Observed medication administration would be the most reliable, prescription refills next most reliable and orders least reliable [38]. Partners used drug orders where 12.6% of ordered doses may be omitted, 31% of prescriptions may not be filled, and adherence to dose taking ranges from 43–78% even in clinical trials [39].
In the literature, an estimated 9.3% of drugs were typed in as free text [40], combination drugs were frequently represented in structured data as only one of the two drug classes in the combination [41], and only 55.8 to 69.2% of NDC codes were mapped to a vocabulary although these drugs accounted for 93.9 to 95.1% of the drugs in common use [25]. Our work adds to the literature by describing a use case where the loss of even a small number of codes can affect the detection of adverse outcomes, e. g. we could have potentially lost 75% of VTE cases had we not custom mapped the ICD-9 pulmonary embolism codes absent in the standard CDM crosswalk.
Whether or not the patient continues care within the healthcare system administering the electronic records influences whether adverse outcomes will be captured. We deployed criteria for determining patient enrollment or connection to the participating sites using clinical visits relative to the study index date, which may reduce the case volume available for analysis but was more rigorous than previous studies using insurance enrollment data. Research indicates that 13–17% of patients change health plans/providers over 1–2 year periods [42–44]. Persons aged 55–65, blacks, Hispanics and those in fair or poor health would be less likely to change plans so will be more likely to be represented in cohort data [42]. In two of the clinical use cases, the VA system had a higher rate of patient retention, very possibly because of the coverage benefits that would persist with moves or changes in employment [27, 45]. VA patients were largely male, older with poorer health, more medical conditions, more physician visits, and more admissions, matching most of Cunningham et. al [42] criteria for patients less likely to change plans [27]. For these reasons, intra- and inter-healthcare system data quality assessments broadly across data domains and deeply within clinical use cases are necessary to understand the data.
The data transformation to OMOP was time consuming as reported by others [22, 23]. In our study, the ETL team first executed the VA data load over six person months and then performed the Partners load in 1–2 person months. This suggests using an ETL team allowed gains in efficiency as the knowledge and programming was partially transferrable regardless of the source data. At other sites, the authors estimated transformation (full vs. partial data as in current study) and loading processes to require four people over a six month period with conversion to OMOP concept codes and then loads running 4–11 days [22]. The conversion of 466 group practices from native data to OMOP took two person years [23]. This is consistent with expert panelists’ estimates of costs of data standardization [46].
6. Conclusion
Use of data within a CDM across multiple USA healthcare systems requires an understanding of the differences between the source data in the healthcare systems. Understanding the strengths and limitations of CDMs is useful, as there are a number of large initiatives promoting CDM development and implementation, such as the European Medicines Agency’s post authorization safety studies, FDA’s Mini-Sentinel/MDEpiNet, and the PCORnet [14, 47, 48].
Footnotes
Clinical Relevance Statement
It is feasible to develop and implement a common data model from electronic health record data sources. Early comparison of effectiveness in common data models could better inform the adoption recommendations for emerging therapies. The organization’s adoption of standard codes (like National Drug Codes) across care locations increases the percent of data that could be made available in a CDM.
Note: Preliminary data from this paper was used in a poster presented at the American Medical Informatics Association 2012 Annual Symposium.
Conflict of Interest
The authors declare that they have no conflicts of interest in the research.
Protection of Human and Animal Subjects
The study was performed in compliance with the World Medical Association Declaration of Helsinki on Ethical Principles for Medical Research Involving Human Subjects. All research was conducted with the approval by the Partners and VA TVHS Institutional Review Board.
Financial Support
This study’s support was based upon work supported with resources and the use of facilities at the TVHS VA, the Integrating Data for Analysis, Anonymization and SHaring (iDASH), a National Center for Biomedical Computing (NCBC) grant U54HL108460 and by Scalable Network for Effectiveness Research (SCANNER), grant R01HS019913 funded by the Agency for Healthcare Research and Quality (AHRQ).
References
- 1.Mayer-Schönberger V, Cukier K. Big Data: a revolution that will transform how we live, work, and think. New York: Houghton Mifflin Harcourt; 2013. [Google Scholar]
- 2.Toh S, Platt R. Is size the next big thing in epidemiology? Epidemiology 2013; 24(3): 349–351. [DOI] [PubMed] [Google Scholar]
- 3.Grossman C, Powers B, Sanders J. [Rapporteurs]. Roundtable on value and science-driven health care, medicine Io: Digital data improvement priorities for continuous learning in health and healthcare: Workshop summary. Washington, DC: National Academies Press; 2013. [PubMed] [Google Scholar]
- 4.Olsen LA, McGinnis JM. Redesigning the clinical effectiveness research paradigm: Innovation and practice-based approaches: Workshop summary. Edited by Medicine Io. Washington, DC: National Academies Press; 2010. [PubMed] [Google Scholar]
- 5.Trifirò G, Pariente A, Coloma PM, Kors JA, Polimeni G, Miremont-Salamé G, Catania MA, Salvo F, David A, Moore N, Caputi AP, Sturkenboom M, Molokhia M, Hippisley-Cox J, Acedo CD, van der Lei J, Fourrier-Reglat A. Data mining on electronic health record databases for signal detection in pharmacovigilance: which events to monitor? Pharmacoepidemiology and Drug Safety 2009; 18(12): 1176–1184. [DOI] [PubMed] [Google Scholar]
- 6.Schneeweiss S, Avorn J. A review of uses of health care utilization databases for epidemiologic research on therapeutics. Journal of Clinical Epidemiology 2005; 58(4): 323–337. [DOI] [PubMed] [Google Scholar]
- 7.Suissa S, Garbe E. Primer: administrative health databases in observational studies of drug effects–advantages and disadvantages. Nature Clinical Practice Rheumatology 2007; 3(12): 725–732. [DOI] [PubMed] [Google Scholar]
- 8.Lohr KN. Emerging methods in comparative effectiveness and safety: symposium overview and summary. Medical Care 2007; 45(10 Supl 2): S5–8. [DOI] [PubMed] [Google Scholar]
- 9.American Recovery and Reinvestment Act of 2009. In USA; 2009: 123. [Google Scholar]
- 10.Berger ML, Doban V. Big data, advanced analytics and the future of comparative effectiveness research. Journal of Comparative Effectiveness Research 2014; 3(2): 167–176. [DOI] [PubMed] [Google Scholar]
- 11.Herland M, Khoshgoftaar T, Wald R. A review of data mining using big data in health informatics. Journal Of Big Data 2014; 1(1): 2. [Google Scholar]
- 12.Van Poucke S, Thomeer M, Hadzic A. 2015, big data in healthcare: for whom the bell tolls? Critical Care 2015; 19(1): 171. [DOI] [PMC free article] [PubMed] [Google Scholar]
- 13.Adams CP, Brantner VV. Estimating the cost of new drug development: Is it really $802 million? Health Affairs 2006; 25(2): 420–428. [DOI] [PubMed] [Google Scholar]
- 14.Food and Drug Administration: The sentinel initiative, National strategy for monitoring medical product safety. In.; 2010. [Google Scholar]
- 15.Food and Drug Administration: FDA Mini-Sentinel Assessment Reinforces Safety Data of Pradaxa® (dabigatran etexilate mesylate). In: PRNewswire. New York, NY: PRNewswire; 2012. [Google Scholar]
- 16.Rijnbeek P. Converting to a common data model: what is lost in translation? : Commentary on „fidelity assessment of a clinical practice research datalink conversion to the OMOP common data model”. [Erratum appears in Drug Saf. 2014; 37(12): 1073]. Drug Safety 2014; 37(11): 893–896. [DOI] [PubMed] [Google Scholar]
- 17.Hernandez-Diaz S, Varas-Lorenzo C, Garcia Rodriguez LA. Non-steroidal antiinflammatory drugs and the risk of acute myocardial infarction. Basic & Clinical Pharmacology & Toxicology 2006; 98(3): 266–274. [DOI] [PubMed] [Google Scholar]
- 18.Fortier I, Doiron D, Burton P, Raina P. Invited commentary: consolidating data harmonization–how to obtain quality and applicability? American Journal of Epidemiology 2011; 174(3): 261–264; author reply 265–266. [DOI] [PubMed] [Google Scholar]
- 19.Bero CL, Lee TH. Achieving meaningful use: a health system perspective. American Journal of Managed Care 2010; 16(12 Suppl HIT): SP9–12. [PubMed] [Google Scholar]
- 20.Ogunyemi OI, Meeker D, Kim H-E, Ashish N, Farzaneh S, Boxwala A. Identifying appropriate reference data models for comparative effectiveness research (CER) studies based on data from clinical information systems. Medical Care 2013; 51(8 Suppl 3): S45–52. [DOI] [PubMed] [Google Scholar]
- 21.Reich C, Ryan P, Torok D, Vereshagin S, Khayter M, Welebob E. OMOP Implementation Specification Standard Vocabularies in Observational Data Analysis Version 4.0. In.: Foundation for the National Institutes of Health; 2012. [Google Scholar]
- 22.Overhage JM, Ryan PB, Reich CG, Hartzema AG, Stang PE. Validation of a common data model for active safety surveillance research. Journal of the American Medical Informatics Association 2012; 19(1): 54–60. [DOI] [PMC free article] [PubMed] [Google Scholar]
- 23.Zhou X, Murugesan S, Bhullar H, Liu Q, Cai B, Wentworth C, Bate A. An evaluation of the THIN database in the OMOP Common Data Model for active drug safety surveillance. Drug Safety 2013, 36(2): 119–134. [DOI] [PubMed] [Google Scholar]
- 24.Matcho A, Ryan P, Fife D, Reich C. Fidelity assessment of a clinical practice research datalink conversion to the OMOP common data model. Drug Safety 2014; 37(11): 945–959. [DOI] [PMC free article] [PubMed] [Google Scholar]
- 25.DeFalco F, Ryan P, Soledad Cepeda M. Applying standardized drug terminologies to observational healthcare databases: a case study on opioid exposure. Health Serv Outcomes Res Method 2013, 13(1): 58–67. [DOI] [PMC free article] [PubMed] [Google Scholar]
- 26.Veterans Health Administration: Patient care data capture: VHA Directive. 2009–002. In. Edited by Affairs USDoV. Washington, DC: Veterans Health Administration; 2009. [Google Scholar]
- 27.Agha Z, Lofgren RP, VanRuiswyk JV, Layde PM. Are patients at Veterans Affairs medical centers sicker? A comparative analysis of health status and medical resource use. Archives of Internal Medicine 2000; 160(21): 3252–3257. [DOI] [PubMed] [Google Scholar]
- 28.Food and Drug Administration: FDA Drug Safety Communication: Update on the risk for serious bleeding events with the anticoagulant Pradaxa. In. Silver Springs, MD: Drug Safety Communications; 2012. [Google Scholar]
- 29.Southworth MR, Reichman ME, Unger EF: Dabigatran and postmarketing reports of bleeding. New England Journal of Medicine 2013, 368(14): 1272–1274. [DOI] [PubMed] [Google Scholar]
- 30.Avorn J. The promise of pharmacoepidemiology in helping clinicians assess drug risk. Circulation 2013; 128(7): 745–748. [DOI] [PubMed] [Google Scholar]
- 31.Dabigatran (Pradaxa) warfarin & GI bleed, intracerebral hemorrhage (Modular Program) [http://www.mini-sentinel.org/work_products/Assessments/Mini-Sentinel_Modular-Program-Report_MSY3_MPR41_Dabigatran-Warfarin-GIH-ICH_Part-1.pdf]
- 32.Psaty BM, Breckenridge AM. Mini-Sentinel and regulatory science-big data rendered fit and functional. New England Journal of Medicine 2014; 370(23): 2165–2167. [DOI] [PubMed] [Google Scholar]
- 33.Madigan D, Ryan PB, Schuemie M, Stang PE, Overhage JM, Hartzema AG, Suchard MA, Dumouchel W, Berlin JA. Evaluating the impact of database heterogeneity on observational study results. Am J Epidemiol 2013; 178(4): 645–651. [DOI] [PMC free article] [PubMed] [Google Scholar]
- 34.Vaughan-Sarrazin MS, Wakefield B, Rosenthal GE. Mortality of Department of Veterans Affairs Patients Undergoing Coronary Revascularization in Private Sector Hospitals. Health Services Research 2007; 42(5): 1802–1821. [DOI] [PMC free article] [PubMed] [Google Scholar]
- 35.Go AS, Hylek EM, Phillips KA, Chang Y, Henault LE, Selby JV, Singer DE. Prevalence of diagnosed atrial fibrillation in adults: National implications for rhythm management and stroke prevention: the anticoagulation and risk factors in atrial fibrillation (atria) study. JAMA 2001; 285(18): 2370–2375. [DOI] [PubMed] [Google Scholar]
- 36.Nielsen KM, Foldspang A, Larsen ML, Gerdes LU, Rasmussen S, Faergeman O. Estimating the incidence of the acute coronary syndrome: data from a Danish cohort of 138290 persons. European Journal of Cardiovascular Prevention & Rehabilitation 2007; 14(5): 608–614. [DOI] [PubMed] [Google Scholar]
- 37.White RH. The Epidemiology of Venous Thromboembolism. Circulation 2003; 107(23 suppl 1): I4–I8. [DOI] [PubMed] [Google Scholar]
- 38.Osterberg L, Blaschke T. Adherence to Medication. New England Journal of Medicine 2005; 353(5): 487–497. [DOI] [PubMed] [Google Scholar]
- 39.FitzHenry F, Doran J, Lobo B, Sullivan TM, Potts A, Feldott CC, Matheny ME, McCulloch G, Deppen S, Doulis J. Medication-error alerts for warfarin orders detected by a bar-code-assisted medication administration system. American Journal of Health-System Pharmacy 2011; 68(5): 434–441. [DOI] [PubMed] [Google Scholar]
- 40.Zhou L, Mahoney L, Shakurova A, Goss F, Chang F, Bates D, Rocha R. How many medication orders are entered through free-text in EHRs? A study on hypoglycemic agents. American Medical Informatics Association Annual Meeting; Chicago, IL: 2012: 1079–1088. [PMC free article] [PubMed] [Google Scholar]
- 41.FitzHenry F, Dietrich M, Littlejohn S, Gregory D, Matheny M, Ehrenfeld J, Wells N. Postoperative pain time from severe to mild: effect of frequent and multimodal interventions. American Pain Society National Meeting 2013; New Orleans, LA: 2013. [Google Scholar]
- 42.Cunningham PJ, Kohn L. Health plan switching: choice or circumstance? Health Affairs 2000; 19(3): 158–164. [DOI] [PubMed] [Google Scholar]
- 43.Lavarreda SA, Gatchell M, Ponce N, Brown ER, Chia YJ. Switching health insurance and its effects on access to physician services. Medical Care 2008; 46(10): 1055–1063. [DOI] [PubMed] [Google Scholar]
- 44.Reed M. Why people change their health care providers. Data Bull (Cent Stud Health Syst Change) 2000; 16: 1–2. [PubMed] [Google Scholar]
- 45.Lederle F, Parenti C. Prescription drug costs as a reason for changing physicians. Journal of General Internal Medicine 1994; 9(3): 162–163. [DOI] [PubMed] [Google Scholar]
- 46.Walker J, Pan E, Johnston D, Adler-Milstein J, Bates DW, Middleton B. The value of health care information exchange and interoperability. Health Affairs 2005; Suppl Web Exclusives: W5–10, W15–18. [DOI] [PubMed] [Google Scholar]
- 47.Ohno-Machado L, Agha Z, Bell DS, Dahm L, Day ME, Doctor JN, Gabriel D, Kahlon MK, Kim KK, Hogarth M, Matheny ME, Meeker D, Nebeker JR, pSCANNER team. pSCANNER: patient-centered scalable national network for effectiveness research. Journal of the American Medical Informatics Association 2014; 21(4): 621–626. [DOI] [PMC free article] [PubMed] [Google Scholar]
- 48.European Medicines Agency: Guideline on good pharmacovigilance practices: Module VIII – Post authorisation safety studies (Rev 1). In.; London, United Kingdom: European Medicines Agency; 2013. [Google Scholar]