

Abstract
Diffuse axonal injury is thought to be the basis of the functional impairments stemming from mild traumatic brain injury. To examine how axons are damaged by traumatic events, such as motor vehicle accidents, falls, sports activities, or explosive blasts, we have taken advantage of the spinal cord with its extensive white matter tracts. We developed a closed-body model of spinal cord injury in mice whereby high-pressure air blasts targeted to lower thoracic vertebral levels produce tensile, compressive, and shear forces within the parenchyma of the spinal cord and thereby cause extensive axonal injury. Markers of cytoskeletal integrity showed that spinal cord axons exhibited three distinct pathologies: microtubule breakage, neurofilament compaction, and calpain-mediated spectrin breakdown. The dorsally situated axons of the corticospinal tract primarily exhibited microtubule breakage, whereas all three pathologies were common in the lateral and ventral white matter. Individual axons typically demonstrated only one of the three pathologies during the first 24 h after blast injury, suggesting that the different perturbations are initiated independently of one another. For the first few days after blast, neurofilament compaction was frequently accompanied by autophagy, and subsequent to that, by the fragmentation of degenerating axons. TuJ1 immunolabeling and mice with YFP-reporter labeling each revealed more extensive microtubule breakage than did βAPP immunolabeling, raising doubts about the sensitivity of this standard approach for assessing axonal injury. Although motor deficits were mild and largely transient, some aspects of motor function gradually worsened over several weeks, suggesting that a low level of axonal degeneration continued past the initial wave. Our model can help provide further insight into how to intervene in the processes by which initial axonal damage culminates in axonal degeneration, to improve outcomes after traumatic injury. Importantly, our findings of extensive axonal injury also caution that repeated trauma is likely to have cumulative adverse consequences for both brain and spinal cord.
Keywords: Spinal cord, Axonal injury, Trauma, Microtubule breakage, Axonal bulbs, Axonal degeneration, Neurofilaments, Calpain, Spectrin proteolysis, Motor impairment
Introduction
Traumatic brain injury (TBI) is a common occurrence, with the CDC reporting ~2.5 million cases in the US in 2010, of which about 75% were considered to be mild. In the general population, falls, unintentional blunt trauma, motor vehicle accidents, and assaults are the leading causes of TBI, although concussions in sports have received considerably more media attention. These events are marked by localized impact (s) and often accompanied by the abrupt deceleration of the body. In some situations, the localized impact is also associated with hyperextension of the vertebral column, for example, whiplash in car accidents. These types of events produce nervous system compression (first at the impact site and then on the contrecoup side), tensile forces (resulting in stretching), and dynamic shear (see Namjoshi et al., 2013 for overview). For members of the military, blasts represent the major cause of TBI. The blast wave itself can damage the brain, and this damage is often compounded by impact-related acceleration/deceleration and sometimes even accompanied by a penetrating injury. Although typically overlooked due to the focus on the brain, blast, impact, and acceleration/deceleration can also damage the spinal cord. Further, even single concussive events have been reported to produce insidiously progressive neuropathology (Johnson et al., 2012) and multiple concussive or subconcussive events are associated with chronic traumatic encephalopathy (McKee et al., 2009, 2013), as well as increased risk of Alzheimer’s disease, Parkinson’s disease, and amyotrophic lateral sclerosis (Jordan, 2013; Lehman et al., 2012).
Axonal injury is a key feature of TBI and a major source of TBI-related disability. Even ‘mild’ TBI, which involves either brief or no loss of consciousness, typically produces axonal injury that can be visualized with diffusion tensor imaging (Bazarian et al., 2013). Axons are more susceptible to injury, due to their viscoelastic nature and the large surface to volume ratio, than are neuronal cell bodies and myelin sheaths, and the parallel arrangement of axons in white matter tracts makes them especially vulnerable to stretch and shear (Smith et al., 2013). Although TBI-related damage to axons was originally termed diffuse axonal injury (DAI), it is now realized to be multifocal, and more accurately termed traumatic axonal injury (TAI). TAI encompasses a spectrum of changes involving the axolemma and cytoskeleton that culminates in axonal disconnection. These changes have been characterized using various closed-skull animal (e.g. Marmarou et al., 1994; recently reviewed by Xiong et al., 2013) and in vitro models (e.g. Tang-Schomer et al., 2010, 2012), and been shown to include microtubule breakage, neurofilament compaction, altered membrane permeability, and activation of the Ca2+-dependent proteolytic enzyme calpain. Surprisingly little is known, however, about how these different pathologies relate to one another and how they progress over time. Moreover, whether axons are able to recover from specific pathological changes and when axonal degeneration becomes inevitable remain unclear (Giza and Hovda, 2014).
Better understanding of the relationship of the different axonal pathologies to one another and to eventual axon degeneration is needed to develop strategies for mitigating progressive injury. There is in particular a critical need for animal models in which TAI can be created, separate from other confounding insults, and examined over time. The spinal cord is notable for long descending and ascending axonal tracts and thus is well-suited for creating TAI. To damage the spinal cord in such a way that TAI would be the primary injury, we developed a ‘closed-body’ model in which high-pressure air blasts are delivered to the mouse dorsum. Our use of multiple markers of cytoskeletal integrity has yielded new insights into the complexity of the cellular mechanisms of axonal injury in vivo. In particular, we have found that microtubule disruption, neurofilament compaction, and spectrin cleavage by calpain are largely separate forms of early damage that can each lead to axonal degeneration. Importantly, the extensive axonal damage seen in our model underscores the high vulnerability of white matter tracts to tensile, compressive, and shear forces.
Materials and methods
Mice
Female mice were used at 6–8 weeks of age. Mice were weighed before the blast session, and excluded if they weighed less than 14.0 g or more than 19.5 g. Behavioral studies were conducted exclusively on C57BL/6 mice, which were either purchased directly from Jackson Laboratories (JAX; Bar Harbor, ME), and/or taken from a colony maintained from C57BL/6 founders originally obtained from JAX. Histological studies were performed on both the C57BL/6 mice and on a strain of transgenic mice developed by the Sanes laboratory (Bareyre et al., 2005) in which enhanced yellow fluorescent protein (EYFP) is expressed in the corticospinal tract, henceforth called “CST-YFP” mice. These transgenic mice were obtained by breeding floxed Thy1-EYFP reporter mice and Emx1-Cre driver mice, each of which was created on C57BL/6 background. Founder transgenic mice were purchased from JAX, and colonies of each were subsequently maintained at the University of Tennessee Health Science Center (UTHSC). The Thy1 promoter is widely expressed in projection neurons throughout the nervous system, whereas the Emx1 gene is selectively expressed in cortical pyramidal neurons. Given the nearly 90% frequency of recombination in CST-YFP mice, almost all corticospinal neurons, including their axons and synaptic terminals, are visualizable with EYFP (Bareyre et al., 2005). Despite concerns regarding the leaky expression of EYFP in small numbers of other neuronal populations (Willenberg and Steward, 2012), this does not represent a problem for our studies because we used the YFP fluorescence primarily to visualize axons in the main dorsal component of the CST (dCST). Procedures involving animals adhered to National Institutes of Health (NIH) guidelines and were approved by the Animal Care and Use Committee at UTHSC.
Blast injury of the spinal cord
Our model uses a pressurized air tank and a modified paintball gun to deliver high-pressure air blasts to the dorsum of the animal through an opening in a mouse holder that shields the rest of the animal’s body from the blast. The device was originally developed to study the ocular damage caused by blast forces, such as those generated by improvised explosive devices (Hines-Beard et al., 2012; also see Bricker-Anthony et al., 2014a,b), and was subsequently adapted to model TBI by targeting the temporal side of the head (Guley et al., submitted for publication; Heldt et al., 2014; Reiner et al., 2014). For both ocular injury and TBI, the blast is restricted to a circular area on the left side of the mouse’s head and the other side of the mouse’s head and body is cushioned with soft foam rubber. To injure the spinal cord, we made several adjustments in the overall approach (Fig. 1). First, we surmised that the vertebrae would at least partly block transmission of the blast such that the pressure wave would be conducted to the spinal cord primarily across the interlaminar spaces. Thus, we decided to maximize those spaces, by stretching out the torso of the mouse and then taping the mouse’s paws and tail to a rigid cardboard sheet to keep the mouse in an outstretched position. Second, rather than the circular opening, we fabricated a rectangular opening, to correspond to the shape of the spinal cord. The dimensions we chose for the opening were 3 mm wide (roughly the width of the vertebral column) by 5.5 mm long (the length of ~3 segments). Third, we delivered two successive blasts, spaced 2–4 min apart.
Fig. 1.

Blast cannon model adapted for spinal cord injury. A, B) An anesthetized mouse, with its back shaved, is taped in an outstretched position to a strip of foam attached to a stiff platform made of posterboard. C) The mouse holder is a transparent PVC pipe with a 2 cm circular opening. After the mouse, taped to the platform, is slid into the mouse holder, the T9 segment is centered within the circular opening. D) A plastic sheet, with a 3 mm wide × 5.5 mm long open slit, is centered over the circular opening using rubber bands (purple), in order to restrict the blast to ~3 segments (T8–10) of the vertebral column. E) Top view of the horizontally-mounted paintball gun used to deliver high-pressure air blasts. The mouse holder is shown closely apposed to the gun barrel. F) A close-up view of E, now with a mouse in the holder. Mouse nose is to the left; its dorsum faces the gun barrel.
At the start of each blast session, the pressure delivered by the gun was measured using a pressure transducer placed in the same location the targeted region of the mouse’s body would later occupy, and adjusted to reach the desired pressure level (Heldt et al., 2014; Hines-Beard et al., 2012). We delivered somewhat higher pressures (70-psi peak pressure) than those used to create mild TBI with the same blast cannon system (60-psi peak pressure; Guley et al., submitted for publication; Heldt et al., 2014; Reiner et al., 2014), to compensate for the greater protection provided by the substantial muscle and bone that overlie the spinal cord.
Our blast procedure was as follows (Fig. 1). Immediately prior to blast, each mouse was anesthetized with Avertin (400 mg/kg body weight) and the fur on its back was shaved. The mouse was placed on strip of soft foam attached to the upper side of a 2.8 cm-wide, 32 cm-long platform made of firm posterboard and its paws and tail were taped to the foam, to stabilize the mouse in an outstretched position. The platform was slid into the mouse holder, which is a transparent PVC pipe with an inner diameter of 3.2 cm and a 2 cm circular opening in one wall. To restrict the air blast to the T8–10 level of the vertebral column, we probed for the vertebral spinous processes using a blunt dissecting tool, centered the T9 segment (±1 segment) within the 2 cm opening, and then covered the circular opening with a firm, thin plastic sheet having a 3 mm wide × 5.5 mm long open slit. In this way, the mouse’s body, except for the region under the slit, would be shielded from the blast. The mouse holder was mounted and then positioned so that the exposed part of the mouse’s dorsum was ~1 cm from the barrel of the gun when the blast was delivered. Despite the foam cushioning, platform, and snug fit in the mouse holder, the mouse moved slightly during the first blast, and so it was repositioned to re-center T9 before the second blast was delivered. A small subset of mice received blasts at a lower level of pressure (20 psi). Sham mice underwent the exact same procedure, except that the mouse holder was positioned several centimeters from the gun barrel and a piece of cardboard was inserted between the two to block the blast wave from reaching the mouse. The mice were kept in a heated chamber while recovering from anesthesia and prior to returning to their cage. An analgesic (liquid children’s Tylenol) was given orally, by addition to the drinking water at 35 mg/ml, for 24 h after blast.
A few mice were videotaped at 1100 fps with a pco.1200 hs camera (The Cooke Corp., Romulus, MI) to visualize their movement during the blast. The camera was positioned above the mouse holder and viewed the animal’s lateral aspect.
Behavioral testing
Motor function was assessed using three standard tasks: rotarod, horizontal beam, and treadmill. Mice were tested 1–3 days before blast to establish baseline levels for each mouse for each task. The mice underwent several training trials for rotarod and horizontal beam before the pre-blast testing. Treadmill running did not require previous training.
The horizontal beam was 1 cm in diameter and 80 cm long with a darkened escape box on one end. Testing sessions were videotaped and consisted of 3 runs for each mouse, conducted at least 10 min apart. Frames from the videos when the mice were roughly midway between the two ends of the beam were selected and used to measure rump-height (the vertical distance from the animal’s tail base to the beam). Rump-height distance has been previously used to assess recovery from spinal cord injury (SCI) caused by cord compression in mice (Apostolova et al., 2006), and provides an indication of the mouse’s ability to support its body weight. Values for the 3 runs were averaged.
For the rotarod task, speed was increased from 4 rpm to 20 rpm over a four-minute period, and then 20 rpm was maintained for another 2 min. Each testing session consisted of 3 runs, at least 10 min apart. Latency to fall and speed of the rotarod at the time of fall were recorded. Values for the 3 runs were used to obtain an average for each mouse. Mice that were tested on rotarod before blast were assigned to either the blasted or sham group in such a way that the average performance on rotarod was equivalent for both groups for each cohort of mice.
The DigiGait Imaging System (Mouse Specifics, Quincy, MA) provides an automated and highly detailed quantitative analysis of locomotion. In the DigiGait System, a mouse is placed on a transparent motorized treadmill housed within a Plexiglas compartment and images of the mouse walking are acquired by a high-speed video camera mounted underneath the treadmill. Several seconds of video are then analyzed by the software to yield measures of the spatial and temporal characteristics of gait for each limb and of interlimb coordination. In initial trials, we found that all 6–8 week old female C57BL/6 mice were able to keep up with the treadmill moving at a speed of 20 cm/s before blast and nearly all could do so at 30 cm/s. Each mouse was tested at the slower speed first, and at the faster speed several minutes later. Mice that were unable to maintain their position on the treadmill were allowed several attempts, with several minutes between attempts.
The results of the behavioral tests are expressed as mean ± standard error and were analyzed statistically. Unless otherwise noted, paired t-tests were used to compare data for each group of mice (blasted or sham) at a selected time after blast with data for pre-blast testing. Un-paired t-tests were used to compare the change from before blast to a specific post-blast time for blasted mice with the change for sham mice over the same time period.
Histology
Tissue preparation
Mice were anesthetized with intraperitoneal injection of avertin (0.2 ml per gram of body weight) and perfused transcardially with heparinized saline, followed by 25 ml of 4% paraformaldehyde in 0.1 M phosphate buffer (PB). The mice were then dissected to expose the spinal cord, and the mouse torso with spinal cord still in situ was post-fixed overnight at 4 °C. The torso was washed in 0.1 M PB, and specific regions of cord, identified in relation to the adjacent ribs were removed, so they could later be sectioned separately. Note that we used vertebral levels to specify segmental levels of the spinal cord, rather than identifying spinal cord segments by the criteria described in a recent publication (Harrison et al., 2013). The spinal cord at levels above (typically T4 or T5 through T8) and through the blast site (typically T8 through T10 or T11) were embedded and sectioned separately in the horizontal plane. The region below the blast site (typically T10 or T11 through L5) was cut in the transverse plane. For transverse sections, the spinal cords from 2 or 3 mice, at least one of which was blasted and another one being a sham, were placed in the same tissue block for later quantitative analysis of the labeling. Tissue was washed in PB, and then cryoprotected in 30% sucrose/PB. Sections were cut on a cryostat at 30 μm, mounted directly in serial order onto Superfrost/Plus slides (Fisher, Fair Lawn, NJ), and stored at −80 °C until used.
Immunofluorescent processing
Slides were processed for immunofluorescence as follows. Slides were washed in PB, permeabilized and quenched in 0.2% Triton X-100, 0.1 M glycine in 0.1 M PB for ½ h, blocked in 3% bovine serum albumin (BSA) in 0.1 M PB for ½ h, and incubated in primary antibodies diluted in 3% BSA in 0.1 M PB. The following primary antibodies were used: rabbit anti-PKCγ (Abcam, #ab71558), rabbit anti-βAPP (Invitrogen, #51-2700), rabbit anti-LC3b (Novus Biologicals, #NB600-1384), rabbit anti-αII-spectrin breakdown product 150 kDa (SBDP150, Ab 37; Roberts-Lewis et al., 1994; kindly provided by Robert Siman, Univ. of Pennsylvania), mouse anti-βIII-tubulin (TuJ1; Covance Research Projects, #MMS-435P), and mouse RMO14 (which binds to a region within the rod domain of the medium neurofilament subunit (NF-M) that is exposed by proteolysis; Hall and Lee, 1995; kindly provided by Virginia Lee, Univ. of Pennsylvania). After incubation in a mix of primary antibodies overnight at 4 °C, slides were washed and then incubated with appropriate species-specific secondary antibodies conjugated to Alexa 488, 594, or 647 (Invitrogen) for 1 h at room temperature. For double-labeling with the mouse monoclonal antibodies, TuJ1 and RMO14, sections were incubated in a mixture of goat anti-ms IgG2a-Alexa555 and goat anti-ms IgG1-Alexa594 (A21137 and A21125, respectively, Invitrogen; Manning et al., 2012). Slides were washed and then coverslipped in Fluoromount-G (SouthernBiotech, Birmingham, AL).
Image capture and analysis
Images of fluorescently labeled sections were captured with a Zeiss 710 confocal laser-scanning microscope. Images were subsequently processed and analyzed using Adobe Photoshop and/or Image J. To assess co-expression, we viewed enlarged images on a computer monitor with Adobe Photoshop, and created overlying layers in which we marked axonal profiles labeled with a particular fluorophore in one layer, and then did the same for the other fluorophore channel(s).
To evaluate the loss of axons in the dCST, we used PKCγ as a marker, as has previously been done to assess the effectiveness of pyramidotomy and a variety of spinal cord lesions (Bradbury et al., 2002; Cafferty and Strittmatter, 2006). Analysis was performed on mice sacrificed at ≥7 days after blast to allow time for the distal ends of axons injured at mid-thoracic levels to degenerate. Slides containing sections corresponding to lower thoracic and upper lumbar levels were selected for immunostaining. Analysis was limited to segmentally matched sections at T13-L1, using the shape of the dorsal funiculus as shown in the Allen Brain Atlas to determine segmental level. Images of 2–3 sections from each of the 2–3 spinal cords contained in a given tissue block were captured under identical conditions over a few hour time period. The optical density of the dorsal columns was measured with Image J to determine background labeling, and used to adjust all the images to the same background optical density level. The area occupied by the dCST was outlined and a threshold level was set to distinguish labeled vs unlabeled pixels. The area above threshold was then measured, using the same threshold for all sections in a given tissue block. For the histograms in Fig. 10C, the area > threshold for blasted mice was expressed as a percentage relative to the sham mouse in the same tissue block. For tissue blocks containing spinal cords from 2 sham mice, their average dCST area > threshold was used to normalize the dCST area for the blasted mouse. For statistical comparisons, the absolute areas of blasted and sham mice in the same tissue block were compared using paired t-tests. Data from mice at 29–37 days after blast were pooled together for the results at 1 month post-blast.
Fig. 10.
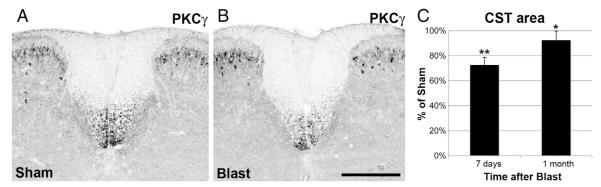
Degeneration of CST axons. A, B) Transverse sections of the spinal cord at the T13-L1 level immunostained for PKCγ to visualize the dCST. Within the spinal cord, PKCγ expression is restricted to dCST axons and to a subpopulation of lamina II dorsal horn interneurons; the latter provides a useful positive control for the immunostaining. A is from a sham mouse. B, from one of its littermates at 7 days after blast, shows less intense immunostaining, indicating the loss of dCST axons. The optical density scale has been inverted so that the fluorescent staining appears black and background has been adjusted to make the gray matter visible, to provide orientation. Scale bar = 100 μm. C) Histograms showing the area of PKCγ immunostaining in the dCST above threshold, expressed as percentage of that for sham mice. Average value for blasted mice at 7 days after blast is significantly less than that of their sham littermates. Area of the dCST at 1 month post-blast is more than at 7 days post-blast, but is still significantly less than that of the sham littermates. Brackets indicate standard errors. *p < 0.05; **p < 0.005.
Results
Fig. 2A shows pressure waves recorded by a pressure transducer positioned at the same distance from the barrel of the gun as the mouse’s dorsum would be during a blast and with the same protective shielding in place. A typical 70-psi blast reached peak amplitude within 8 ms and then decayed to 0 psi within 17 ms. Although the mouse was taped to a cushioned platform and fit snugly in the mouse holder, greatly limited its movement, high-speed video recordings revealed that movement in the form of dorsiflexion occurred during blast. The mouse in Fig. 2D, for example, showed a maximum deflection of 1.1 cm (panel D3) approximately 7 ms after the blast was delivered. The site of maximum deflection moved rostrally and caudally as the pressure wave propagated along the mouse’s body (panels D4–8), until the dorsum returned to its original position (panels D9–10). The bending of the mouse’s dorsum thus followed roughly the same time course as the blast pressure wave and extended as far rostral as ~T4. The mouse’s head and the caudal part of its body lifted up during the blast wave, to accommodate the pressure forces exerted on the torso. The mouse’s dorsiflexion was seemingly accompanied by compression of the underlying foam cushion, but since the mouse’s body and fur partly blocked the view of the cushion during the blast, the extent of compression could not be determined. Analysis of 6 videos revealed an average maximum deflection of 1.4 cm. Based on the length of the mouse dorsum at the time of maximal deflection (panel D3) as compared to before or after blast (panels D1 or D10), we calculated that axons extending from the brain to lumbar levels would have been stretched to ~30% more than their normal length. The energy remaining from the blast (i.e. that not transformed into kinetic energy by the mouse’s dorsiflexion and foam’s compression or absorbed by the overlying skin, muscle, and vertebral column) would then be transmitted to the spinal cord and propagated through its parenchyma. Despite the extensive dorsiflexion, the mice displayed no signs of vertebral column fracture or spinal cord injury in that they resumed normal activity after waking from anesthesia. No structural damage or hemorrhaging in the skin, muscle, vertebral column, meninges, or spinal cord was evident upon dissection. In addition, immunostained sections from mice sacrificed between 2 days and 5 weeks after blast showed none of the hallmarks of localized injury (e.g., tissue loss, demyelination, microglial activation, and/or astrocytic scarring) that accompany compressive or contusive injury (Ma et al., 2001; Basso et al., 2006).
Fig. 2.

Blast pressure waves and video recordings. A) Pressure waves for two blast amplitudes: 70 psi (average of 4 blasts) used to create axonal injury and 20 psi (average of 2 blasts) used to examine the contribution of dorsiflexion to axonal injury. B) Photograph of mouse in holder, as in Fig. 1F, now oriented to approximate the view seen in the high-speed video recordings. C) Still image, taken before blast, from the video recording of the mouse shown in panels D1–10. The images are ‘noisier’ than that in B, because of the very short exposure times (<1 ms) of the video camera. Differences in camera angles and the positioning of the rubber bands account for additional slight differences between B and C. The mouse dorsum is ~1 cm from the nozzle of the blast gun. D) Still images from a video recording of a mouse subjected to a 70-psi blast, showing dorsiflexion of its torso. The times indicated start with the first clear movement of the fur. Maximal deflection of 1.1 cm is seen in D3. Successive images show that the site of maximum deflection changes as the pressure wave propagates along the mouse’s body and that the mouse’s head and the caudal part of its body lift up, to accommodate the bending of its torso. E) Still images from a video recording of a mouse subjected to a 20-psi blast, showing a maximal deflection of 0.66 cm.
Axonal injury at 1–2 days following blast
We processed horizontal sections of thoracic spinal cord for immunofluorescence using a variety of markers, focusing initially on mice sacrificed 1–2 days after blast, when axonal injury has typically been observed following closed-head TBI. When microtubules are disrupted, axonal transport is impaired and proteins such as β-amyloid precursor protein (βAPP) accumulate proximal to the site of injury. As shown in Figs. 3A–E, βAPP+ axonal profiles were present in the white matter at thoracic spinal cord levels in mice sacrificed at 1–2 days after blast. Many of the βAPP+ profiles looked otherwise normal, but some appeared slightly swollen and some resembled enlarged terminal bulbs. We found βAPP+ axonal profiles in each of the 9 blasted mice, but in none of the 5 sham mice, we examined. The βAPP+ axonal profiles were common in lateral and ventral white matter and rare dorsally, and more abundant above (i.e. T4–8) than at (i.e. T9–10) the targeted level of the blast, and infrequent more caudally. For example, nearly all (23 of 26) βAPP+ labeled profiles in the T6–9 strip of lateral white matter shown in Figs. 3A–D were located in the rostral third of the strip.
Fig. 3.

Axonal injury at 2 days after blast. A–E) Horizontal sections immune stained for βAPP and using the RMO14 antibody. Rostral is toward the left. Panel A shows nearly the entire length of the lateral white matter on one side of a T6–9 strip of spinal cord. B–D are higher magnification views of the areas marked by boxes in A. βAPP+ axonal profiles are most numerous in the rostral third of the strip, whereas RMO14+ axonal profiles are found through the entire length of the strip. Note the large βAPP+ terminal bulb in panel C, and the linear arrays of RMO14+ profiles in panel D. There are no double-labeled axonal profiles. E shows the ventral white matter from ~T8–10 of a different mouse. The only βAPP+/RMO+ profile in E is marked by an arrow. Asterisks mark blood vessels at the ventral fissure. F) Transverse section from the same mouse as in A–D, at the T10 level, shows that RMO14+ profiles are extremely abundant in the lateral and ventral white matter. Optical density scale is shown inverted, so that RMO14+ profiles appear black. The level of background fluorescence has been increased so that the gray matter and section boundaries are visible, in order to provide orientation. Scale bar in F = 200 μm for A, E and F; 67 μm for B–D.
Another common sign of axonal injury is neurofilament compaction, which results from the partial digestion of the sidearms of medium- and heavy-neurofilaments, and can be detected by immunostaining with the RMO14 monoclonal antibody (Hall and Lee, 1995). We observed extensive RMO14 labeling in all 24 mice we examined that had been sacrificed at 1–2 days after blast, but no such labeling in any of the 11 mice with sham blasts. As shown in Fig. 3F, RMO14+ profiles were most numerous in the lateral and ventral white matter, occasionally present in the dCST, and rare in the dorsal columns and the gray matter. RMO14+ axonal profiles were most abundant between T4 and T12, sometimes present as caudal as L2, and much more numerous than those immunolabeled for βAPP. We occasionally detected βAPP+/RMO14+ profiles (Fig. 3E), but they were relatively rare, comprising only 9% (25 of 277) of βAPP axonal profiles at 1–2 days after blast. Moreover, RMO14+ profiles and βAPP+ profiles usually differed in their morphologies, with the RMO14+ profiles typically appearing vacuolated rather than bulbous.
Given the relative scarcity of both RMO14 and βAPP labeling in the dorsal white matter, we next used CST-YFP transgenic mice to directly visualize dCST axons, focusing on mice sacrificed 2 days after blast, when RMO14+ and βAPP+ labeled structures are most abundant in lateral and ventral white matter. The YFP fluorescence revealed numerous, bulbous axonal endings (Figs. 4B–E), some as large as 20 μm long and 10 μm wide, reminiscent of the terminal axonal bulbs that form after microtubule breakage. In accord with this, some of the YFP+ bulbs immunostained for βAPP (Fig. 4C). These, however, constituted only a small minority of the YFP + axonal bulbs (5.9%, or 36 of 607, in sections from 5 mice at 2 days post-blast), suggesting that βAPP accumulation greatly underestimates the extent of microtubule disruption, at least in the case of the dCST. Although some RMO14+ axonal profiles were present in the dCST (Fig. 4D), YFP+ axonal bulbs that labeled for RMO14 were exceedingly rare (only 4 out of >2000 total bulbs examined in 12 mice at 1–2 days post-blast).
Fig. 4.

Axonal injury in the CST at 2 days after blast. A) Transverse section from a normal CST-YFP mouse at ~T11 showing YFP+ axons in the main dorsal component of the CST (dSCT), the minor dorsolateral component of the CST and scattered ventrally. The intensity level of the background has been increased so that the gray matter and the section boundaries are visible. B–E) Horizontal sections of the dCST at 2 days after blast. For all, rostral is toward the left. The bulbous YFP+ axonal profiles in the dCST are indicative of microtubule breakage. Note that the YFP+ bulbs vary in shape and size. The narrower labeled profiles may indicate breakage of only some of the microtubules in those axons and/or recent breakage. C shows immunolabeling for βAPP. Several YFP+/βAPP+ axonal profiles are marked by arrows. D shows immunolabeling using the RMO14 antibody to visualize neurofilament compaction. No YFP+ bulbs are also labeled with the RMO14 antibody. E is a low magnification view of an adjacent section from the same mouse in C and D, showing that the YFP+ bulbs are clustered in two regions. C is from the T6–T7 cluster; D is from the T7–T8 cluster. Scale bar in F = 200 μm for A and E; 67 μm for B–D.
Interestingly, YFP+ axonal bulbs were typically clustered at discrete rostral–caudal locations within the dCST, separated from other such clusters by normal appearing YFP+ axons stretching for ~1 mm, such that clusters were about one segment apart. In the mouse whose spinal cord is shown in Fig. 4E, for example, one cluster of YFP+ axonal bulbs was present at approximately T6–T7, another at T7–T8, and a third cluster at T5–T6 (not shown), near the rostral edge of the section. Accordingly, for mice blasted later during the course of these experiments, we removed the spinal cord starting at more rostral levels and often found a cluster of YFP+ bulbs located approximately at T4–T5. The mice perfused 2 days after blast commonly had 2, often 3, and sometimes even 4 clusters of YFP+ bulbs in the dCST. Possible explanations for the clustering of YFP+ bulbs at discrete rostral–caudal positions in the dCST are provided in the Discussion.
Onset of axonal injury
Given that axonal injury was extensive by one day after blast, we next wanted to know how soon the various histological signs of axonal injury become manifest. Accordingly, we sacrificed two mice at 3 h and another two mice at 6 h after spinal cord blast. A few small YFP+ axonal bulbs were present in the dCST of both mice sacrificed at 3 h (Fig. 5A). By 6 h, the YFP+ bulbs were larger and more numerous, although still smaller and less abundant than at 1–2 days (Figs. 5B,C). Moreover, the YFP+ bulbs were already grouped into 1 or 2 clusters at these early times.
Fig. 5.

Onset of axonal injury. A) By 3 h after blast, YFP+ bulbs have formed in the dCST, but are much smaller and far less numerous than at 2 days after blast. B, C) By 6 h post-blast, YFP+ bulbs are more abundant and more obviously clustered than at 3 h. The YFP+ bulbs are also larger than at 3 h, but still considerably smaller than at 2 days. (Note that the images in Fig. 5A–C are at twice the magnification of those in Fig. 4B–D.) In C, several YFP+ bulbs that are also βAPP+ are marked by arrows. D) A few RMO14+ axonal profiles are present in the lateral white matter at 6 h after blast. The scattered YFP+ axons belong to the dorsolateral component of the CST. Scale bar in D = 100 μm for D; 67 μm for A–C.
We immunolabeled some sections from these mice with RMO14 and anti-βAPP. We did not detect RMO14 labeling in any YFP+ bulbs at either 3 or 6 h post-blast, in accord with the results from mice at 1–2 days after blast. In contrast, labeling for βAPP was more common (Fig. 5C). Strikingly, 37.8% (14 of 37) and 45.8% (11 of 24) of the YFP+ bulbs in the dCST labeled for βAPP at 3 h and at 6 h, respectively. Thus, although the number of YFP+ bulbs examined at early times was small, they expressed βAPP more frequently within 6 h of the injury than later, the incidence of co-expression declining to 8.1% by 1 day (30 of 372) and to 5.9% by 2 days (see above).
We also observed βAPP+ axonal profiles in the lateral and ventral white matter at 3 and 6 h (not shown), although they were less common than in the dCST. By contrast, RMO14+ axonal profiles, while few in number, were more abundant in the lateral and ventral white matter (Fig. 5D) than in the dCST.
Axonal swelling and die-back
Having established that blast causes extensive axonal injury within 2 days, we wanted to further explore the pathological process. Since βAPP immunolabeling revealed far fewer axonal bulbs in the dCST than did YFP reporter labeling, we turned to other markers to detect axonal bulbs. Neuronal class III β-tubulin is widely expressed in neurons and, as with other proteins that are normally transported anterogradely, it accumulates proximal to sites of microtubule breakage (Tang-Schomer et al., 2012). Double labeling for βAPP and with the monoclonal antibody TuJ1 showed that most βAPP+ axonal profiles in the lateral and ventral white matter indeed appeared swollen when viewed for TuJ1 immunofluorescence (Fig. 6A). However, numerous additional TuJ1+ axonal profiles were obviously swollen but did not label for βAPP. Thus, here too, more axons exhibit impaired axonal transport than was demonstrated with βAPP immunostaining. We therefore subsequently used YFP fluorescence in the dCST and TuJ1 immunostaining in the lateral and ventral white matter, rather than βAPP immunostaining, to visualize this type of pathology. In contrast to our observation that damaged axons rarely label for both βAPP and RMO14 in the lateral and ventral white matter (Fig. 2E), we found considerably more double-labeling using the TuJ1 and RMO14 antibodies. In some cases, the double-labeled axons were not obviously swollen, thereby simply verifying that axons exhibiting neurofilament compaction contain microtubules. However, some axons that appeared swollen with TuJ1 immunostaining were also RMO14+. Interestingly, we found that the percentage of swollen TuJ1+ axonal profiles labeled with RMO14 increased progressively with time after blast, from 2.4% (1 of 42) at 6 h, 25.5% (14 of 55) at 1 day, and then to 46.3% (37 of 80) at 2 days (Figs. 6B–E). Together, these results suggest that axonal bulbs become increasingly subject to proteolysis over the first few days following injury, perhaps as they gradually ‘die-back’ (Kerschensteiner et al., 2005). Moreover, the abundance of RMO14+ axonal profiles that did not appear swollen suggests that, distal to the point of the initial injury, axons may frequently exhibit neurofilament compaction. Thus, many RMO14+ axonal profiles may correspond to distal parts of the axon beginning to undergo Wallerian degeneration.
Fig. 6.

Microtubule breakage and neurofilament compaction in the lateral and ventral white matter. A) Most βAPP+ axonal profiles appear swollen when viewed for TuJ1 immunofluorescence (arrows). A few additional, obviously swollen TuJ1+ axonal profiles are present but do not label for βAPP (arrowheads). B–E) The proportion of swollen TuJ1+ axonal profiles that are also RMO14+ (arrows) increases progressively with time after blast. Arrowheads indicate swollen TuJ1+ axons/axonal bulbs that do not label with the RMO14 antibody. Asterisks in B, C, and E mark several RMO14+ profiles that do not have a swollen appearance when viewed for TuJ1 immunolabeling. F) TuJ1 immunolabeling, visualized with Alexa 647, shows several axonal bulbs (arrows), two of which are situated in the midst of gaps in the tissue (asterisks). G) The same field of view as F, now showing the background fluorescence of the tissue in the green channel, captured using high laser power and gain and with the contrast further enhanced in Adobe Photoshop. The same axonal bulbs immunostained with TuJ1 in panel F are visible (arrows) and the empty spaces they occupy are obvious (asterisks). Small arrows mark blood vessels at the midline. The intense green labeling corresponds to a few YFP+ axons in the ventral component of the CST. Scale bar in G = 100 μm for all panels.
Close inspection of the lateral and ventral white matter suggested that some swollen TuJ1+ axonal bulbs (arrowheads in Figs. 6C, E) were located within gaps in the tissue. To examine this further, we visualized the TuJ1 immunolabeling with a red fluorophore (Fig. 6F) and the background fluorescence of the spinal cord (Fig. 6G), by capturing the signal from the green channel with high laser power and gain and no immunolabeling. The white matter, with its swollen axonal bulbs and the empty spaces occupied by some of the bulbs, was then readily visualizable. The presence of such space suggests that the axonal bulbs therein had initially been larger and had since diminished in size, as would occur with progressive axon die-back.
Calpain activation and axonal injury
Calcium homeostasis has been shown to be perturbed in a variety of animal models of TBI. Increased internal Ca2+ activates calcium-dependent proteases, which rapidly leads to further adverse outcomes. Calpain is one such protease, whose activation can be detected using antibodies that bind to the breakdown products it produces, most commonly, a 150kD fragment of the cytoskeletal protein αII-spectrin (spectrin breakdown product, SBDP, Roberts-Lewis et al., 1994). To assess calpain activation following blast SCI, we therefore immunolabeled sections for SBDP150. At 2 days post-blast, we found little SBDP150 labeling in the dCST, with ~0.5% (7 out of ~1350) of the YFP+ bulbs we examined being SBDP150+. The frequency of SBDP150 expression was higher at 3 h after blast (3.3%, or 1 of 30) and even more so at 6 h (17.9%, or 17 of 95; Fig. 7A), thus following the same temporal pattern as βAPP expression in YFP+ CST bulbs (i.e. peaking at 6 h post-blast), albeit at even lower levels.
Fig. 7.

Spectrin proteolysis by calpain, visualized by SBDP150 immunolabeling. A) At 6 h after blast, several YFP+ bulbs in the dCST are labeled for SBDP150 (arrows). Arrowhead marks a SBDP150+ bulb that does not show obvious accumulation of YFP. B) Swollen TuJ1+ axonal profiles in the lateral white matter show intense SBDP150 immunolabeling along their margins at 6 h post-blast (arrows). Note that the images in panels A and B are shown at higher magnifications than those in panels C–F; accordingly, the swollen axonal profiles indicated by arrows in panel B are similar in size to those marked by arrowheads in panels E–F. C, D) At 1 day after blast, several axonal profiles label very intensely for SBDP150 but appear otherwise normal (asterisks). TuJ1 immunolabeling in C confirms that they indeed correspond to axons. In D, RMO14 immunolabeling of the same field of view shows that the SBDP150+ axonal profiles are a separate population from those labeled with RMO14. A few very large and numerous smaller RMO14+ axonal profiles can also be seen. E, F) At 2 days after blast, some SBDP150+ axonal profiles appear swollen (arrowheads) whereas others appear vacuolated and also label with RMO14 (arrows). E shows single labeling because the thin rim of SBDP150 underlying the axolemma is largely obscured by the RMO14 immunolabeling in F. Also note for panels D and F that RMO14+ axonal profiles are more abundant than SBDP150+ axonal profiles. Scale bar in F = 67 μm for A and B, 100 μm for C–F.
SBDP150+ axonal profiles were more common in the lateral and ventral white matter than in the dCST (Figs. 7B–F). At 3 and 6 h post-blast, some axonal profiles stained brightly for SBDP150, but appeared otherwise normal or only slightly swollen. Combining SBDP150 immunostaining with TuJ1 immunolabeling confirmed that the SBDP150+ profiles, some of which were small and might otherwise have been overlooked, were indeed axonal. SBDP150+ profiles were largely distinct from those labeled with RMO14. For example, only 4.8% (2 of 42) SBDP+ axonal profiles present at 6 h post-blast were also RMO14+.
At 1 and 2 days post-blast, SBDP150 labeling was less intense than at 3 and 6 h and SBDP150+ axonal profiles were typically either bulbous, suggesting concomitant microtubule disruption, or vacuolated, reminiscent of RMO14 labeling. The relative abundance of vacuolated SBDP+ profiles increased over time, and consistent with this observation, 8.3% (9 of 108) and 79.8% (103 of 129) at 1 and at 2 days, respectively, were also RMO14+. RMO14+ axonal profiles were far more abundant than SBDP150+ axonal profiles at both times (Figs. 7D, F). It is possible that SBDP150 immunostaining does not demonstrate the full extent of spectrin breakdown, because the thin rim of spectrin underlying the axolemma is more difficult to detect than the neurofilament-rich core of the axoplasm, particularly as degradation proceeds. Indeed, by 3 days post-blast, although the frequency of double-labeling had increased, with 88.9% (32 of 36) of SBDP150+ profiles also being RMO14+, SBDP150+ profiles were much less abundant than earlier.
Autophagy and fragmentation of distal axon segments
Many RMO14+ axonal profiles in the lateral and ventral white matter appeared to be vacuolated, reminiscent of RMO14+ axons that have been described following impact acceleration TBI (Marmarou et al., 2005; Stone et al., 2001). EM has shown that this general morphology is associated with mitochondrial swelling and autophagosome activity (Buki et al., 1999; Pettus and Povlishock, 1996; Stone et al., 2001). The presence of autophagosomes can be demonstrated at the LM level by using microtubule-associated proteins 1A/1B light chain 3B (LC3b) as a marker (Castillo et al., 2013; Knöferle et al., 2010). We therefore labeled a series of sections for LC3b and the RMO14 antibody. Between 6 h (the earliest we looked) and 2 days post-blast, many RMO14+ pro-files were also LC3b+, consistent with autophagy contributing to their vacuolated appearance (Figs. 8A–C). Single RMO14+ profiles were also common, but LC3b+ profiles that were not also labeled for RMO14 were very rare.
Fig. 8.

Autophagosomal activity in vacuolated RMO14+ axonal profiles. A–C) At 2 days after blast, many RMO14+ axonal profiles are also LC3b+ (arrows in the higher magnification views shown in panels B and C). Numerous RMO14+ axonal profiles that are not labeled for LC3b are also present (arrowheads in B). In A, the adjacent gray matter is visible at the bottom of the field of view. D–F) At 3 days after blast, vacuolated RMO14+/LC3b+ axonal profiles (arrows in F) are still common, and some are especially large. Arrowheads in E mark RMO-14+/LC3b-negative labeled profiles. Asterisks in A and D mark small RMO14+/LC3b-negative profiles that, based on their small size and simple morphology, may correspond to fragments of degenerating axons. Small arrows in D mark blood vessels at the midline of this ventral strip of spinal cord. G–I) A long segment of a vacuolated axon appears to be breaking up into separate fragments. Scale bar in G = 100 μm for A, D, and G; 50 μm for B, C, E, F, H and I.
The RMO14+/LC3b+ vacuolated profiles we observed in the lateral and ventral white matter at 2 days post-blast were typically larger than the RMO14+ profiles that were LC3b-negative. This size difference became more obvious by 3 days after blast (Figs. 8D–F). The very large size of some RMO14+/LC3b+ vacuolated profiles may be due to the accumulation of many organelles, leading to massive swelling before degradative processes transpire to reverse the swelling. The proportion of RMO14+ profiles that were LC3b-negative also seemed higher at 3 days than at 2 days. While some of these were vacuolated, others were particularly small and had a simple morphology suggesting they might be fragments of axons. These RMO14 + ‘fragments’ often formed longitudinally-oriented linear arrays, consistent with their representing the distal parts of axons undergoing Wallerian degeneration (Kerschensteiner et al., 2005). In support of this, as shown in Figs. 8G–I, a favorable plane of section ‘captured’ a long segment of a vacuolated axon seemingly breaking up into fragments. By 5 and 7 days post-blast, RMO14+ axonal profiles were typically small and very rare, and immunostaining for LC3b was virtually undetectable. The prolonged presence of small RMO14+ profiles is consistent with the relatively stable nature of neurofilaments compared to other cytoplasmic proteins, and suggests that mechanisms other than autophagosome activity, for example phagocytosis by microglia, might be responsible for their ultimate removal.
We also followed the progression of axonal injury over time in the dCST. At 3 days post-blast, YFP+ axonal bulbs were still present, but they were much less abundant and smaller than at 1 or 2 days (Figs. 9A–C). As compared to 2 days post-blast, a greater (but still small) proportion of YFP+ bulbs were also SBDP150+ (5 of 138, or 3.6%; Fig. 9B) or RMO14+ (9 of 88, or 10.2%; Fig. 9C). The YFP fluorescence also revealed very small, bright puncta (e.g. Fig. 9C), seemingly representing early signs of axon fragmentation. At 5 and 7 days (the latest we looked), few YFP+ bulbs were still present, fragmentation was more obvious, and small RMO14+ profiles were scattered along the dCST (Figs. 9D, E). Thus, dCST axons begin to show clear signs of degeneration by 3 days after blast.
Fig. 9.

Fragmentation of CST axons. A–C) At 3 days after blast, YFP+ axonal bulbs in the dCST are less abundant and typically smaller than at 2 days. Some YFP+ axonal bulbs are labeled for SBDP150 (arrows in B). Other YFP+ bulbs are RMO14+ (arrows in C). Panel A shows a cluster of YFP+ axonal bulbs located at the T6–7 level; B and C show adjacent sections of a cluster at the T5–6 level. These images are shown at the same magnification as those in Fig. 4B–E, allowing direct comparisons of YFP+ bulb sizes. D, E) At longer times after blast, YFP+ axons in the dCST appear to be fragmenting. The region shown in D is near T5; the region shown in E is near T7. RMO14+ profiles visible at 5 days post-blast (panel D) are generally smaller than at earlier post-blast times (compare with panel C and Fig. 4E). Scale bar in E = 100 μm for all panels.
Lower blast pressures
To gain further insight into how biomechanical forces produce axonal injury, we subjected several mice to lower blast pressures. The pressure waves for 20-psi blasts (Fig. 2) had smaller peak amplitudes and shorter durations than the 70-psi blasts, such that the amount of energy delivered by these two pressure levels differed by a factor of 4.8 (the ratio of the areas under the pressure curves). High-speed video recordings showed that 20-psi blasts caused roughly half the dorsiflexion of 70-psi blasts (average maximal dorsiflexion = 0.65 cm for two 20-psi blasts, vs 1.4 cm for six 70-psi blasts). We assessed axonal injury at 2 days after blast, when the effects of 70-psi blasts are most evident. Whereas hundreds of YFP+ axonal bulbs were present in the dCST between T4–8 (average = 706; range from ~450 to ~1000; n = 4) after 70-psi blasts, the 20-psi blasts produced very little dCST injury (average = 14 YFP+ axonal bulbs; range from 6 to 19; n = 4). Further, we observed very little neurofilament compaction or microtubule breakage in the lateral and ventral white matter of the mice that had been subjected to 20-psi blasts.
Degeneration of CST axons
We also evaluated the damage to the dCST by immunostaining for PKCγ, which specifically labels dCST axons, using transverse sections at T13-L1 from mice at 7 days after blast, to allow time for injured axons to degenerate. As shown in Figs. 10A and B, PKCγ immunolabeling in the dCST was less intense in blasted than in sham mice, and PKCγ+ axons (selected by thresholding, as described in Materials and methods) occupied a smaller area, suggesting a reduction in their numbers. The area above threshold for the dCST of blasted mice averaged 72.6% of the value for the sham mice (16 blast, 10 sham; p = 0.00407). This apparent loss of dCST axons at 1 week after blast is consistent with the presence of axonal bulbs at 1–2 days and the subsequent fragmentation of dCST axons described above.
We also assessed dCST injury in another set of mice sacrificed at 29–37 days post-blast, after they had undergone behavioral testing. The area occupied by PKCγ+ dCST axons in these mice averaged 92.4% that of their sham littermates (30 blast, 22 sham; p = 0.0338). That the decrease in dCST area at 29–37 days post-blast was not as pronounced as at 7 days post-blast (p = 0.0464; type 3 ttest, 2 samples with unequal variances) suggests that the dCST ‘recovered’ with time.
Motor behavior
Rotarod
Mice subjected to blast SCI were able to walk as soon as they recovered from the anesthesia. They did, however, show impairments on several motor tests. As shown in Fig. 11A, the mice stayed on the rotarod for an average of 208–209 s before blast. The day after sham blast, the sham mice took an average of 40 s longer to fall, presumably because the pre-blast testing served as an additional training session. In contrast, the blasted mice fell off the rotarod 5 s sooner. The change in latency to fall between the two time points was statistically significant for the sham mice (p = 0.007), but not for the blasted mice. In addition, the latencies for the blasted vs sham mice were significantly different from one another the day after blast (p = 0.033) but not the day before.
Fig. 11.

Deficits in motor behavior. A) Performance on rotarod, as measured by latency to fall, was slightly poorer 1 day after blast than before blast whereas sham mice showed significant improvement over this same time frame. B) Sham mice performed better on rotarod the day after sham blast than they did before blast, but did not show consistent further improvement over the next 4 weeks. In contrast, the performance of the blasted mice on rotarod was similar to before blast for the first 2 weeks and then gradually improved. C) Rump-height as a mouse traverses a narrow horizontal beam serves as a measure of its ability to support its hindquarters. Blasted mice showed a small deficit at 1 day, and then improved gradually over the rest of the 4-week long testing period. D) Diagonal phase dispersion for mice walking on the Digigait treadmill at 30 cm/s was significantly greater at 2 days post-blast, as compared to before blast. Sham mice showed no significant changes. The change in phase dispersion from before blast to after blast was significantly different between the blasted mice and their sham littermates. E, F) The number of mice subjected to blast injury that were able to maintain their position on the treadmill at 2 different speeds, 30 cm/s (E) and 20 cm/s (F), decreased during the 4 week-long period after blast. Asterisks indicate statistically significant differences. *p < 0.05; **p < 0.005; ***p < 0.0005; ****p < 0.0000005. The color of the asterisks (red or blue) indicates statistically significant difference between specified post-blast testing session and before blast for blasted mice or for sham mice, respectively. Black asterisks mark statistically significant differences between blasted and sham mice at the indicated post-blast testing session. See Results for additional detail. (For interpretation of the references to color in this figure legend, the reader is referred to the web version of this article.)
We tested a subset of these mice (15 blasted and 15 sham) on rotarod at roughly weekly intervals for up to 1 month after blast. As shown in Fig. 11B, the performance of the sham mice was better the day after sham blast than before blast (p = 0.01), due to the additional training (as explained above), but did not consistently show further improvement. In contrast, the performance of the blasted mice was relatively stable for the first 2 weeks after blast compared to before blast, and then gradually improved, such that their performance at 27 days post-blast was significantly better than before blast (p = 0.017).
Horizontal beam
Performance on a narrow horizontal beam is often used to evaluate balance, posture, and coordination, with rump-height distance as the animal traverses the beam providing an estimate of its ability to support its hindquarters (Apostolova et al., 2006). When the same 15 blasted and 15 sham mice tested weekly on rotarod were tested on horizontal beam, their performance followed similar temporal trends, with the blasted mice showing early deficits and gradually improving (Fig. 11C). The average rump-height was the same for the 2 groups of mice before blast (2.71 and 2.73 cm), but 1 day after blast it was lower for the blasted mice (2.55 cm) and greater for the shams (2.82 cm). The change in rump-height from before blast between the 2 groups of mice was significantly different for 1 day (p = 0.038) and for 6 days post-blast (p = 0.018). The rump-height for the sham mice continued to increase over the 4-week testing period, presumably related to the mice growing over this time frame. The blasted mice also showed a gradual increase, with their rump-height at 20 days (p = 0.0015) and at 27 days (p = 0.00057) being significantly greater than before blast. Thus, blasted mice showed initial deficits on both rotarod and horizontal beam, and clear improvement by 3–4 weeks.
Gait analysis
To further assess motor function, we performed gait analysis using the DigiGait treadmill system. Each mouse was tested at two speeds, 20 cm/s and 30 cm/s. As recently noted by Krizsan-Agbas et al. (2014), variability was greater at the lower speed, and so we focused our analysis on 30 cm/s. We tested 34 blast and 27 sham mice before blast and again at 2 days post-blast. The blasted mice exhibited small changes in several temporal parameters. For example, the proportion of time the forelimbs spent in stance vs swing, and in brake vs total stride duration showed small but significant increases in blasted but not in sham mice (data not shown). Blast also produced significant changes in diagonal phase dispersion. For mice on a treadmill at 30 cm/s, the right forelimb and the left hindlimb normally step at nearly the same time, as do the left forelimb and the right hindlimb, such that diagonal phase dispersion is normally close to 0%. At 2 days after blast, the phase differences between the right forelimb and the left hindlimb and between the left forelimb and the right hindlimb were significantly increased in the blasted mice but not in their sham littermates (Fig. 11D). Thus, interlimb coordination was slightly, but significantly, impaired at 2 days after blast.
We tested a subset of these mice on the DigiGait treadmill at weekly intervals for up to 4 weeks. The mice subjected to blast did not show consistent changes in any of their gait parameters over this time period, nor were there consistent differences between the blasted and sham mice. Whether the absence of persistent deficits indicated recovery of normal gait and/or if it reflected the increased variability in gait that other investigators have described when over-training rodents on treadmill systems (Beare et al., 2009; Krizsan-Agbas et al., 2014) is not clear. We did, however, observe a striking loss in the ability of many blasted mice to maintain their position on the treadmill over the 4-week long test period (Figs. 11E–F). For the 24 blasted mice that could run at 30 cm/s before blast, 8 mice (33.3%) could no longer do so by 4 weeks, whereas only one (4.5%) of the 22 sham mice that could initially run at 30 cm/s could no longer do so 4 weeks later. This difference between blasted and sham mice was highly significant (p = 2.3 × 10⁻¹²; chi square test). A similar temporal pattern of impairment was found for a treadmill speed of 20 cm/s. Of 26 blasted mice and 23 sham mice that could run at 20 cm/s before blast, 5 of the blasted mice (19.2%) but only 1 of the sham mice (4.3%) could no longer do so at 4 weeks. This difference too was highly significant (p = 5.2 × 10−05; chi square test).
Thus, the mice showed a gradual decrement in treadmill performance that was more pronounced at the higher treadmill speed. All blasted mice remained capable of free locomotion and showed sustained recovery on rotarod and horizontal beam. For example, 3 blasted mice that lost the ability to maintain their position at 30 cm/s on the treadmill, were also tested and showed improvement on rotarod and horizontal beam over the 4-week long time period. In addition, the average weights for both groups of mice (blasted and sham) were essentially the same before blast and again 4–5 weeks later. Thus, the gradual worsening of treadmill performance did not appear to reflect any underlying general health issue or disability.
Discussion
In these studies, we used the spinal cord with its extensive white matter tracts to produce axonal injury and characterize its progression. The cell bodies giving rise to most of the damaged axons are located at a distance from the region of spinal cord we targeted (i.e. in the brain), so direct injury to them is not a confounding factor, as it can be in animal models of TBI. Our approach also has the advantage of being a closed-body model and does not involve any surgery that might itself produce secondary effects. By using multiple markers of cytoskeletal function and integrity, and tracing progression over time, we have gained new insights into the complex nature of axonal injury mechanisms. In particular, our work shows that microtubule disruption, neurofilament compaction, and Ca2+-activated proteolytic cleavage are, in most cases, independent events that separately contribute to axonal degeneration.
Axonal injury in our model
We produced axonal injury by delivering high-pressure air blasts to the mouse dorsum and restricting the blast to ~3 segments of the vertebral column (~T8–10), by shielding all but that part of the mouse’s dorsum. Stabilizing the mouse within a narrow holder with its outstretched paws and tail taped to a cushioned platform limited the amount of mouse movement, but there was some dorsiflexion nonetheless. The mouse’s dorsiflexion occurred rapidly, reflecting the ~30 ms total duration of the 70-psi blast wave, and stretched axons in the white matter tracts by an estimated 30% over the length of the spinal cord. This ~30% increase in axonal length is well above the amount of elongation used in stretch models of axonal injury, although the rates of elongation are similar (Gennarelli et al., 1989; Iwata et al., 2004). Mice subjected to 20-psi blasts, while still showing dorsiflexion and ~15% increase in axonal length, however, exhibited minimal axonal injury. For example, after 20-psi blasts, an average of 14 axonal bulbs was present in the dCST at 2 days (compared to 706 axonal bulbs for 70-psi blasts). This small amount of axonal injury stands in contrast to results for unmyelinated axons in tissue culture studies where as little as a 5% increase in length results in deleterious increases in internal Ca2+ levels (Yuen et al., 2009; see also Iwata et al., 2004; Tang-Schomer et al., 2010, 2012). The higher resistance to injury in our experiments, as well as in other in vivo studies, is likely to be due to several factors: 1) myelinated axons (which constitute the vast majority of axons detected in tissue sections with light microscopy) are generally less susceptible to injury than unmyelinated axons (Reeves et al., 2005; Staal and Vickers, 2011), at least in part because their sodium channels (which dysfunction after stretch, leading to a cascade of events that includes excess Ca2+ entry; Iwata et al., 2004) are restricted to nodes of Ranvier rather than being widespread; 2) axons in the intact adult nervous system are wider, longer, and more mature than those examined in the tissue culture experiments, and thus would have greater tensile strength and a higher Ca2+ buffering capacity; and 3) the overall in vivo environment (for example, the presence of glial cells, particularly astrocytes) also contributes to maintaining homeostasis. More axonal injury than we observed also occurs following optic nerve stretch. For example, stretching the optic nerve by 20% (slightly more than our 20-psi blasts) is associated with a high incidence of axonal bulb formation (Saatman et al., 2003; see also Gennarelli et al., 1989; Maxwell and Graham, 1997). In this case, the surgery required to expose the optic nerve may produce hypoxia and/or inflammation, both of which can exacerbate axonal injury (Hellewell et al., 2010; Ziebell and Morganti-Kossmann, 2010).
The 50-fold higher abundance of axonal bulbs in the dCST produced by 70-psi blasts as compared to 20-psi blasts, but less than 2-fold difference in axonal elongation, suggests that biomechanical forces other than rapid stretch are primarily responsible for the differences in axonal injury. Indeed, the total energy delivered by 70-psi blasts was nearly 5-fold greater than that by 20-psi blasts. It is uncertain how much of the initial blast energy was absorbed by the overlying skin, muscle, and vertebral column, or was transformed into kinetic energy by the mouse’s dorsiflexion and foam’s compression, and so we do not know how much energy remained. Regardless of its amplitude, however, the residual blast energy would be transmitted as a wave through the spinal cord, producing compressive, tensile, and shear forces (Taylor and Ford, 2009). The forces for 70-psi blasts undoubtedly exceeded those for 20-psi blasts and thereby caused more axonal damage. It is also important to note that the duration of the forces experienced by the mice in our model is similar to that of forces sustained during traumatic incidents such as sports injuries, motor vehicle accidents, and falls (Guley et al., submitted for publication; Namjoshi et al., 2013; Wright et al., 2013).
The 70-psi blasts produced signs of axonal injury within 3 h, the earliest time we examined. The extent of axonal injury increased over time, with the abundance of injured axons reaching an apparent peak at 2 days after blast. This time course is similar to that described with optic nerve stretch (Saatman et al., 2003; Serbest et al., 2007) and pig rotational acceleration (Chen et al., 1999), but slower than that for the Marmarou model of impact acceleration TBI, which can produce a more severe injury (as evidenced by many animals needing respiratory support). Nonetheless, similar to impact acceleration TBI, we observed three distinct signs of axonal damage: microtubule disruption, spectrin degradation, and neurofilament compaction. In contrast to previous studies, however, our results suggest that these three manifestations of axonal injury are initiated largely independently of one another and lack any consistent relationship with axon caliber. Our findings for each type of axonal injury are described below.
Microtubule disruption
Axonal transport is impaired when microtubules break, with organelles (e.g. mitochondria and vesicles, i.e. ‘cargo’) accumulating proximal to the site of microtubule disruption, causing axons to swell. Microtubule breakage is typically demonstrated by immunostaining for βAPP, which is visualizable at sites where it accumulates, but is normally not sufficiently abundant to be detected. Proteins such as tubulin, tau, and heavy neurofilament subunits (Tang-Schomer et al., 2012) also accumulate at these sites, but are not used as frequently as βAPP to demonstrate microtubule breakage. We found a few βAPP+ axonal bulbs in the lateral and ventral white matter rostral to the level of blast within 3 h of blast and more at 1–2 days, but swollen axons were much more abundant with βIII-tubulin immunostaining. In contrast, for the dCST, βAPP immunostaining rarely, and βIII-tubulin immunostaining never revealed axonal bulbs, yet use of YFP reporter mice indicated the presence of hundreds of swollen axonal bulbs. Thus, βAPP immunostaining consistently underrepresented the true extent of microtubule breakage in our experiments. Such ‘under-reporting’ may also pertain to other studies of traumatic injury and, given that βAPP immunostaining is routinely used and considered the ‘gold standard’ for detecting axonal injury (Smith et al., 2013), represents a significant problem for evaluating its extent.
Spectrin degradation in the lateral and ventral white matter
Axons subjected to mild–moderate traumatic injury also exhibit immediate sodium channel dysfunction, which initiates a feed-forward process whereby intracellular Ca2+ levels rise for at least 1 h (Iwata et al., 2004). High internal Ca2+, in turn, activates enzymes such as calpain, leading to proteolysis of cellular components such as spectrin (Ma, 2013). In our studies, axonal profiles that stained brightly for the spectrin breakdown product SBDP150, indicative of μ-calpain activation (which requires only 3–50 μM Ca2+ for half-maximal activity), were present in the lateral and ventral white matter by 3 h and more abundant and intensely labeled by 6 h after blast. Spectrin’s location immediately below the axolemma would make it highly susceptible to events subsequent to an influx of calcium and thus, SBDP150 labeling may reveal the initial sites of axolemmal dysfunction. Many of the SBDP150+ axonal profiles we observed during the first day after blast were not obviously swollen, suggesting that μ-calpain had been activated without concurrent microtubule breakage.
SBDP150+ axonal profiles in the lateral and ventral white matter were rarely double-labeled (<10%) with RMO14 at either 6 h or 1 day after blast, suggesting that μ-calpain is also activated without concurrent neurofilament compaction. Although nearly 80% of SBDP+ axonal profiles were RMO14+ by 2 days, the early pathology we observed differs from that produced by moderate impact acceleration, where injured axons exhibit extensive SBDP150 and RMO14 double-labeling within 15 min (Buki et al., 1999, 2000). The latter findings have led to the inference that RMO14 labeling is a consequence of μ-calpain proteolysis of neurofilament sidearms (Buki and Povlishock, 2006). This interpretation is, however, inconsistent with biochemical data showing that RMO14 binds and μ-calpain cleaves NF-M at unrelated sites. Specifically, RMO14 recognizes an epitope within the rod domain (Hall and Lee, 1995), which constitutes the backbone of NF-M. In contrast, μ-calpain cleaves between lys 516 and ala 517 in NF-M’s sidearm domain (Shaw et al., 2004), which determines the spacing between adjacent neurofilaments. Moreover, after impact acceleration TBI, neurofilament sidearms are roughly half their normal length (Okonkwo et al., 1998), which is longer than would be expected from calpain proteolysis. Thus, calpain-mediated proteolysis of neurofilament sidearms may not invariably be the basis of neurofilament compaction and RMO14 binding (Yuan et al., 2012).
Neurofilament compaction in the lateral and ventral white matter
The most common form of axonal injury we observed in the lateral and ventral white matter after blast was neurofilament compaction. A few RMO14+ profiles were present as early as 3 h and increased in abundance over the next 2 days. During that entire time period, RMO14+ axonal profiles rarely showed immunolabeling for βAPP. With the more sensitive approach of using TuJ1 immunolabeling to detect swollen axonal bulbs, the incidence of RMO14 labeling, although higher (25.5% of all TuJ1+ bulbs, as compared to 10.9% of all βAPP + bulbs), still constituted a minority of the axonal bulbs we detected at 1 day. The observation that microtubule disruption and neurofilament compaction usually occur in different axons after blast SCI is consistent with results using the impact acceleration model of TBI (Marmarou et al., 2005; Stone et al., 2001), providing further support for the view that the two events are usually unrelated. Interestingly, by 2 days after blast, the proportion of swollen TuJ1+ axonal bulbs that were also RMO14+ had increased considerably (to 46.3%) and many seemed shrunken (Fig. 6). This sequence of events suggests that, with time, axonal swelling progresses to neurofilament pathology, as the accumulated cargo that initially caused the bulbs to swell, becomes degraded.
From 3 h to 2 days after blast, most RMO14+ axonal profiles had a vacuolated appearance and, in accord with this morphology, many RMO14+ axonal profiles stained for the autophagosome marker, LC3b. Autophagosome activity and LC3b immunolabeling are also known to increase within a few hours after optic nerve crush, as axons begin to degenerate (Knöferle et al., 2010). While LC3b immunolabeling is rarely used in studies of TBI, EM has shown damaged axons containing both large vacuoles and compacted neurofilaments (Pettus and Povlishock, 1996; Stone et al., 2001). Thus, the neurofilament pathology detected with RMO14 immunolabeling may be associated with autophagy. Further, although large vacuolated RMO14+/LC3b+ axonal profiles were common at 1–2 days after blast, smaller RMO14+/LC3b-negative axonal profiles were more abundant at 3 days. The latter are likely to correspond to the fragmenting distal portions of degenerating axons, some of which remained for up to 5 weeks post-blast. The lingering presence of small RMO14+ profiles is consistent with the stability of neurofilament proteins as compared to other cytoskeletal elements, and suggests that other mechanisms, such as phagocytosis by microglia, may be required for their ultimate removal.
Axonal injury in the CST
In contrast to the three types of axonal injury exhibited by axons in lateral and ventral white matter (microtubule disruption, spectrin degradation, and neurofilament compaction), the predominant form of pathology for axons in the dCST was microtubule disruption. For example, at 1–2 days after blast, many YFP+ axonal bulbs were present, indicating microtubule disruption, but fewer than 1% immunostained for the spectrin degradation marker SBDP150 or with the neurofilament compaction marker RMO14. This finding, together with the results described above for the lateral and ventral white matter, supports the view that microtubule breakage can occur without either neurofilament compaction or the increase in intracellular Ca2+ that is brought about by axolemmal dysfunction.
Interestingly, the percentage of YFP+ dCST bulbs with SBDP150 immunolabeling was higher earlier (3.3% at 3 h; 17.9% at 6 h) and later (3.6% at 3 days), than it was at 2 days (~0.5%), consistent with results from other injuries where calpain activation has been shown to be biphasic (Kampfl et al., 1996; Saatman et al., 2003; Serbest et al., 2007). By contrast, YFP+ dCST bulbs did not exhibit notable RMO14 immunolabeling at any time post-blast. However, some RMO14+ axonal profiles lacking YFP fluorescence were present in the dCST, typically at or below the level of blast, and may have corresponded to the distal portions of disconnected axons, whose YFP fluorescence had been quenched by the acidic autophagosomal environment (Castillo et al., 2013; Wang et al., 2011).
At 3 days after blast, YFP+ axonal bulbs were still present in the dCST, but were fewer in number and generally smaller than those seen at 2 days. About 10% were immunolabeled with RMO14 and nearly 4% with SBDP150 at this time, in contrast to 1–2 days, when <1% of the YFP+ axonal bulbs exhibited signs of neurofilament compaction or spectrin degradation. The presence of RMO14 and SBDP150 immunolabeling in some YFP+ axonal bulbs at 3 days after blast suggests that dCST axonal bulbs undergo proteolysis, as discussed above for bulbs in the lateral and ventral white matter, albeit more gradually. This proteolysis would also degrade the cargo that had accumulated above the level of microtubule disruption. More caudally (i.e. below mid-thoracic levels) and at later times (i.e, from 3–7 days after blast), many small YFP fragments were present in the dCST, indicative of progressive Wallerian degeneration of the distal portions of damaged axons.
A striking finding was that axonal bulbs in the dCST were typically grouped in 3 or 4 clusters at discrete rostral–caudal positions, located approximately a segment apart between T4/T5 and T8/T9. We think this clustering is related to the presence of the denticulate ligaments. Denticulate ligaments are located between successive spinal nerves and extend from the lateral margin of the pia mater to the dura mater, thereby stabilizing the spinal cord within the subarachnoid space. During blast SCI, they may serve to localize the biomechanical forces exerted on the spinal cord, which otherwise would be uniformly distributed, to discrete sites where microtubule breakage occurs. While this may result in the segmental clustering of axonal bulbs in the dCST, why axonal bulbs were not similarly clustered in the lateral and ventral white matter is unclear.
Relationship of axon caliber and biomechanical forces to axonopathology
Most axons demonstrated a single type of pathology during the first 24 h after blast: microtubule disruption (evidenced by axonal swelling), neurofilament compaction (evidenced by RMO14 immunolabeling), or calpain activation (evidenced by SBDP150 immunolabeling, most likely resulting from aberrant Ca2+ influx). This suggests that these cellular perturbations are initiated independently in different axons.
Our findings for RMO14 and SBDP150 run counter to the observation that axons typically label for both markers in studies on rats examined 15 min to 3 h after TBI induced by moderate impact acceleration (Buki et al., 1999, 2000). It is likely that responses to different types and magnitudes of injury follow different time courses, with moderate impact acceleration TBI probably being more severe than our blast injury and its sequelae transpiring more quickly. In contrast, our findings for microtubule disruption and neurofilament compaction confirm observations that individual axons rarely label for both βAPP and RMO14 during the first 24 h after moderate impact acceleration TBI (Marmarou et al., 2005; Stone et al., 2001). The independence of microtubule disruption and neurofilament compaction raises the question of why axons vary in their responses to injury. Marmarou et al. (2005) proposed that differences in neurofilament and microtubule composition between axons of different calibers play a role, noting that small caliber axons have a higher density of microtubules and large caliber axons a higher density of neurofilaments. Based on the high frequency of RMO14 immunolabeling in the wide axons (>7 μm) of the rat medial lemniscus and the high frequency of βAPP immunolabeling in the narrow axons (<2 μm) of the pyramidal tract, they suggested that wider axons, with their higher neurofilament content, are more likely to show RMO14 immunolabeling after injury.
Another possibility is that different biomechanical forces elicit different axonal responses. For example, tensile elongation (i.e. stretch) is typically associated with microtubule breakage (in the optic nerve – e.g. Gennarelli et al., 1989; Maxwell and Graham, 1997; Saatman et al., 2003; and in tissue culture – e.g. Tang-Schomer et al., 2010, 2012). For impact acceleration TBI, where βAPP+ axonal bulbs are more predominant compared to RMO14+ axons in the pyramidal tract than in the corpus callosum, Kallakuri et al. (2012) suggested that the longitudinally-running pyramidal tract axons primarily experience tensile elongation during the impact, whereas the transversely-running callosal axons primarily experience compression. Similarly, a higher level of tensile stress in the dorsal spinal cord in our experiments may explain why dCST axons predominantly exhibited microtubule breakage. In contrast, a higher level of compressive forces ventrally may explain why RMO14+ axonal profiles were more abundant in ventral than in dorsal white matter, especially if the spinal cord presses against the ventral surface of the vertebral column during the blast. There may even be contact with the sides of the vertebral column, if the compressed cord becomes significantly flattened; this may compress the lateral white matter where RMO14+ axonal profiles were also abundant. Interestingly, for a wide variety of spinal cord injury models (i.e. compression, dislocation, distraction, and hyperextension — Choo et al., 2007, 2008; Clarke et al., 2008; Lam et al., 2014; Li and Dai, 2009; Russell et al., 2012; Seifert et al., 2011), axonal injury has been shown to be most predominant in the ventral white matter. Such injury is not, however, necessarily limited to neurofilament compaction. These investigators focused on microtubule disruption, increased axolemmal permeability, and/or demyelination as the specific manifestations of axon damage, but did not assess neurofilament compaction. We also observed microtubule disruption and calpain activation in the ventral and lateral white matter, although each to a lesser extent than neurofilament compaction.
Several groups of investigators have developed finite element models of the spinal cord (Lam et al., 2014; Li and Dai, 2009; Maikos et al., 2008; Russell et al., 2012; Sparrey et al., 2009) to evaluate biomechanical forces during spinal injuries. Interestingly, these models generally predict significant damage to the ventral white matter, even without necessarily positing compression of the spinal cord against the inner surface of the vertebral column. Finite element models are limited, however, by the extent to which they consider detailed aspects of spinal cord structure and temporal changes in biomechanical forces during the particular traumatic event. For example, given that shearing forces are strongest at interfaces between tissues with different mechanical properties (Chen et al., 1999; McKee et al., 2009; Taylor and Ford, 2009; Taylor et al., 2014; Wright et al., 2013), the pia mater and ventral fissure should be included in finite element models, yet they rarely are. Indeed, we found RMO14+ axonal profiles were especially abundant in the ventral white matter immediately adjacent to the pia and along the ventral fissure (e. g. Figs. 3E–F). Additional features, such as the denticulate ligaments, which we postulate were responsible for axonal bulbs being clustered at discrete segmental levels of the dCST, will similarly be important to consider as more detailed finite element models are developed.
Our understanding of how the tensile, compressive, and shear forces associated with traumatic injuries affect the axolemma and cytoskeleton is currently incomplete (e.g. Geddes-Klein et al., 2006; LaPlaca and Prado, 2010; Meaney and Smith, 2011; Wright et al., 2013). Differences in volume/surface area ratio and cytoskeletal composition, together with molecular differences, undoubtedly contribute to the varying responses of neighboring axons to seemingly identical biomechanical forces. Yet even within the small area of the dCST, with its fairly uniform population of axons, injury was variable, with some axons showing microtubule disruption and other axons seemingly unperturbed. A greater understanding of why some axons are vulnerable to injury, while other axons are resistant, is crucial for finding ways to improve axonal survival after trauma.
Functional deficits, recovery and long-term implications
After blast SCI, mice were able to walk upon waking from anesthesia, in marked contrast to the hindlimb paralysis exhibited by mice after mid-thoracic spinal cord contusion or transection (e.g. Basso et al., 2006). The mice, however, were impaired on several motor tests. At 1 day, performance of the blasted mice on both rotarod and horizontal beam was poorer than their sham-blasted littermates. This most likely resulted from the lost function of injured descending axons whose distal portions had already become disconnected and would later degenerate. In addition, some intact axons may have shown dysregulated ionic fluxes and conduction block (e,g, James et al., 2011), thereby contributing to motor impairment at 1 day after blast, but regained normal function by the time of the 6 day post-blast testing session. Low rump height on the horizontal beam is largely due to postural and balance deficits. As such, it probably resulted from damage to the reticulospinal and/or vestibulospinal tracts, both located in the ventrolateral white matter (Watson and Harrison, 2012), where injured axons were highly abundant. Poor performance on rotarod may similarly have been due to postural and balance deficits caused by damage to the same two descending tracts. Damage to propriospinal circuitry and/or sensory input from the limbs may have also contributed to the poor rotarod performance.
The mice exhibited clear signs of recovery on both rotarod and horizontal beam by 2 weeks and reached performance levels similar to their sham-blasted littermates by 4 weeks. Interestingly, mice (and rats) subjected to more severe spinal cord injuries (e.g. hemisection and contusion) than our blast SCI show recovery of motor function over a generally similar time course, albeit to a lesser extent. Given the minimal regenerative ability of CNS axons, gradual motor recovery has been associated with compensatory mechanisms, most notably axonal sprouting (e.g. Bareyre et al., 2004, 2005; Fouad et al., 2001; Li et al., 2005; Weidner et al., 2001), and the incorporation of propriospinal neurons into new circuitry (e.g. Bareyre et al., 2004; Filli et al., 2014).
Gait analysis revealed small changes in several temporal parameters, for example, a decrease in the duration of forelimb swing. Decreased forelimb swing duration has previously been shown to accompany contusive injuries at thoracic levels, but surprisingly not unilateral or dorsal hemisection (Hamers et al., 2006; Hendriks et al, 2006; Redondo-Castro et al., 2013). Interlimb coordination was also diminished after blast SCI, as evidenced by an increase in diagonal phase dispersion. Similar, albeit greater, decreases in interlimb coordination have been reported after both unilateral hemisection and contusive injuries (Jin et al., 2014; Krizsan-Agbas et al., 2014; Redondo-Castro et al., 2013), and attributed to damage to the propriospinal tracts linking fore-limb and hindlimb central pattern generators (Jin et al., 2014).
Interestingly, there was no clear relationship between individual mouse performance on the different motor assessments — rotarod, horizontal beam, and treadmill. Moreover, in contrast to the improvement over time on rotarod and horizontal beam, the number of mice that could maintain their position on the treadmill gradually declined over the 4-week long testing period. This decline was not obviously associated with any specific change in gait per se and did not appear to reflect generally poor health (as might be evidenced by weight loss). One possibility is that axonal degeneration continued at a low level for weeks after the initial insult, probably due to persistent inflammatory responses, as has been reported for longer periods of times (months, and even years) in animal models as well as in human victims of TBI (Glushakova et al., 2014; Goldstein et al., 2012; Johnson et al., 2012).
The neuronal basis of the gradually worsening treadmill performance is uncertain. Damage to the reticulospinal and/or vestibulospinal tracts, implicated in the rotarod and horizontal beam deficits, would not explain why treadmill performance worsened with time whereas rotarod and horizontal beam performance improved. Damage to propriospinal tracts and/or to sensory input from the limbs may have contributed to the initial increase in diagonal phase dispersion, but interlimb coordination did not continue to worsen, and so this was not obviously related to inability of the mice to maintain their position on the treadmill. Although damage to axons in the raphespinal tract (located ventrolaterally) and rubrospinal tract (located dorsolaterally) was also likely, these tracts function in locomotion fine-tuning and skilled locomotor functions, respectively (Hendriks et al, 2006; Koopmans et al., 2012; Schucht et al., 2002). Similarly, the dCST, the one specific descending pathway we examined histologically, primarily mediates fine motor control (Courtine et al., 2007; Hamers et al., 2006). Moreover, although many dCST axons were visibly damaged at 1–3 days and showed an overall loss at 1 week, PKCγ immunolabeling suggested a return to near normal abundance by 4 weeks after blast, presumably due to sprouting (Bareyre et al., 2004; Fouad et al., 2001). Sprouting of dCST axons may contribute to the recovery of some motor functions (Bareyre et al., 2004), but treadmill performance would not be included among these and, even so, it gradually worsened with time.
Interestingly, ‘spinal cord concussion’ has been reported in the human population. It is most common at the two least stable spinal regions, cervical levels and the thoracolumbar junction (Zwimpfer and Bernstein, 1990). Although individuals with spinal stenosis may be more prone to spinal cord concussion, spinal defects are not a necessary precondition (Cantu and Cantu, 2005; Torg et al., 1997; Zwimpfer and Bernstein, 1990). Spinal cord concussion presents as tingling, numbing, and/or some loss of motor and sensory function in the arms and legs, and is thought to be due to an alteration in ionic fluxes starting immediately after an injury (Cantu and Cantu, 2005; Zwimpfer and Bernstein, 1990). Cervical spinal cord concussion often accompanies whiplash injuries in car accidents, for example, and also occurs in young male athletes following a blow to the head or a fall. Given that most individuals recover within a day, spinal cord concussion is likely to go unreported, especially when it is not accompanied by bony injury and/or brain concussion. Individual case studies further suggest that a forceful impact, not simply hyperextension, may be required, consistent with our data showing that axonal injury is abundant only with very high blast pressures.
Conclusions
We have found extensive axonal injury ensues within the white matter tracts of the spinal cord after a high-pressure air blast is delivered to the animal’s back. Forceful impacts may similarly affect the spinal cord in the human population during motor vehicle accidents, falls, sports activities, and proximity to explosive blasts. For the first 1–2 days following such traumatic events, before axonal degeneration becomes prominent, at least some damaged axons should be capable of repair. Accordingly, this time period would be the most critical for developing appropriate therapies to enhance repair. In this regard, many of the features and mechanisms underlying the axonopathologies we describe here are likely to also apply to mild TBI. Thus, studies of treatments that mitigate axon injury in our model may also help in reducing axonal loss after brain trauma. In addition, our observation that some functional deficits gradually worsen with time, presumably due to continuing axonal degeneration, indicates that there may be a longer time window for treating slowly degenerating axons that may yield benefit and should be explored.
It should also be noted that since spinal cord injury primarily damages descending axons, neurons in the brain are also affected by spinal cord injury (Wu et al., 2014). Thus, the health of the brain would also be put at risk any time the spinal cord is injured. Similarly, many brain injuries damage axons that descend to the spinal cord (Czeiter et al., 2008).
Importantly, our studies show that most axonal injury culminates in axonal degeneration, yet motor function returns to near normal levels despite permanent axonal loss. These results, together with those of Jin et al. (2014) for spinal cord and other investigators for TBI (e.g. Longhi et al., 2005; Mouzon et al., 2012; Petraglia et al., 2014; Shitaka et al., 2001) caution that, even for individual insults that are mild and without evident enduring effects, repeated trauma is likely to have cumulative adverse consequences.
Acknowledgments
We are grateful to Tonia Rex (previously at The University of Tennessee Health Science Center, and currently at Vanderbilt University) for providing advice and allowing us to use the blast cannon system she developed. We thank Robert Siman and Virginia Lee, both at the University of Pennsylvania, for kindly providing the Ab37 and RMO14 antibodies, respectively. We thank Marion Joni, Josh Rogers, and Michael Cagle for technical assistance and Dr. Jeffrey Marchetta (Dept. of Mechanical Engineering, University of Memphis) for the use of his high-speed video camera. This study was supported by funds from The Neuroscience Institute, Department of Anatomy and Neurobiology, and Spinal Cord Research Fund, all at The University of Tennessee Health Science Center, to MGH and from The Neuroscience Institute, The Office of the Dean of the College of Medicine, and The Methodist Hospitals Endowed Professorship in Neuroscience to AR.
References
- Apostolova I, Irintchev A, Schachner M. Tenascin-R restricts posttraumatic remodeling of motoneuron innervation and functional recovery after spinal cord injury in adult mice. J. Neurosci. 2006;26:7849–7859. doi: 10.1523/JNEUROSCI.1526-06.2006. [DOI] [PMC free article] [PubMed] [Google Scholar]
- Bareyre FM, Kerschensteiner M, Raineteau O, Mettenleiter TC, Weinmann O, Schwab ME. The injured spinal cord spontaneously forms a new intraspinal circuit in adult rats. Nat. Neurosci. 2004;7:269–277. doi: 10.1038/nn1195. [DOI] [PubMed] [Google Scholar]
- Bareyre FM, Kerschensteiner M, Misgeld T, Sanes JR. Transgenic labeling of the corticospinal tract for monitoring axonal responses to spinal cord injury. Nat. Med. 2005;11:1355–1360. doi: 10.1038/nm1331. [DOI] [PubMed] [Google Scholar]
- Basso DM, Fisher LC, Anderson AJ, Jakeman LB, McTigue DM, Popovich PG. Basso mouse scale for locomotion detects differences in recovery after spinal cord injury in five common mouse strains. J. Neurotrauma. 2006;23:635–659. doi: 10.1089/neu.2006.23.635. [DOI] [PubMed] [Google Scholar]
- Bazarian JJ, Donnelly K, Peterson DR, Warner GC, Zhu T, Zhong J. The relation between posttraumatic stress disorder and mild traumatic brain injury acquired during operations Enduring Freedom and Iraqi Freedom. J. Head Trauma Rehabil. 2013;28:1–12. doi: 10.1097/HTR.0b013e318256d3d3. [DOI] [PubMed] [Google Scholar]
- Beare J, Morehouse J, DeVries W, Enzmann G, Burke D, Magnuson D, Whittemore S. Gait analysis in normal and spinal contused mice using the TreadScan system. J. Neurotrauma. 2009;26:2045–2056. doi: 10.1089/neu.2009.0914. [DOI] [PMC free article] [PubMed] [Google Scholar]
- Bradbury EJ, Moon LD, Popat RJ, King VR, Bennett GS, Patel PN, Fawcett JW, McMahon SB. Chondroitinase ABC promotes functional recovery after spinal cord injury. Nature. 2002;416:636–640. doi: 10.1038/416636a. [DOI] [PubMed] [Google Scholar]
- Bricker-Anthony C, Hines-Beard J, Rex TS. Molecular changes and vision loss in a mouse model of closed-globe blast trauma. Invest. Ophthalmol. Vis. Sci. 2014a;55:4853–4862. doi: 10.1167/iovs.14-14353. [DOI] [PMC free article] [PubMed] [Google Scholar]
- Bricker-Anthony C, Hines-Beard J, D’Surney L, Rex TS. Exacerbation of blast-induced ocular trauma by an immune response. J. Neuroinflammation. 2014b;11:192. doi: 10.1186/s12974-014-0192-5. [DOI] [PMC free article] [PubMed] [Google Scholar]
- Buki A, Povlishock JT. All roads lead to disconnection? — traumatic axonal injury revisited. Acta Neurochir. (Wien) 2006;148:181–194. doi: 10.1007/s00701-005-0674-4. [DOI] [PubMed] [Google Scholar]
- Buki A, Siman R, Trojanowski JQ, Povlishock JT. The role of calpain-mediated spectrin proteolysis in traumatically induced axonal injury. J. Neuropathol. Exp. Neurol. 1999;58:365–375. doi: 10.1097/00005072-199904000-00007. [DOI] [PubMed] [Google Scholar]
- Buki A, Walker SA, Stone JR, Povlishock JT. Novel application of tyramide signal amplification (TSA): ultrastructural visualization of double-labeled immunofluorescent axonal profiles. J. Histochem. Cytochem. 2000;48:153–161. doi: 10.1177/002215540004800116. [DOI] [PubMed] [Google Scholar]
- Cafferty WB, Strittmatter SM. The Nogo–Nogo receptor pathway limits a spectrum of adult CNS axonal growth. J. Neurosci. 2006;26:12242–12250. doi: 10.1523/JNEUROSCI.3827-06.2006. [DOI] [PMC free article] [PubMed] [Google Scholar]
- Cantu RV, Cantu RC. Current thinking: return to play and transient quadriplegia. Curr. Sports Med. Rep. 2005;4:27–32. doi: 10.1007/s11932-005-0027-3. [DOI] [PubMed] [Google Scholar]
- Castillo K, Valenzuela V, Matus S, Nassif M, Oñate M, Fuentealba Y, Encina G, Irrazabal T, Parsons G, Court FA, Schneider BL, Armentano D, Hetz C. Measurement of autophagy flux in the nervous system in vivo. Cell Death Dis. 2013;4:e917. doi: 10.1038/cddis.2013.421. [DOI] [PMC free article] [PubMed] [Google Scholar]
- Chen XH, Meaney DF, Xu BN, Nonaka M, McIntosh TK, Wolf JA, Saatman KE, Smith DH. Evolution of neurofilament subtype accumulation in axons following diffuse brain injury in the pig. J. Neuropathol. Exp. Neurol. 1999;58:588–596. doi: 10.1097/00005072-199906000-00003. [DOI] [PubMed] [Google Scholar]
- Choo AM, Liu J, Lam CK, Dvorak M, Tetzlaff W, Oxland TR. Contusion, dislocation, and distraction: primary hemorrhage and membrane permeability in distinct mechanisms of spinal cord injury. J. Neurosurg. Spine. 2007;6:255–266. doi: 10.3171/spi.2007.6.3.255. [DOI] [PubMed] [Google Scholar]
- Choo AM, Liu J, Dvorak M, Tetzlaff W, Oxland TR. Secondary pathology following contusion, dislocation, and distraction spinal cord injuries. Exp. Neurol. 2008;212:490–506. doi: 10.1016/j.expneurol.2008.04.038. [DOI] [PubMed] [Google Scholar]
- Clarke EC, Choo AM, Liu J, Lam CK, Bilston LE, Tetzlaff W, Oxland TR. Anterior fracture-dislocation is more severe than lateral: a biomechanical and neuropathological comparison in rat thoracolumbar spine. J. Neurotrauma. 2008;25:371–383. doi: 10.1089/neu.2007.0421. [DOI] [PubMed] [Google Scholar]
- Courtine G, Bunge MB, Fawcett JW, Grossman RG, Kaas JH, Lemon R, Maier I, Martin J, Nudo RJ, Ramon-Cueto A, Rouiller EM, Schnell L, Wannier T, Schwab ME, Edgerton VR. Can experiments in nonhuman primates expedite the translation of treatments for spinal cord injury in humans? Nat. Med. 2007;13:561–566. doi: 10.1038/nm1595. [DOI] [PMC free article] [PubMed] [Google Scholar]
- Czeiter E, Pal J, Kovesdi E, Bukovics P, Luckl J, Doczi T, Buki A. Traumatic axonal injury in the spinal cord evoked by traumatic brain injury. J. Neurotrauma. 2008;25:205–213. doi: 10.1089/neu.2007.0331. [DOI] [PubMed] [Google Scholar]
- Filli L, Engmann AK, Zörner B, Weinmann O, Moraitis T, Gullo M, Kasper H, Schneider R, Schwab ME. Bridging the gap: a reticulo-propriospinal detour bypassing an incomplete spinal cord injury. J. Neurosci. 2014;34:13399–13410. doi: 10.1523/JNEUROSCI.0701-14.2014. [DOI] [PMC free article] [PubMed] [Google Scholar]
- Fouad K, Pedersen V, Schwab ME, Brosamle C. Cervical sprouting of corticospinal fibers after thoracic spinal cord injury accompanies shifts in evoked motor responses. Curr. Biol. 2001;11:1766–1770. doi: 10.1016/s0960-9822(01)00535-8. [DOI] [PubMed] [Google Scholar]
- Geddes-Klein DM, Schiffman KB, Meaney DF. Mechanisms and consequences of neuronal stretch injury in vitro differ with the model of trauma. J. Neurotrauma. 2006;23:193–204. doi: 10.1089/neu.2006.23.193. [DOI] [PubMed] [Google Scholar]
- Gennarelli TA, Thibault LE, Tipperman R, Gennarelli LM, Duhaime AC, Boock R, Greenberg J. Axonal injury in the optic nerve: a model that simulates diffuse axonal injury in the brain. J. Neurosurg. 1989;71:244–253. doi: 10.3171/jns.1989.71.2.0244. [DOI] [PubMed] [Google Scholar]
- Giza CC, Hovda DA. The new neurometabolic cascade of concussion. Neurosurgery. 2014;75:S24–S33. doi: 10.1227/NEU.0000000000000505. [DOI] [PMC free article] [PubMed] [Google Scholar]
- Glushakova OY, Johnson D, Hayes RL. Delayed increases in microvascular pathology after experimental traumatic brain injury are associated with prolonged in-flammation, blood–brain barrier disruption, and progressive white matter damage. J. Neurotrauma. 2014;31:1180–1193. doi: 10.1089/neu.2013.3080. [DOI] [PubMed] [Google Scholar]
- Goldstein LE, Fisher AM, Tagge CA, Zhang XL, Velisek L, Sullivan JA, Upreti C, Kracht JM, Ericsson M, Wojnarowicz MW, Goletiani CJ, Maglakelidze GM, Casey N, Moncaster JA, Minaeva O, Moir RD, Nowinski CJ, Stern RA, Cantu RC, Geiling J, Blusztajn JK, Wolozin BL, Ikezu T, Stein TD, Budson AE, Kowall NW, Chargin D, Sharon A, Saman S, Hall GF, Moss WC, Cleveland RO, Tanzi RE, Stanton PK, McKee AC. Chronic traumatic encephalopathy in blast-exposed military veterans and a blast neurotrauma mouse model. Sci. Transl. Med. 2012;4:134ra60. doi: 10.1126/scitranslmed.3003716. (16) [DOI] [PMC free article] [PubMed] [Google Scholar]
- Guley NG, Rogers JT, Del Mar NA, Deng Y, Islam RM, D’Surney L, Ferrell J, Deng B, Hines-Beard J, Bu W, Ren H, Elberger AJ, Marchetta JG, Rex TS, Honig MG, Reiner A. A novel closed-head model of mild traumatic brain injury using focal primary overpressure blast to the cranium in mice. J. Neurotrauma. 2015 doi: 10.1089/neu.2015.3886. (submitted for publication) [DOI] [PMC free article] [PubMed] [Google Scholar]
- Hall GF, Lee VM-Y. Neurofilament sidearm proteolysis is a prominent early effect of axotomy in lamprey giant central neurons. J. Comp. Neurol. 1995;353:38–49. doi: 10.1002/cne.903530106. [DOI] [PubMed] [Google Scholar]
- Hamers FP, Koopmans GC, Joosten EA. CatWalk-assisted gait analysis in the assessment of spinal cord injury. J. Neurotrauma. 2006;23:537–548. doi: 10.1089/neu.2006.23.537. [DOI] [PubMed] [Google Scholar]
- Harrison M, O’Brien A, Adams L, Cowin G, Ruitenberg MJ, Sengul G, Watson C. Vertebral landmarks for the identification of spinal cord segments in the mouse. Neuroimage. 2013;68:22–29. doi: 10.1016/j.neuroimage.2012.11.048. [DOI] [PubMed] [Google Scholar]
- Heldt SA, Elberger AJ, Deng Y, Guley NH, Del Mar N, Rogers J, Choi GW, Ferrell J, Rex TS, Honig MG, Reiner A. A novel closed-head model of mild traumatic brain injury caused by primary overpressure blast to the cranium produces sustained emotional deficits in mice. Front. Neurol. 2014;5 doi: 10.3389/fneur.2014.00002. (Article 2) [DOI] [PMC free article] [PubMed] [Google Scholar]
- Hellewell SC, Yan EB, Agyapomaa DA, Bye N, Morganti-Kossmann MC. Post-traumatic hypoxia exacerbates brain tissue damage: analysis of axonal injury and glial responses. J. Neurotrauma. 2010;27:1997–2010. doi: 10.1089/neu.2009.1245. [DOI] [PubMed] [Google Scholar]
- Hendriks WT, Eggers R, Ruitenberg MJ, Blits B, Hamers FP, Verhaagen J, Boer GJ. Profound differences in spontaneous long-term functional recovery after de-fined spinal tract lesions in the rat. J. Neurotrauma. 2006;23:18–35. doi: 10.1089/neu.2006.23.18. [DOI] [PubMed] [Google Scholar]
- Hines-Beard J, Marchetta J, Gordon S, Chaum E, Geisert EE, Rex TS. A mouse model of ocular blast injury that induces closed globe anterior and posterior pole damage. Exp. Eye Res. 2012;99:63–70. doi: 10.1016/j.exer.2012.03.013. [DOI] [PMC free article] [PubMed] [Google Scholar]
- Iwata A, Stys PK, Wolf JA, Chen XH, Taylor AG, Meaney DF, Smith DH. Traumatic axonal injury induces proteolytic cleavage of the voltage-gated sodium channels modulated by tetrodotoxin and protease inhibitors. J. Neurosci. 2004;24:4605–4613. doi: 10.1523/JNEUROSCI.0515-03.2004. [DOI] [PMC free article] [PubMed] [Google Scholar]
- James ND, Bartus K, Grist J, Bennett DLH, McMahon SB, Bradbury EJ. Conduction failure following spinal cord injury: functional and anatomical changes from acute to chronic stages. J. Neurosci. 2011;31:18543–18555. doi: 10.1523/JNEUROSCI.4306-11.2011. [DOI] [PMC free article] [PubMed] [Google Scholar]
- Jin Y, Bouyer J, Haas C, Fischer I. Behavioral and anatomical consequences of repetitive mild thoracic spinal cord contusion injury in the rat. Exp. Neurol. 2014;257:57–69. doi: 10.1016/j.expneurol.2014.04.016. [DOI] [PubMed] [Google Scholar]
- Johnson VE, Stewart W, Smith DH. Widespread tau and amyloid-beta pathology many years after a single traumatic brain injury in humans. Brain Pathol. 2012;22:142–149. doi: 10.1111/j.1750-3639.2011.00513.x. [DOI] [PMC free article] [PubMed] [Google Scholar]
- Jordan BD. The clinical spectrum of sport-related traumatic brain injury. Nat. Rev. Neurol. 2013;9:222–230. doi: 10.1038/nrneurol.2013.33. [DOI] [PubMed] [Google Scholar]
- Kallakuri S, Li Y, Zhou R, Bandaru S, Zakaria N, Zhang L, Cavanaugh JM. Impaired axoplasmic transport is the dominant injury induced by an impact acceleration injury device: an analysis of traumatic axonal injury in pyramidal tract and corpus callosum of rats. Brain Res. 2012;1452:29–38. doi: 10.1016/j.brainres.2012.02.065. [DOI] [PubMed] [Google Scholar]
- Kampfl A, Posmantur R, Nixon R, Grynspan F, Zhao X, Liu SJ, Newcomb JK, Clifton GL, Hayes RL. μ-Calpain activation and calpain-mediated cytoskeletal proteolysis following traumatic brain injury. J. Neurochem. 1996;67:1575–1583. doi: 10.1046/j.1471-4159.1996.67041575.x. [DOI] [PubMed] [Google Scholar]
- Kerschensteiner M, Schwab ME, Lichtman JW, Misgeld T. In vivo imaging of axonal degeneration and regeneration in the injured spinal cord. Nat. Med. 2005;11:572–577. doi: 10.1038/nm1229. [DOI] [PubMed] [Google Scholar]
- Knöferle J, Koch JC, Ostendorf T, Michel U, Planchamp V, Vutova P, Tönges L, Stadelmann C, Bruck W, Bähr M, Lingor P. Mechanisms of acute axonal degeneration in the optic nerve in vivo. Proc. Natl. Acad. Sci. U. S. A. 2010;107:6064–6069. doi: 10.1073/pnas.0909794107. [DOI] [PMC free article] [PubMed] [Google Scholar]
- Koopmans GC, Deumens R, Honig WM, Hamers FP, Mey J, van Kleef M, Joosten EA. Functional recovery, serotonergic sprouting, and endogenous progenitor fates in response to delayed environmental enrichment after spinal cord injury. J. Neurotrauma. 2012;29:514–527. doi: 10.1089/neu.2011.1949. [DOI] [PubMed] [Google Scholar]
- Krizsan-Agbas D, Winter MK, Eggimann LS, Meriwether J, Berman NE, Smith PG, McCarson KE. Gait analysis at multiple speeds reveals differential functional and structural outcomes in response to graded spinal cord injury. J. Neurotrauma. 2014;31:846–856. doi: 10.1089/neu.2013.3115. [DOI] [PMC free article] [PubMed] [Google Scholar]
- Lam CJ, Assinck P, Liu J, Tetzlaff W, Oxland TR. Impact depth and the interaction with impact speed affect the severity of contusion spinal cord injury in rats. J. Neurotrauma. 2014;31:1985–1997. doi: 10.1089/neu.2014.3392. [DOI] [PMC free article] [PubMed] [Google Scholar]
- LaPlaca MC, Prado GR. Neural mechanobiology and neuronal vulnerability to traumatic loading. J. Biomech. 2010;43:71–78. doi: 10.1016/j.jbiomech.2009.09.011. [DOI] [PubMed] [Google Scholar]
- Lehman EJ, Hein MJ, Baron SL, Gersic CM. Neurodegenerative causes of death among retired National Football League players. Neurology. 2012;79:1970–1974. doi: 10.1212/WNL.0b013e31826daf50. [DOI] [PMC free article] [PubMed] [Google Scholar]
- Li X-F, Dai L-Y. Three-dimensional finite element model of the cervical spinal cord: preliminary results of injury mechanism analysis. Spine. 2009;34:1140–1147. doi: 10.1097/BRS.0b013e31819e2af1. [DOI] [PubMed] [Google Scholar]
- Li S, Kim J-E, Budel S, Hampton TG, Strittmatter SM. Transgenic inhibition of Nogo-66 receptor function allows axonal sprouting and improved locomotion after spinal injury. Mol. Cell. Neurosci. 2005;29:26–39. doi: 10.1016/j.mcn.2004.12.008. [DOI] [PMC free article] [PubMed] [Google Scholar]
- Longhi L, Saatman KE, Fujimoto S, Raghupathi R, Meaney DF, Davis J, McMillan A, Conte V, Laurer HL, Stein S, Stocchetti N, McIntosh TK. Temporal window of vulnerability to repetitive experimental concussive brain injury. Neurosurgery. 2005;56:364–374. doi: 10.1227/01.neu.0000149008.73513.44. [DOI] [PubMed] [Google Scholar]
- Ma M. Role of calpains in the injury-induced dysfunction and degeneration of the mammalian axon. Neurobiol. Dis. 2013;60:61–79. doi: 10.1016/j.nbd.2013.08.010. [DOI] [PMC free article] [PubMed] [Google Scholar]
- Ma M, Basso DM, Walters P, Stokes BT, Jakeman LB. Behavioral and histological outcomes following graded spinal cord contusion injury in the C57Bl/6 mouse. Exp. Neurol. 2001;169:239–254. doi: 10.1006/exnr.2001.7679. [DOI] [PubMed] [Google Scholar]
- Maikos JT, Qian Z, Metaxas D, Shreiber DI. Finite element analysis of spinal cord injury in the rat. J. Neurotrauma. 2008;25:795–816. doi: 10.1089/neu.2007.0423. [DOI] [PubMed] [Google Scholar]
- Manning CF, Bundros AM, Trimmer JS. Benefits and pitfalls of secondary antibodies: why choosing the right secondary is of primary importance. PLoS One. 2012;7(6):e38313. doi: 10.1371/journal.pone.0038313. [DOI] [PMC free article] [PubMed] [Google Scholar]
- Marmarou A, Foda MA, van den Brink W, Campbell J, Kita H, Demetriadou K. A new model of diffuse brain injury in rats. Part I. Pathophysiology and biomechanics. J. Neurosurg. 1994;80:291–300. doi: 10.3171/jns.1994.80.2.0291. [DOI] [PubMed] [Google Scholar]
- Marmarou CR, Walker SA, Davis CL, Povlishock JT. Quantitative analysis of the relationship between intraaxonal neurofilament compaction and impaired axonal transport following diffuse traumatic brain injury. J. Neurotrauma. 2005;22:1066–1080. doi: 10.1089/neu.2005.22.1066. [DOI] [PubMed] [Google Scholar]
- Maxwell WL, Graham DI. Loss of axonal microtubules and neurofilaments after stretch-injury to guinea pig optic nerve fibers. J. Neurotrauma. 1997;14:603–614. doi: 10.1089/neu.1997.14.603. [DOI] [PubMed] [Google Scholar]
- McKee AC, Cantu RC, Nowinski CJ, Hedley-Whyte ET, Gavett BE, Budson AE, Santini VE, Lee HS, Kubilus CA, Stern RA. Chronic traumatic encephalopathy in athletes: progressive tauopathy following repetitive head injury. J. Neuropathol. Exp. Neurol. 2009;68:709–735. doi: 10.1097/NEN.0b013e3181a9d503. [DOI] [PMC free article] [PubMed] [Google Scholar]
- McKee AC, Stern RA, Nowinski CJ, Stein TD, Alvarez VE, Daneshvar DH, Lee HS, Wojtowicz SM, Hall G, Baugh CM, Riley DO, Kubilus CA, Cormier KA, Jacobs MA, Martin BR, Abraham CR, Ikezu T, Reichard RR, Wolozin BL, Budson AE, Goldstein LE, Kowall NW, Cantu RC. The spectrum of disease in chronic traumatic encephalopathy. Brain. 2013;136:43–64. doi: 10.1093/brain/aws307. [DOI] [PMC free article] [PubMed] [Google Scholar]
- Meaney DF, Smith DH. Biomechanics of concussion. Clin. Sports Med. 2011;30:19–31. doi: 10.1016/j.csm.2010.08.009. [DOI] [PMC free article] [PubMed] [Google Scholar]
- Mouzon B, Chaytow H, Crynen G, Bachmeier C, Stewart J, Mullan M, Stewart W, Crawford F. Repetitive mild traumatic brain injury in a mouse model produces learning and memory deficits accompanied by histological changes. J. Neurotrauma. 2012;29:2761–2773. doi: 10.1089/neu.2012.2498. [DOI] [PubMed] [Google Scholar]
- Namjoshi DR, Good C, Cheng WH, Panenka W, Richards D, Cripton PA, Wellington CL. Towards clinical management of traumatic brain injury: a review of models and mechanisms from a biomechanical perspective. Dis. Model. Mech. 2013;6:1325–1338. doi: 10.1242/dmm.011320. [DOI] [PMC free article] [PubMed] [Google Scholar]
- Okonkwo DO, Pettus EH, Moroi J, Povlishock JT. Alteration of the neurofilament sidearm and its relation to neurofilament compaction occurring with traumatic axonal injury. Brain Res. 1998;784:1–6. doi: 10.1016/s0006-8993(97)01075-5. [DOI] [PubMed] [Google Scholar]
- Petraglia AL, Plog BA, Dayawansa S, Dashnaw ML, Czerniecka K, Walker CT, Chen M, Hyrien O, Iliff JJ, Deane R, Huang JH, Nedergaard M. The pathophysiology underlying repetitive mild traumatic brain injury in a novel mouse model of chronic traumatic encephalopathy. Surg. Neurol. Int. 2014;5:184. doi: 10.4103/2152-7806.147566. [DOI] [PMC free article] [PubMed] [Google Scholar]
- Pettus EH, Povlishock JT. Characterization of a distinct set of intra-axonal ultra-structural changes associated with traumatically induced alteration in axolemmal permeability. Brain Res. 1996;722:1–11. doi: 10.1016/0006-8993(96)00113-8. [DOI] [PubMed] [Google Scholar]
- Redondo-Castro E, Torres-Espín A, García-Alías G, Navarro X. Quantitative assessment of locomotion and interlimb coordination in rats after different spinal cord injuries. J. Neurosci. Methods. 2013;213:165–178. doi: 10.1016/j.jneumeth.2012.12.024. [DOI] [PubMed] [Google Scholar]
- Reeves TM, Phillips LL, Povlishock JT. Myelinated and unmyelinated axons of the corpus callosum differ in vulnerability and functional recovery following traumatic brain injury. Exp. Neurol. 2005;196:126–137. doi: 10.1016/j.expneurol.2005.07.014. [DOI] [PubMed] [Google Scholar]
- Reiner A, Heldt S, Presley CS, Guley NH, Elberger AJ, Deng Y, D’Surney L, Rogers JT, Ferrell J, Bu W, Del Mar N, Honig MG, Gurley SN, Moore BM. Emotional, sensory and motor deficits in mice after closed-head mild traumatic brain injury are alleviated by the novel CB2 inverse agonist SMM-189. Int. J. Mol. Sci. 2014;16:758–787. doi: 10.3390/ijms16010758. [DOI] [PMC free article] [PubMed] [Google Scholar]
- Roberts-Lewis JM, Savage MJ, Marcy VR, Pinsker LR, Siman R. Immunolocalization of calpain I-mediated spectrin degradation to vulnerable neurons in the ischemic gerbil brain. J. Neurosci. 1994;14:3934–3944. doi: 10.1523/JNEUROSCI.14-06-03934.1994. [DOI] [PMC free article] [PubMed] [Google Scholar]
- Russell CM, Choo AM, Tetzlaff W, Chung T-E, Oxland TR. Maximum principal strain correlates with spinal cord tissue damage in contusion and dislocation injuries in the rat cervical spine. J. Neurotrauma. 2012;29:1574–1585. doi: 10.1089/neu.2011.2225. [DOI] [PubMed] [Google Scholar]
- Saatman KE, Abai B, Grosvenor A, Vorwerk CK, Smith DH, Meaney DF. Traumatic axonal injury results in biphasic calpain activation and retrograde transport impairment in mice. J. Cereb. Blood Flow Metab. 2003;23:34–42. doi: 10.1097/01.WCB.0000035040.10031.B0. [DOI] [PubMed] [Google Scholar]
- Schucht P, Raineteau O, Schwab ME, Fouad K. Anatomical correlates of locomotor recovery following dorsal and ventral lesions of the rat spinal cord. Exp. Neurol. 2002;176:143–153. doi: 10.1006/exnr.2002.7909. [DOI] [PubMed] [Google Scholar]
- Seifert JL, Bell JE, Elmer BB, Sucatoc DJ, Romero MI. Characterization of a novel bidirectional distraction spinal cord injury animal model. J. Neurosci. Methods. 2011;197:97–103. doi: 10.1016/j.jneumeth.2011.02.003. [DOI] [PubMed] [Google Scholar]
- Serbest G, Burkhardt MF, Siman R, Raghupathi R, Saatman KE. Temporal profiles of cytoskeletal protein loss following traumatic axonal injury in mice. Neurochem. Res. 2007;32:2006–2014. doi: 10.1007/s11064-007-9318-9. [DOI] [PubMed] [Google Scholar]
- Shaw G, Yang C, Zhang L, Cook P, Pike B, Hill WD. Characterization of the bovine neurofilament NF-M protein and cDNA sequence, and identification of in vitro and in vivo calpain cleavage sites. Biochem. Biophys. Res. Commun. 2004;325:619–625. doi: 10.1016/j.bbrc.2004.09.223. [DOI] [PubMed] [Google Scholar]
- Shitaka Y, Tran HT, Bennett RE, Sanchez L, Levy MA, Dikranian K, Brody DL. Repetitive closed-skull traumatic brain injury in mice causes persistent multifocal axonal injury and microglial reactivity. J. Neuropathol. Exp. Neurol. 2001;70:551–567. doi: 10.1097/NEN.0b013e31821f891f. [DOI] [PMC free article] [PubMed] [Google Scholar]
- Smith DH, Hicks R, Povlishock JT. Therapy development for diffuse axonal injury. J. Neurotrauma. 2013;30:307–323. doi: 10.1089/neu.2012.2825. [DOI] [PMC free article] [PubMed] [Google Scholar]
- Sparrey CJ, Manley GT, Keaveny TM. Effects of white, grey, and pia mater properties on tissue level stresses and strains in the compressed spinal cord. J. Neurotrauma. 2009;26:585–595. doi: 10.1089/neu.2008.0654. [DOI] [PMC free article] [PubMed] [Google Scholar]
- Staal JA, Vickers JC. Selective vulnerability of non-myelinated axons to stretch injury in an in vitro co-culture system. J. Neurotrauma. 2011;28:841–847. doi: 10.1089/neu.2010.1658. [DOI] [PubMed] [Google Scholar]
- Stone JR, Singleton RH, Povlishock JT. Intra-axonal neurofilament compaction does not evoke local axonal swelling in all traumatically injured axons. Exp. Neurol. 2001;172:320–331. doi: 10.1006/exnr.2001.7818. [DOI] [PubMed] [Google Scholar]
- Tang-Schomer MD, Patel AR, Baas PW, Smith DH. Mechanical breaking of microtubules in axons during dynamic stretch injury underlies delayed elasticity, microtubule disassembly, and axon degeneration. FASEB J. 2010;24:1401–1410. doi: 10.1096/fj.09-142844. [DOI] [PMC free article] [PubMed] [Google Scholar]
- Tang-Schomer MD, Johnson VE, Baas PW, Stewart W, Smith DH. Partial interruption of axonal transport due to microtubule breakage accounts for the formation of periodic varicosities after traumatic axonal injury. Exp. Neurol. 2012;233:364–372. doi: 10.1016/j.expneurol.2011.10.030. [DOI] [PMC free article] [PubMed] [Google Scholar]
- Taylor PA, Ludwigsen JS, Ford CC. Investigation of blast-induced traumatic brain injury. Brain Inj. 2014;28:879–895. doi: 10.3109/02699052.2014.888478. [DOI] [PMC free article] [PubMed] [Google Scholar]
- Taylor PA, Ford CC. Simulation of blast-induced early-time intracranial wave physics leading to traumatic brain injury. J. Biomed. Engin. 2009;131:061007. doi: 10.1115/1.3118765. [DOI] [PubMed] [Google Scholar]
- Torg JS, Corcoran TA, Thibault LE, Pavlov H, Sennett BJ, Naranja RJ, Jr., Priano S. Cervical cord neurapraxia: classification, pathomechanics, morbidity, and management guidelines. J. Neurosurg. 1997;87:843–850. doi: 10.3171/jns.1997.87.6.0843. [DOI] [PubMed] [Google Scholar]
- Wang J, Hamm RJ, Povlishock JT. Traumatic axonal injury in the optic nerve: evidence for axonal swelling, disconnection, dieback, and reorganization. J. Neurotrauma. 2011;28:1185–1198. doi: 10.1089/neu.2011.1756. [DOI] [PMC free article] [PubMed] [Google Scholar]
- Watson C, Harrison M. The location of the major ascending and descending spinal cord tracts in all spinal cord segments in the mouse: actual and extrapolated. Anat. Rec. 2012;295:1692–1697. doi: 10.1002/ar.22549. [DOI] [PubMed] [Google Scholar]
- Weidner N, Ner A, Salimi N, Tuszynski MH. Spontaneous corticospinal axonal plasticity and functional recovery after adult central nervous system injury. Proc. Natl. Acad. Sci. U. S. A. 2001;98:3513–3518. doi: 10.1073/pnas.051626798. [DOI] [PMC free article] [PubMed] [Google Scholar]
- Willenberg R, Steward O. YFP labeling of non-CST axons in CST-YFP mice limits the utility of these mice for studies of corticospinal tract regeneration. Neurosci. 2012 doi: 10.1002/cne.23809. Abst 722.06. [DOI] [PMC free article] [PubMed] [Google Scholar]
- Wright RM, Post A, Hoshizaki B, Ramesh KT. A multiscale computational approach to estimating axonal damage under inertial loading of the head. J. Neurotrauma. 2013;30:102–118. doi: 10.1089/neu.2012.2418. [DOI] [PubMed] [Google Scholar]
- Wu J, Zhao Z, Sabirzhanov B, Stoica BA, Kumar A, Luo T, Skovira J, Faden AI. Spinal cord injury causes brain inflammation associated with cognitive and affective changes: role of cell cycle pathways. J. Neurosci. 2014;34:10989–11006. doi: 10.1523/JNEUROSCI.5110-13.2014. [DOI] [PMC free article] [PubMed] [Google Scholar]
- Xiong Y, Mahmood A, Chopp M. Animal models of traumatic brain injury. Nat. Rev. Neurosci. 2013;14:128–142. doi: 10.1038/nrn3407. [DOI] [PMC free article] [PubMed] [Google Scholar]
- Yuan A, Rao MV, Veeranna, Nixon RA. Neurofilaments at a glance. J. Cell Sci. 2012;125:3257–3263. doi: 10.1242/jcs.104729. [DOI] [PMC free article] [PubMed] [Google Scholar]
- Yuen TJ, Browne KD, Iwata A, Smith DH. Sodium channelopathy induced by mild axonal trauma worsens outcome after a repeat injury. J. Neurosci. Res. 2009;87:3620–3625. doi: 10.1002/jnr.22161. [DOI] [PMC free article] [PubMed] [Google Scholar]
- Ziebell JM, Morganti-Kossmann MC. Involvement of pro- and anti-inflammatory cytokines and chemokines in the pathophysiology of traumatic brain injury. Neurotherapeutics. 2010;7:22–30. doi: 10.1016/j.nurt.2009.10.016. [DOI] [PMC free article] [PubMed] [Google Scholar]
- Zwimpfer TJ, Bernstein M. Spinal cord concussion. J. Neurosurg. 1990;72:894–900. doi: 10.3171/jns.1990.72.6.0894. [DOI] [PubMed] [Google Scholar]