

Abstract
Three-dimensional organization of the chromatin has important roles in transcription, replication, DNA repair, and pathologic events such as translocations. There are two fundamental ways to study higher-order chromatin organization: microscopic and molecular approaches. In this review, we briefly introduce the molecular approaches, focusing on chromosome conformation capture or “3C” technology and its derivatives, which can be used to probe chromatin folding at resolutions beyond that provided by microscopy techniques. We further discuss the different types of data generated by the 3C-based methods and how they can be used to answer distinct biological questions.
Keywords: Hi-C, Chromosome Conformation Capture, 3C, 4C, 5C, ChIA-PET, Capture Hi-C
Introduction
Chromatin organization is fundamental for biological processes that include transcriptional regulation, DNA replication and chromosome segregation. It has been long recognized that nuclear and chromatin organization is strongly associated with gene activity and chromatin state. This is illustrated by the demonstration that genes positioned near the nuclear periphery are often silenced, whereas genes in the interior of the nucleus are frequently active. Furthermore, changes in chromosome condensation and decondensation during the cell cycle were observed more than a century ago. Because it affects so many biological processes, understanding the principles of genome folding has been, and is still, an intense area of research.
These efforts have elucidated several aspects of higher-order chromosome structure and revealed their biological implications. Through microscopic imaging, we know that chromosomes are confined to chromosome territories within the nucleus (Bolzer et al., 2005; Cremer et al., 1982; Cremer et al., 2006). The gene-poor, large chromosomes tend to be located at the periphery, whereas the gene-rich, small chromosomes are preferentially located towards the interior of the nucleus. Although each chromosome occupies a distinct territory, they are not completely isolated from each other; certain chromosomes display intermingling i.e., chromosome kissing (Branco and Pombo, 2006). The preferred spatial positioning of chromosomes in different cell types is strongly associated with recurrent translocations (i.e., The Philadelphia Chromosome) in cancers that originate from the same cell type. Within each chromosome territory, chromatin is partitioned into open and closed (Atype and B-type) genomic compartments. The A-type compartments are gene rich, active, early replicating, and enriched for open-chromatin marks (i.e., H3K27ac), several transcription factors and DNase1 hypersensitivity. In contrast, the B-type compartments are gene poor, inactive, late replicating and have few for DNase1 hypersensitivity regions (Lieberman-Aiden et al., 2009; McCord et al., 2013; Seitan et al., 2013; Zhang et al., 2012). Genomic compartments are crucial for genome integrity; it has been shown that compartmentalization is drastically lost in progeria cells, which harbor a Lamin A/C mutation, leading to premature senescence (McCord et al., 2013). More recent molecular evidence has revealed that the underlying organization of genomic compartments, known as topologically associated domains (TADs) comprise 100 kb to 1 Mb clusters of locally interacting DNA regions. TADs are largely invariant across different species, cell types and physiological conditions (Dixon et al., 2012; Nora et al., 2012), and may act as functional units for transcription regulation (Giorgetti et al., 2014; Le Dily et al., 2014; Nora et al., 2013). TADs are thought to facilitate transcriptional regulation by integrating regulatory activities that occur within their boundaries (Gibcus and Dekker, 2013; Nora et al., 2013). Cell type gene expression is modulated by the orchestrated regulation of chromatin remodelers, transcription factors and histone modifications. In addition and more importantly, enhancers and other distal cis-regulatory elements dictate the activity of gene promoters through long-range interactions (over up to hundreds of kilobases). Within each TAD, genes and several cis-regulatory elements are brought together in a cell-specific manner to confer specific gene expression patterns that characterize phenotype (Sanyal et al., 2012).
The two major techniques used to observe the spatial organization of chromatin can be broadly categorized as microscopic and molecular assays. Light microscopy can provide information about the shape and the distribution of chromosomes at a resolution of 50–100 nm in single cells. Electron microscopy, though it provides unprecedented resolution, does not provide sequence specific information about the structures observed. On the other hand, molecular assays provide a relative spatial-contact relationship among genomic loci for a population of cells. Many of the molecular techniques rely on nuclear ligation (Cullen et al., 1993), including the chromosome conformation capture methods (3C) (Dekker et al., 2002). The 3C technique captures the population-averaged interaction frequency of two loci based on their spatial proximity in the three-dimensional nucleus. Chromosome conformation capture and 3C-derived techniques rely on the same basic biochemical steps to capture chromatin interactions: cross-linking of the nucleus with formaldehyde, fragmenting chromatin by restriction digestion, re-ligating the digested ends in a dilute solution to favor intra- over inter-molecular interactions, and finally detecting the chimeric ligated products by PCR or deep sequencing. The resulting sequence information reveals the interactions of distant genomic fragments in the linear genome, (Figure 1). Depending on the biological question, each approach presents advantages and disadvantages.
Figure 1.
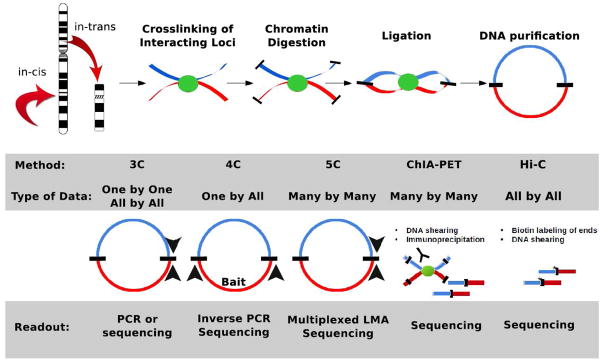
An overview of the 3C-based techniques for intra- and interchromosaomal interactions. They share a procedural front end that includes crosslinking, restriction-enzyme digestion, DNA ligation in dilute conditions, and DNA purification. Downstream, however, there are major differences in detection of these ligation products that yield significantly different types of data.
In this review, we focus on molecular techniques to study genome organization. We mainly focus on the 3C method and its derivatives (de Wit and de Laat, 2012; Dekker et al., 2013). Excellent and in-depth protocols and reviews have been recently written about the experimental details of the 3C-based methods (Belton et al., 2012; Ferraiuolo et al., 2012; Naumova et al., 2012; Splinter et al., 2012). Therefore, here we focus on the different types of data that are generated with different 3C-based assays, and more importantly, how they provide answers to different biological questions.
Chromosome Conformation Capture (3C)
Chromosome conformation capture is used to identify the interaction frequency of two selected fragments in the genome. At the end of the 3C procedure, a pool of genome-wide intra- and inter-chromosomal interactions is generated (Naumova et al., 2012). However, because the interaction frequency between any two fragments are analyzed in a pairwise manner (one by one) by PCR using specific primers for each fragment, researchers are limited to analyzing only a few loci or a genomic region within relatively small regions (10 kb to 1 Mb). Thus, 3C is considered a “hypothesis driven” technique, as a priori knowledge about the genomic locations of the elements to be tested is required.
There are a number of key considerations for devising a 3C experiment. First is the required resolution. This will be a function of the choice and number of restriction enzymes used. For instance, to study the interactions between a particular promoter and an enhancer, a single 6-base restriction enzyme, which cuts DNA approximately once every 4 kb in the genome and yields an average restriction fragment size of ~4–10 kb is appropriate. If, on the other hand, the intention is to identify a minimal regulatory region, or to conduct fine mapping of an element, then a 4-base cutter, which cleaves DNA approximately every 256 bp, might be preferred. Another consideration is the spacing of restriction sites around the genomic regions of interest, because fragments smaller than 1 kb or larger than 10kb consistently give biased results in 3C experiments. If there is a priori knowledge about a candidate regulatory region (i.e., DNase1 hypersensitivity, histone modification or transcription-factor binding), it is advised that these elements be tested in a region of unknown function.
The third consideration is the genomic distance between the elements of interest. The detection limit of 3C, in terms of genomic distance, is ~1 Mb, even though there are studies which have identified interactions that span larger distances than this, or between chromosomes (Amano et al., 2009; Harada et al., 2015; Spilianakis et al., 2005). A 6-base cutter yields around 1 million restriction fragments whereas a 4-base cutter yields 16 million fragments. Therefore, if fragments separated by very large distances are to be tested, it may be better to use a 6-base cutter to reduce the complexity of the 3C library.
Interpreting the results of a 3C experiment is also critical. The normalized interaction frequency obtained from a successful 3C experiment, with appropriately conducted controls (Dekker, 2006), provides information about the relative proximity of two (or more) fragments in the three dimensional nuclear space. Even though one can infer that the two fragments are in close proximity, these data do not necessarily infer functional relevance. Additional experiments, such as luciferase-reporter assays, should be performed to assess the functional relevance of these looping interactions. Moreover, 3C does not provide information about the localization of these fragments in the nucleus (i.e., peripheral or interior). If this is of interest for the biological question, supplementing the 3C results with DNA-FISH is advised. Furthermore, 3C cannot determine the proximity of individual haplotype chromosomes—the data do not distinguish whether the paternal or the maternal chromosome, or both, make the long-range contact.
4C
A limitation of the 3C technique is that one can only look at a portion of the picture, which is constrained by the number of restriction fragments the 3C primers have been designed to query and the genomic distance (up to ~1Mb). However, it is well established that promoters and enhancers can establish long-range interactions many megabases away with other regulatory regions. In order to circumvent this issue and probe the genome-wide interactions of a single fragment (one versus all), Simonis et al., Zhao et al. and Wurtele et al. (Simonis et al., 2006; Wurtele and Chartrand, 2006; Zhao et al., 2006) developed chromosome conformation capture on ChIP, circular chromosome conformation capture and open-ended chromosome conformation capture techniques, respectively. Although these parallel methods answer the same biological question, they differ slightly in their experimental procedures. In the 4C technique, DNA fragments that are ligated to the “bait” fragment are amplified, and the amplified pool of interacting “prey” fragments are detected by either deep sequencing or microarray analysis. More recently a modification of 4C, called enhanced 4C (e4C), has been reported (Sexton et al., 2012). Using this technique, the interactions of a bait fragment bound by a specific protein of interest can be evaluated. The advantage of 4C is that it can detect all of the intra- and inter-chromosomal interactions of a specific fragment (or an element) in high resolution. 4C has been widely used to study genes involved in development and disease (Montavon et al., 2011; Noordermeer et al., 2011; Wei et al., 2013; Zeitz et al., 2013).
A bottleneck for achieving high resolution in a 4C study is sequencing depth. When analyzing 4C data, sequences are binned at a certain genomic size (for instance ~200 kb for a 6-base restriction enzyme) (van de Werken et al., 2012). Interactions that occur over very large distances and are detected at high resolution should be interpreted carefully, since methodological artifacts can yield confounding data. Fortunately, bioinformatic methods have been developed to overcome these artifacts (van de Werken et al., 2012). In addition, the bin size can be reduced if very high depth sequencing has been performed, or if the library complexity is high. Another parameter is the cis to trans ratio of the interactions. Usually in the crosslinking step of 3C-based approaches, cis-interactions should predominate in the resulting library. A low cis to trans ratio is an indication of poor crosslinking, resulting in a high occurrence of random ligations throughout the genome.
Chromosome Conformation Capture Carbon Copy (5C)
Transcriptional regulation occurs in an orchestrated manner that typically involves several protein complexes and a congregation of cis-regulatory elements such as enhancers and insulators. In other words, a genomic region can, and many times does, participate in interactions with multiple elements. For instance, multiple enhancers can loop with a single developmental gene promoter to fine-tune its transcription. In addition, genes within a certain genomic region (for instance inside a single TAD) can be subject to similar modes of regulation. As a result, it can be important to chart the interactions between a large number of fragments in a genomic region. To address this need, Dostie et al. developed the chromosome conformation capture carbon copy (5C) technique (Dostie et al., 2006; Ferraiuolo et al., 2012). Briefly the 5C method begins with preparation of a 3C library. Then, several to several hundred 5C primers are designed to span a large genomic region of interest such that the primers will anneal precisely at the ligation junctions of the restriction fragments in the 3C library. Next, the fragments are subjected to ligation mediated amplification (LMA), to simultaneously amplify thousands of 3C junctions in a single reaction. The resulting PCR amplicons are detected by either microarray analysis or deep sequencing. The 5C method has been successfully used to study the B-globin and HOX loci, and the embryonic stem cell gene loci, Klf4, Sox2, and Nanog and 1% of the genome (Dostie et al., 2006; Phillips-Cremins et al., 2013; Rousseau et al., 2014; Sanyal et al., 2012; Williamson et al., 2014).
All of the technical considerations for 3C are also valid for 5C. Therefore, 5C cannot detect interactions between regions separated by more than a few megabases (Ferraiuolo et al., 2012). The most important consideration when generating a 5C library is primer design, which has been extensively explained (Ferraiuolo et al., 2012). Briefly, 5C primers can be designed in three different ways: alternating, anchored and mixed schemes. In the alternating scheme, the forward and reverse 5C primers are designed on consecutive restriction fragments, thereby providing an unbiased picture of the genomic region under study. This approach, although it is most informative, requires a complex library and high sequencing depth compared to the other primer schemes. The anchored primer design scheme is a more targeted approach, when a priori knowledge is available. For example, the interactions of gene promoters in a certain region with the rest of the genome can be queried by designing forward primers on the promoters and reverse primers on all other restriction fragments. Lastly, investigators can employ a mixed scheme that combines the two previous schemes. For example, to investigate a few particular fragments in a particular genomic region, design primers using an anchored scheme on the fragments of interest, and an alternating-scheme primer-design for the rest of the genomic region.
As a result, 5C can provide in-depth information about the higher-order chromatin organization of a selected genomic region. 5C data from multiple samples or physiological conditions can be compared to infer biological function. Yet, the 5C approach is not genome-wide and requires an a priori-defined region of interest.
Hi-C
For many biological questions, understanding the overall interaction frequency of the genome in certain physiological conditions or disease states is desirable. In these cases, it is impractical to investigate interaction frequencies using probe-based 3C approaches (i.e., 3C, 4C or 5C). To capture an unbiased view of genomic interactions, Lieberman-Aiden and van Berkum et al. devised the Hi-C method (Lieberman-Aiden et al., 2009). A detailed protocol and guidelines for data interpretation has been extensively explained (Belton et al., 2012; Dekker et al., 2013; Lajoie et al., 2015). Hi-C is very similar to 3C in terms of methodology, except that, after the restriction digestion, the digested ends are treated to incorporate biotin prior to the diluted ligation step. After ligation, all chromosome interactions can be captured genome-wide in an unbiased manner by recovering ligated fragments using streptavidin. The Hi-C method has been extensively used in studies that address a myriad of biological questions, related to disease (McCord et al., 2013), stem cell biology (Dixon et al., 2015), evolution (Vietri Rudan et al., 2015) and cell cycle (Naumova et al., 2013).
Because they are fundamentally similar, many of the considerations for 3C are also valid for Hi-C. In addition to being genome-wide, a major advantage of Hi-C is that interactions can be detected even over relatively large genomic-distances. Hi-C can detect in-cis interactions many megabases away, as well as trans-interactions. The Hi-C resolution achieved depends on the sequencing depth. With sufficient replicates and deep sequencing, an interaction map for the whole genome can be obtained at restriction-fragment-length resolution (Jin et al., 2013; Rao et al., 2014). The Hi-C resolution required depends on the biological question at hand. As explained for 4C, Hi-C data are binned at intervals that are based on the sequencing depth and experimental objective. For instance, to chart a global view of a cancer genome (i.e., translocations or genomic compartments), relatively low resolution data (1–10 Mb bins) will suffice. Alternatively to map the fine details of interactions between thousands of loci or sub-TADs, then very high resolution Hi-C data might be required (1 kb–40 kb bins). In libraries without high complexity or with low resolution, the data will significantly suffer from noise at resolutions lower than 40 kb since each bin will represent a much lower number of sequencing reads. The choice of restriction enzyme will also have a significant effect on the resolution (see above, (Belton et al., 2012)). A good quality Hi-C library should exhibit a high cis-/trans-interaction ratio. Recently, a method called tethered chromatin capture (TCC) has been developed to reduce the background levels in the Hi-C data (Kaikkonen et al., 2014; Kalhor et al., 2012). As Hi-C becomes a prominent method for studying genome organization, new computational tools have made analysis of Hi-C data more accessible (Heinz et al., 2010).
Interaction frequencies in Hi-C data represent the population average of several million cells. Thus, the Hi-C technique cannot distinguish whether interactions are stable and present in some cells, and non-existent in others; or are dynamically present in all cells. DNA-FISH, on the other hand, can provide information about single cells, but it cannot be used to simultaneously incorporate information about the proximity of several loci. Used as complimentary methods, Hi-C and FISH can provide comprehensive and complementary information about chromosome conformation (Williamson et al., 2014). More recently, Hi-C has also been applied to single cells (Nagano et al., 2013). These analyses reveal that larger structures in the nucleus (such as chromosome territories) are stable among different cells; however, higher resolution structures (i.e compartments) are more variable. Another modification of Hi-C is called Capture Hi-C, in which a pool of sequences of interest (i.e., promoter sequences or specific disease loci) is enriched in the library prior to sequencing. This targeted technique can provide a very high-resolution interaction map of enriched sequences (Dryden et al., 2014; Furlan-Magaril et al., 2015; Schoenfelder et al., 2015). Taken together, the Hi-C strategies for chromosome conformation analysis are promising tools to elucidate different roles of genome organization in the cell nucleus in physiologic and pathologic states.
ChIA-PET, 6C and ChIP-loop
All of the techniques explained thus far are used to study genome organization from a “DNA-centric” point of view. Because DNA organization is established and maintained by protein and RNA complexes, several methods have been devised to study genome structure from the protein perspective. One common approach is to combine chromatin immunoprecipitation with 3C. DNA is first cross-linked, the protein of interest is immunoprecipitated using an antibody, and 3C is then performed. These techniques not only reduce background, they also enrich for genomic interactions that are enriched for binding of the protein of interest. However, detecting chromosome interactions with these techniques does not necessarily mean that the interaction is mediated by the protein. Additional experiments, such as knocking down the protein of interest, are required to assess the functional relevance of the data. 6C and chip-loop can query chromosome interactions in “one by one” manner, requiring the design of fragment specific probes (Simonis et al., 2007; Tiwari et al., 2008). However, the ChIA-PET technique uses deep sequencing to assess the protein-bound interactome genome-wide (Fullwood et al., 2009). ChIA-PET has been thus far performed on the estrogen receptor, Pol2 and CTCF (CCCTC-binding factor) (Fullwood et al., 2009; Handoko et al., 2011; Li et al., 2012). Although ChIA-PET gives a genome-wide view of chromatin interactions, this view is focused on the protein of interest under investigation.
Future Considerations
All of the molecular techniques used to study genome organization have strengths and limitations. The nature of the biological question asked will help determine whether probing the interaction frequency between just a few loci, several loci, a whole chromosome, or the whole genome, will provide the information sought (Figure 2). Nevertheless, all of these techniques benefit when complemented with microscopic techniques, as none can achieve the resolution of electron microscopy, or capture the dynamic interactions in single cells as DNA-FISH can. However, they do provide information that microscopic techniques cannot. Since most of these molecular techniques are relatively new, more studies will not only improve the methodologies and the computational pipelines, but also will shed significant light on genome organization in several pathologies and during development. 3C-based methods, especially Hi-C, will undoubtedly serve as a pioneering tool to study genome organization.
Figure 2.

An example Hi-C heatmap depicting the types of data generated by 3C or 3C-based methods. 3C queries interactions on a one-by-one basis; 4C identifies interactions between a single region and the rest of the genome; 5C generates a high-resolution interaction matrix of a large genomic region; Capture Hi-C, ChIA-PET and other ChIP-based methods characterize chromatin-looping interactions over several different loci; and finally Hi-C queries genome-wide chromatin interactions at low or high resolution.
Acknowledgments
Contract Grant Sponsor: National Institutes of Health; Contract Grant Numbers: P01 CA082834 and R01 CA139322
References
- Amano T, Sagai T, Tanabe H, Mizushina Y, Nakazawa H, Shiroishi T. Chromosomal dynamics at the Shh locus: limb bud-specific differential regulation of competence and active transcription. Developmental cell. 2009;16(1):47–57. doi: 10.1016/j.devcel.2008.11.011. [DOI] [PubMed] [Google Scholar]
- Belton JM, McCord RP, Gibcus JH, Naumova N, Zhan Y, Dekker J. Hi-C: a comprehensive technique to capture the conformation of genomes. Methods. 2012;58(3):268–276. doi: 10.1016/j.ymeth.2012.05.001. [DOI] [PMC free article] [PubMed] [Google Scholar]
- Bolzer A, Kreth G, Solovei I, Koehler D, Saracoglu K, Fauth C, Muller S, Eils R, Cremer C, Speicher MR, Cremer T. Three-dimensional maps of all chromosomes in human male fibroblast nuclei and prometaphase rosettes. PLoS biology. 2005;3(5):e157. doi: 10.1371/journal.pbio.0030157. [DOI] [PMC free article] [PubMed] [Google Scholar]
- Branco MR, Pombo A. Intermingling of chromosome territories in interphase suggests role in translocations and transcription-dependent associations. PLoS biology. 2006;4(5):e138. doi: 10.1371/journal.pbio.0040138. [DOI] [PMC free article] [PubMed] [Google Scholar]
- Cremer T, Cremer C, Baumann H, Luedtke EK, Sperling K, Teuber V, Zorn C. Rabl’s model of the interphase chromosome arrangement tested in Chinese hamster cells by premature chromosome condensation and laser-UV-microbeam experiments. Human genetics. 1982;60(1):46–56. doi: 10.1007/BF00281263. [DOI] [PubMed] [Google Scholar]
- Cremer T, Cremer M, Dietzel S, Muller S, Solovei I, Fakan S. Chromosome territories--a functional nuclear landscape. Current opinion in cell biology. 2006;18(3):307–316. doi: 10.1016/j.ceb.2006.04.007. [DOI] [PubMed] [Google Scholar]
- Cullen KE, Kladde MP, Seyfred MA. Interaction between transcription regulatory regions of prolactin chromatin. Science. 1993;261(5118):203–206. doi: 10.1126/science.8327891. [DOI] [PubMed] [Google Scholar]
- de Wit E, de Laat W. A decade of 3C technologies: insights into nuclear organization. Genes & development. 2012;26(1):11–24. doi: 10.1101/gad.179804.111. [DOI] [PMC free article] [PubMed] [Google Scholar]
- Dekker J. The three ‘C’ s of chromosome conformation capture: controls, controls, controls. Nature methods. 2006;3(1):17–21. doi: 10.1038/nmeth823. [DOI] [PubMed] [Google Scholar]
- Dekker J, Marti-Renom MA, Mirny LA. Exploring the three-dimensional organization of genomes: interpreting chromatin interaction data. Nature reviews Genetics. 2013;14(6):390–403. doi: 10.1038/nrg3454. [DOI] [PMC free article] [PubMed] [Google Scholar]
- Dekker J, Rippe K, Dekker M, Kleckner N. Capturing chromosome conformation. Science. 2002;295(5558):1306–1311. doi: 10.1126/science.1067799. [DOI] [PubMed] [Google Scholar]
- Dixon JR, Jung I, Selvaraj S, Shen Y, Antosiewicz-Bourget JE, Lee AY, Ye Z, Kim A, Rajagopal N, Xie W, Diao Y, Liang J, Zhao H, Lobanenkov VV, Ecker JR, Thomson JA, Ren B. Chromatin architecture reorganization during stem cell differentiation. Nature. 2015;518(7539):331–336. doi: 10.1038/nature14222. [DOI] [PMC free article] [PubMed] [Google Scholar]
- Dixon JR, Selvaraj S, Yue F, Kim A, Li Y, Shen Y, Hu M, Liu JS, Ren B. Topological domains in mammalian genomes identified by analysis of chromatin interactions. Nature. 2012;485(7398):376–380. doi: 10.1038/nature11082. [DOI] [PMC free article] [PubMed] [Google Scholar]
- Dostie J, Richmond TA, Arnaout RA, Selzer RR, Lee WL, Honan TA, Rubio ED, Krumm A, Lamb J, Nusbaum C, Green RD, Dekker J. Chromosome Conformation Capture Carbon Copy (5C): a massively parallel solution for mapping interactions between genomic elements. Genome research. 2006;16(10):1299–1309. doi: 10.1101/gr.5571506. [DOI] [PMC free article] [PubMed] [Google Scholar]
- Dryden NH, Broome LR, Dudbridge F, Johnson N, Orr N, Schoenfelder S, Nagano T, Andrews S, Wingett S, Kozarewa I, Assiotis I, Fenwick K, Maguire SL, Campbell J, Natrajan R, Lambros M, Perrakis E, Ashworth A, Fraser P, Fletcher O. Unbiased analysis of potential targets of breast cancer susceptibility loci by Capture Hi-C. Genome research. 2014 doi: 10.1101/gr.175034.114. [DOI] [PMC free article] [PubMed] [Google Scholar]
- Ferraiuolo MA, Sanyal A, Naumova N, Dekker J, Dostie J. From cells to chromatin: capturing snapshots of genome organization with 5C technology. Methods. 2012;58(3):255–267. doi: 10.1016/j.ymeth.2012.10.011. [DOI] [PMC free article] [PubMed] [Google Scholar]
- Fullwood MJ, Liu MH, Pan YF, Liu J, Xu H, Mohamed YB, Orlov YL, Velkov S, Ho A, Mei PH, Chew EG, Huang PY, Welboren WJ, Han Y, Ooi HS, Ariyaratne PN, Vega VB, Luo Y, Tan PY, Choy PY, Wansa KD, Zhao B, Lim KS, Leow SC, Yow JS, Joseph R, Li H, Desai KV, Thomsen JS, Lee YK, Karuturi RK, Herve T, Bourque G, Stunnenberg HG, Ruan X, Cacheux-Rataboul V, Sung WK, Liu ET, Wei CL, Cheung E, Ruan Y. An oestrogen-receptor-alpha-bound human chromatin interactome. Nature. 2009;462(7269):58–64. doi: 10.1038/nature08497. [DOI] [PMC free article] [PubMed] [Google Scholar]
- Furlan-Magaril M, Varnai C, Nagano T, Fraser P. 3D genome architecture from populations to single cells. Current opinion in genetics & development. 2015;31:36–41. doi: 10.1016/j.gde.2015.04.004. [DOI] [PubMed] [Google Scholar]
- Gibcus JH, Dekker J. The hierarchy of the 3D genome. Molecular cell. 2013;49(5):773–782. doi: 10.1016/j.molcel.2013.02.011. [DOI] [PMC free article] [PubMed] [Google Scholar]
- Giorgetti L, Galupa R, Nora EP, Piolot T, Lam F, Dekker J, Tiana G, Heard E. Predictive polymer modeling reveals coupled fluctuations in chromosome conformation and transcription. Cell. 2014;157(4):950–963. doi: 10.1016/j.cell.2014.03.025. [DOI] [PMC free article] [PubMed] [Google Scholar]
- Handoko L, Xu H, Li G, Ngan CY, Chew E, Schnapp M, Lee CW, Ye C, Ping JL, Mulawadi F, Wong E, Sheng J, Zhang Y, Poh T, Chan CS, Kunarso G, Shahab A, Bourque G, Cacheux-Rataboul V, Sung WK, Ruan Y, Wei CL. CTCF-mediated functional chromatin interactome in pluripotent cells. Nature genetics. 2011;43(7):630–638. doi: 10.1038/ng.857. [DOI] [PMC free article] [PubMed] [Google Scholar]
- Harada A, Mallappa C, Okada S, Butler JT, Baker SP, Lawrence JB, Ohkawa Y, Imbalzano AN. Spatial reorganization of myogenic regulatory sequences temporally controls gene expression. Nucleic acids research. 2015;43(4):2008–2021. doi: 10.1093/nar/gkv046. [DOI] [PMC free article] [PubMed] [Google Scholar]
- Heinz S, Benner C, Spann N, Bertolino E, Lin YC, Laslo P, Cheng JX, Murre C, Singh H, Glass CK. Simple combinations of lineage-determining transcription factors prime cis-regulatory elements required for macrophage and B cell identities. Molecular cell. 2010;38(4):576–589. doi: 10.1016/j.molcel.2010.05.004. [DOI] [PMC free article] [PubMed] [Google Scholar]
- Jin F, Li Y, Dixon JR, Selvaraj S, Ye Z, Lee AY, Yen CA, Schmitt AD, Espinoza CA, Ren B. A high-resolution map of the three-dimensional chromatin interactome in human cells. Nature. 2013;503(7475):290–294. doi: 10.1038/nature12644. [DOI] [PMC free article] [PubMed] [Google Scholar]
- Kaikkonen MU, Niskanen H, Romanoski CE, Kansanen E, Kivela AM, Laitalainen J, Heinz S, Benner C, Glass CK, Yla-Herttuala S. Control of VEGF-A transcriptional programs by pausing and genomic compartmentalization. Nucleic acids research. 2014;42(20):12570–12584. doi: 10.1093/nar/gku1036. [DOI] [PMC free article] [PubMed] [Google Scholar]
- Kalhor R, Tjong H, Jayathilaka N, Alber F, Chen L. Genome architectures revealed by tethered chromosome conformation capture and population-based modeling. Nature biotechnology. 2012;30(1):90–98. doi: 10.1038/nbt.2057. [DOI] [PMC free article] [PubMed] [Google Scholar]
- Lajoie BR, Dekker J, Kaplan N. The Hitchhiker’s guide to Hi-C analysis: Practical guidelines. Methods. 2015;72:65–75. doi: 10.1016/j.ymeth.2014.10.031. [DOI] [PMC free article] [PubMed] [Google Scholar]
- Le Dily F, Bau D, Pohl A, Vicent GP, Serra F, Soronellas D, Castellano G, Wright RH, Ballare C, Filion G, Marti-Renom MA, Beato M. Distinct structural transitions of chromatin topological domains correlate with coordinated hormone-induced gene regulation. Genes & development. 2014;28(19):2151–2162. doi: 10.1101/gad.241422.114. [DOI] [PMC free article] [PubMed] [Google Scholar]
- Li G, Ruan X, Auerbach RK, Sandhu KS, Zheng M, Wang P, Poh HM, Goh Y, Lim J, Zhang J, Sim HS, Peh SQ, Mulawadi FH, Ong CT, Orlov YL, Hong S, Zhang Z, Landt S, Raha D, Euskirchen G, Wei CL, Ge W, Wang H, Davis C, Fisher-Aylor KI, Mortazavi A, Gerstein M, Gingeras T, Wold B, Sun Y, Fullwood MJ, Cheung E, Liu E, Sung WK, Snyder M, Ruan Y. Extensive promoter-centered chromatin interactions provide a topological basis for transcription regulation. Cell. 2012;148(1–2):84–98. doi: 10.1016/j.cell.2011.12.014. [DOI] [PMC free article] [PubMed] [Google Scholar]
- Lieberman-Aiden E, van Berkum NL, Williams L, Imakaev M, Ragoczy T, Telling A, Amit I, Lajoie BR, Sabo PJ, Dorschner MO, Sandstrom R, Bernstein B, Bender MA, Groudine M, Gnirke A, Stamatoyannopoulos J, Mirny LA, Lander ES, Dekker J. Comprehensive mapping of long-range interactions reveals folding principles of the human genome. Science. 2009;326(5950):289–293. doi: 10.1126/science.1181369. [DOI] [PMC free article] [PubMed] [Google Scholar]
- McCord RP, Nazario-Toole A, Zhang H, Chines PS, Zhan Y, Erdos MR, Collins FS, Dekker J, Cao K. Correlated alterations in genome organization, histone methylation, and DNA-lamin A/C interactions in Hutchinson-Gilford progeria syndrome. Genome research. 2013;23(2):260–269. doi: 10.1101/gr.138032.112. [DOI] [PMC free article] [PubMed] [Google Scholar]
- Montavon T, Soshnikova N, Mascrez B, Joye E, Thevenet L, Splinter E, de Laat W, Spitz F, Duboule D. A regulatory archipelago controls Hox genes transcription in digits. Cell. 2011;147(5):1132–1145. doi: 10.1016/j.cell.2011.10.023. [DOI] [PubMed] [Google Scholar]
- Nagano T, Lubling Y, Stevens TJ, Schoenfelder S, Yaffe E, Dean W, Laue ED, Tanay A, Fraser P. Single-cell Hi-C reveals cell-to-cell variability in chromosome structure. Nature. 2013;502(7469):59–64. doi: 10.1038/nature12593. [DOI] [PMC free article] [PubMed] [Google Scholar]
- Naumova N, Imakaev M, Fudenberg G, Zhan Y, Lajoie BR, Mirny LA, Dekker J. Organization of the mitotic chromosome. Science. 2013;342(6161):948–953. doi: 10.1126/science.1236083. [DOI] [PMC free article] [PubMed] [Google Scholar]
- Naumova N, Smith EM, Zhan Y, Dekker J. Analysis of long-range chromatin interactions using Chromosome Conformation Capture. Methods. 2012;58(3):192–203. doi: 10.1016/j.ymeth.2012.07.022. [DOI] [PMC free article] [PubMed] [Google Scholar]
- Noordermeer D, Leleu M, Splinter E, Rougemont J, De Laat W, Duboule D. The dynamic architecture of Hox gene clusters. Science. 2011;334(6053):222–225. doi: 10.1126/science.1207194. [DOI] [PubMed] [Google Scholar]
- Nora EP, Dekker J, Heard E. Segmental folding of chromosomes: a basis for structural and regulatory chromosomal neighborhoods? BioEssays: news and reviews in molecular, cellular and developmental biology. 2013;35(9):818–828. doi: 10.1002/bies.201300040. [DOI] [PMC free article] [PubMed] [Google Scholar]
- Nora EP, Lajoie BR, Schulz EG, Giorgetti L, Okamoto I, Servant N, Piolot T, van Berkum NL, Meisig J, Sedat J, Gribnau J, Barillot E, Bluthgen N, Dekker J, Heard E. Spatial partitioning of the regulatory landscape of the X-inactivation centre. Nature. 2012;485(7398):381–385. doi: 10.1038/nature11049. [DOI] [PMC free article] [PubMed] [Google Scholar]
- Phillips-Cremins JE, Sauria ME, Sanyal A, Gerasimova TI, Lajoie BR, Bell JS, Ong CT, Hookway TA, Guo C, Sun Y, Bland MJ, Wagstaff W, Dalton S, McDevitt TC, Sen R, Dekker J, Taylor J, Corces VG. Architectural protein subclasses shape 3D organization of genomes during lineage commitment. Cell. 2013;153(6):1281–1295. doi: 10.1016/j.cell.2013.04.053. [DOI] [PMC free article] [PubMed] [Google Scholar]
- Rao SS, Huntley MH, Durand NC, Stamenova EK, Bochkov ID, Robinson JT, Sanborn AL, Machol I, Omer AD, Lander ES, Aiden EL. A 3D map of the human genome at kilobase resolution reveals principles of chromatin looping. Cell. 2014;159(7):1665–1680. doi: 10.1016/j.cell.2014.11.021. [DOI] [PMC free article] [PubMed] [Google Scholar]
- Rousseau M, Ferraiuolo MA, Crutchley JL, Wang XQ, Miura H, Blanchette M, Dostie J. Classifying leukemia types with chromatin conformation data. Genome biology. 2014;15(4):R60. doi: 10.1186/gb-2014-15-4-r60. [DOI] [PMC free article] [PubMed] [Google Scholar]
- Sanyal A, Lajoie BR, Jain G, Dekker J. The long-range interaction landscape of gene promoters. Nature. 2012;489(7414):109–113. doi: 10.1038/nature11279. [DOI] [PMC free article] [PubMed] [Google Scholar]
- Schoenfelder S, Furlan-Magaril M, Mifsud B, Tavares-Cadete F, Sugar R, Javierre BM, Nagano T, Katsman Y, Sakthidevi M, Wingett SW, Dimitrova E, Dimond A, Edelman LB, Elderkin S, Tabbada K, Darbo E, Andrews S, Herman B, Higgs A, LeProust E, Osborne CS, Mitchell JA, Luscombe NM, Fraser P. The pluripotent regulatory circuitry connecting promoters to their long-range interacting elements. Genome research. 2015;25(4):582–597. doi: 10.1101/gr.185272.114. [DOI] [PMC free article] [PubMed] [Google Scholar]
- Seitan VC, Faure AJ, Zhan Y, McCord RP, Lajoie BR, Ing-Simmons E, Lenhard B, Giorgetti L, Heard E, Fisher AG, Flicek P, Dekker J, Merkenschlager M. Cohesin-based chromatin interactions enable regulated gene expression within preexisting architectural compartments. Genome research. 2013;23(12):2066–2077. doi: 10.1101/gr.161620.113. [DOI] [PMC free article] [PubMed] [Google Scholar]
- Sexton T, Kurukuti S, Mitchell JA, Umlauf D, Nagano T, Fraser P. Sensitive detection of chromatin coassociations using enhanced chromosome conformation capture on chip. Nature protocols. 2012;7(7):1335–1350. doi: 10.1038/nprot.2012.071. [DOI] [PubMed] [Google Scholar]
- Simonis M, Klous P, Splinter E, Moshkin Y, Willemsen R, de Wit E, van Steensel B, de Laat W. Nuclear organization of active and inactive chromatin domains uncovered by chromosome conformation capture-on-chip (4C) Nature genetics. 2006;38(11):1348–1354. doi: 10.1038/ng1896. [DOI] [PubMed] [Google Scholar]
- Simonis M, Kooren J, de Laat W. An evaluation of 3C-based methods to capture DNA interactions. Nature methods. 2007;4(11):895–901. doi: 10.1038/nmeth1114. [DOI] [PubMed] [Google Scholar]
- Spilianakis CG, Lalioti MD, Town T, Lee GR, Flavell RA. Interchromosomal associations between alternatively expressed loci. Nature. 2005;435(7042):637–645. doi: 10.1038/nature03574. [DOI] [PubMed] [Google Scholar]
- Splinter E, de Wit E, van de Werken HJ, Klous P, de Laat W. Determining long-range chromatin interactions for selected genomic sites using 4C-seq technology: from fixation to computation. Methods. 2012;58(3):221–230. doi: 10.1016/j.ymeth.2012.04.009. [DOI] [PubMed] [Google Scholar]
- Tiwari VK, Cope L, McGarvey KM, Ohm JE, Baylin SB. A novel 6C assay uncovers Polycomb-mediated higher order chromatin conformations. Genome research. 2008;18(7):1171–1179. doi: 10.1101/gr.073452.107. [DOI] [PMC free article] [PubMed] [Google Scholar]
- van de Werken HJ, de Vree PJ, Splinter E, Holwerda SJ, Klous P, de Wit E, de Laat W. 4C technology: protocols and data analysis. Methods in enzymology. 2012;513:89–112. doi: 10.1016/B978-0-12-391938-0.00004-5. [DOI] [PubMed] [Google Scholar]
- Vietri Rudan M, Barrington C, Henderson S, Ernst C, Odom DT, Tanay A, Hadjur S. Comparative Hi-C reveals that CTCF underlies evolution of chromosomal domain architecture. Cell reports. 2015;10(8):1297–1309. doi: 10.1016/j.celrep.2015.02.004. [DOI] [PMC free article] [PubMed] [Google Scholar]
- Wei Z, Gao F, Kim S, Yang H, Lyu J, An W, Wang K, Lu W. Klf4 organizes long-range chromosomal interactions with the oct4 locus in reprogramming and pluripotency. Cell stem cell. 2013;13(1):36–47. doi: 10.1016/j.stem.2013.05.010. [DOI] [PubMed] [Google Scholar]
- Williamson I, Berlivet S, Eskeland R, Boyle S, Illingworth RS, Paquette D, Dostie J, Bickmore WA. Spatial genome organization: contrasting views from chromosome conformation capture and fluorescence in situ hybridization. Genes & development. 2014;28(24):2778–2791. doi: 10.1101/gad.251694.114. [DOI] [PMC free article] [PubMed] [Google Scholar]
- Wurtele H, Chartrand P. Genome-wide scanning of HoxB1-associated loci in mouse ES cells using an open-ended Chromosome Conformation Capture methodology. Chromosome research: an international journal on the molecular, supramolecular and evolutionary aspects of chromosome biology. 2006;14(5):477–495. doi: 10.1007/s10577-006-1075-0. [DOI] [PubMed] [Google Scholar]
- Zeitz MJ, Ay F, Heidmann JD, Lerner PL, Noble WS, Steelman BN, Hoffman AR. Genomic interaction profiles in breast cancer reveal altered chromatin architecture. PloS one. 2013;8(9):e73974. doi: 10.1371/journal.pone.0073974. [DOI] [PMC free article] [PubMed] [Google Scholar]
- Zhang Y, McCord RP, Ho YJ, Lajoie BR, Hildebrand DG, Simon AC, Becker MS, Alt FW, Dekker J. Spatial organization of the mouse genome and its role in recurrent chromosomal translocations. Cell. 2012;148(5):908–921. doi: 10.1016/j.cell.2012.02.002. [DOI] [PMC free article] [PubMed] [Google Scholar]
- Zhao Z, Tavoosidana G, Sjolinder M, Gondor A, Mariano P, Wang S, Kanduri C, Lezcano M, Sandhu KS, Singh U, Pant V, Tiwari V, Kurukuti S, Ohlsson R. Circular chromosome conformation capture (4C) uncovers extensive networks of epigenetically regulated intra- and interchromosomal interactions. Nature genetics. 2006;38(11):1341–1347. doi: 10.1038/ng1891. [DOI] [PubMed] [Google Scholar]