Abstract
Multidimensional high throughput separations are ideal for analyzing distinct ion characteristics simultaneously in one analysis. We report on the first evaluation of a platform coupling a high speed field asymmetric ion mobility spectrometry microchip (μFAIMS) with drift tube ion mobility and mass spectrometry (IMS-MS). The μFAIMS/IMS-MS platform was used to analyze biological samples and simultaneously acquire multidimensional FAIMS compensation fields, IMS drift times, and accurate ion masses for the detected features. These separations thereby increased the overall measurement separation power, resulting in greater information content and more complete characterization of the complex samples. The separation conditions were optimized for sensitivity and resolving power by the selection of gas compositions and pressures in the FAIMS and IMS separation stages. The resulting performance provided three dimensional separations, benefitting both broad complex mixture studies and targeted analyses by improving isomeric separations and allowing detection of species obscured by interfering peaks.
Keywords: Field Asymmetric Ion Mobility Spectrometry, Ion Mobility Spectrometry, Mass Spectrometry, Isomeric Separations
Introduction
The separation of ionic species prior to mass spectrometry (MS) analysis is essential for reducing chemical noise and delivering distinct ion populations to the mass analyzer for higher quality data and more complete characterization of complex samples. The separation techniques used for this purpose include gas chromatography (GC)1, liquid chromatography (LC)2, capillary electrophoresis (CE)3, and ion mobility spectrometry (IMS)4. While each of these separation techniques provides additional information about the species being studied, the millisecond speed of IMS is of great interest for high throughput analyses since the other techniques typically require minutes to hours. Conventional drift tube ion mobility spectrometry (DTIMS)5 has been used to advance MS-based biological applications including proteomics6, metabolomics7, 8 and targeted analyses9 by rapidly separating ions in the gas phase under a weak electric field. In conventional DTIMS, the ion’s reduced mobility (K0) is constant under a certain buffer gas since it is operated at low E/N values which refer to the ratio of the electric field strength to the gas number density. The separation ensuing is then based on the ion’s collision cross section (i.e. structure) and charge.
Another IMS separation type called field asymmetric waveform ion mobility spectrometry (FAIMS)10 has emerged over the past two decades. FAIMS operates at a wide range of E/Ns and employs a periodic asymmetric electric field (known as the dispersion field: DF) in the gap between two electrodes. Ions travel the extended path as they oscillate between the two electrodes, alternately experiencing strong and weak electric fields. If the mobility of an ion is greater in one direction than in the other, the ion will be deflected and not make it through the exit slit/orifice to the MS. A compensation field (CF) is used to offset an ion’s trajectory and enable transmission through the FAIMS device. Consequently, ions are separated based on their analyte-specific differences in ion mobility under high and low electric fields. FAIMS can either transport all ions generated from the ion source by scanning the full CF range, or target a certain ion species by selecting its corresponding CF. FAIMS is appealing because it provides rapid separations at ambient pressures11. Previous publications on FAIMS have highlighted its abilities to separate charge states12, 13 and distinguish peptide and protein conformers14; recent studies have also shown its power in the separation of isobars15 and isomers16.
FAIMS devices have been interfaced with MS to reduce chemical noise and allow structural separations13, 17–21. More recently, it has also been shown that extended path length separations with planar FAIMS22, 23 devices can provide very high resolution and peak capacity separations, but at the cost of significant ion losses. A microchip-based multichannel FAIMS (μFAIMS)24 introduced by Owlstone Technology (Cambridge, UK) demonstrated higher sensitivity, analysis speed and the capability of utilizing extremely high electric fields17. However, its resolving power was much lower than in conventional planar FAIMS due to the limited residence time in the short path length μFAIMS device. Several studies25–28 have shown that the performance of the μFAIMS can be enhanced when gases comprising helium29, hydrogen30 or modifiers31 are utilized. Thus, by enhancing the μFAIMS performance, new applications can potentially be extended into complex mixture studies and targeted analyses.
Besides coupling with MS, GC has also been coupled with FAIMS (GC-FAIMS) for analyzing volatile compounds32 and LC-FAIMS-MS has proven effective for quantitative applications33, 34. An initial FAIMS/IMS-MS coupling35 reported in 2005 showed great potential for FAIMS/IMS-MS on biological analyses, but lacked in both speed and measurement sensitivity. With the technological advances in μFAIMS36, 37, this study presents the first evaluation and application of μFAIMS/IMS-MS three dimensional separations for complex mixtures and isomeric compounds, having the potential to address the key deficiencies of the previous design.
Experimental Methods
Materials and Preparation
Sulfisomidin, sulfamethazine, and reversed peptide standards (Gly-Arg-Gly-Asp-Ser and Ser-Asp-Gly-Arg-Gly) were purchased from Sigma-Aldrich. The reversed peptide standards were diluted to 2 μM using a 49.95/49.95/0.1 water/methanol/formic acid buffer solution. Sulfisomidin and sulfamethazine standards were dissolved in water and then diluted to 1 μM using 99.9/0.1 acetonitrile/formic acid solution. A tryptic digestion of bovine serum albumin (BSA) was prepared as previously described38, and diluted to 0.1 μg/μl using the 49.95/49.95/0.1 water/methanol/formic acid solution prior to injection into the instrument. Sample solutions were infused through fused silica capillary tubing at 0.2 – 0.3 μl/min and sampled using nanoESI.
Instrumentation
A μFAIMS device (Owlstone, Cambridge, UK) was interfaced to an in-house built IMS-MS platform39. The μFAIMS chip employed in this study had an open-surface area of 7.62 mm2 with a nominal 100 μm chip gap, providing 188 μs ion transit time at the resulting flow rate. Further details are available elsewhere17. The IMS platform used in the experiments had a 1-m long drift tube and was coupled to a quadrupole time-of-flight mass spectrometer with a 1.5-m flight tube39 (model 6538QTOF, Agilent Technologies, Santa Clara, CA). A schematic of the platform is shown in Figure 1a. The μFAIMS was connected to the IMS-MS via a capillary inlet (500 μm i.d.). It is worth noting that the atmospheric side of the inlet capillary, the μFAIMS device, and the nanoESI emitter were housed behind a curtain plate, and the curtain gas was introduced through a curtain plate inlet. Two different curtain gases were used: 100% N2 and a 80:20 He/N2 gas mixture. Curtain gases were precisely controlled by flow meters (MKS Instruments, MA, USA) to maintain a total flow rate of 1.8 L/min before entering the curtain plate. An additional N2 gas inlet was separately controlled and introduced into the IMS drift tube. The capillary inlet, FAIMS device and the curtain gas were maintained at 110°C.
Figure 1.
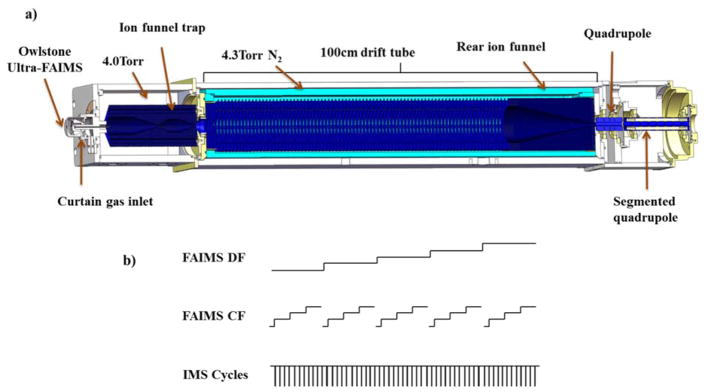
a) A schematic of the μFAIMS/IMS-MS platform. The Owlstone μFAIMS was housed in the curtain plate and coupled to an existing IMS-QTOFMS platform. b) The μFAIMS/IMS-MS platform was operated by having multiple FAIMS CF nested within each DF, and multiple IMS cycles nested within each CF.
The μFAIMS chip was connected to a field generator module, and its data acquisition software was integrated with the IMS control software to customize DF, CF and scan rate. The timing was controlled so that multiple 60 ms IMS cycles (pertaining to the time all ions enter and exit the drift tube) were nested within a certain FAIMS CF setting, and each FAIMS CF was nested within a certain DF setting as shown in Figure 1b. Maximum DF values of 250 Td was applied for 100% N2 curtain gas and 150 Td for the 80: 20 He/N2 gas mixture to avoid discharge40. Under a certain DF, the CF scan range was kept within −1 – 5 Td with scan rate of 0.1 Td/Frame, and each frame contained 50 – 100 IMS cycles. A 120 V bias was applied between the FAIMS device and IMS-MS platform; a 3000 V bias was applied between the nanoESI emitter and FAIMS device; and an 1800 V bias was applied between nanoESI emitter and curtain plate. The above voltage differences were optimized based upon the sensitivity of the FAIMS-MS analysis.
Ions separated in the FAIMS device were transmitted through the capillary inlet to an ion funnel trap (IFT). The IFT was operated in pulsed ion mode with a 4 ms ion accumulation time and its pressure was kept at 4.0 Torr while the drift tube was maintained at 4.3 Torr to prevent any curtain gas from entering the drift tube region. After exiting the drift tube, the ions were refocused by a rear ion funnel and transmitted through a short quadrupole and segmented quadrupole before entering the QTOF mass spectrometer and being detected. The signal from the QTOF detector was routed to an 8-bit Analog-to-Digital converter (ADC) (AP240, Agilent Technologies, Switzerland) and processed using a custom control-software written in C#. The software monitored the pressures, source temperature and allowed user-control of all voltages in the platform as well as ion funnel trap timing. The software also saved all experimental parameters and data collected for an m/z range of 100 – 2800 and drift time range of 0 – 58 ms in a Unified Ion Mobility Format (UIMF) file41.
Results and Discussion
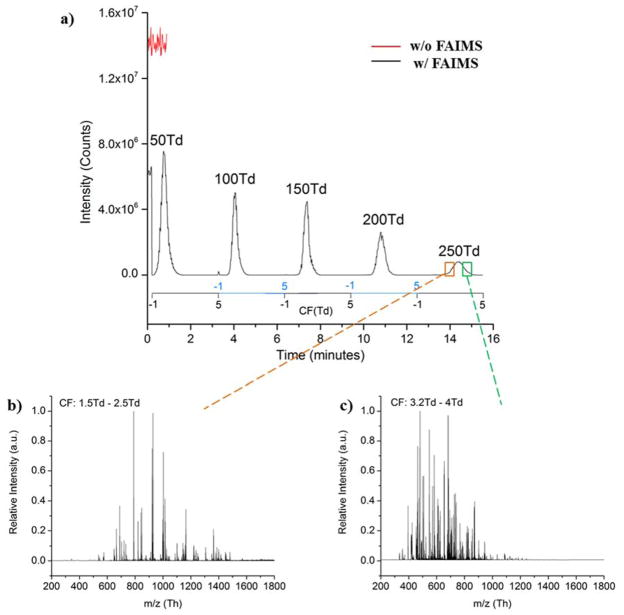
To evaluate the sensitivity change upon addition of the μFAIMS device, a bovine serum albumin tryptic digest (0.1 μg/μl) was infused into the platform at 0.3 μl/min with and without the μFAIMS device attached. The ion funnel trap was operated in a continuous mode so that all the ions separated in the μFAIMS device were transmitted directly to the MS detector without IMS separation in order to evaluate the sensitivity of the platform with and without μFAIMS. When the μFAIMS was coupled, 100% N2 was used as the curtain gas and the dispersion field was varied to study the transmission. As shown in Figure 2a, the continuous signal decreased by ~50% when the μFAIMS device was incorporated compared to the signal without the μFAIMS. This decrease was not surprising since an additional distance barrier was created between the ESI emitter and capillary inlet when the μFAIMS device was added, ultimately reducing the number of ions transmitted to the mass spectrometer. Moreover, the exit slit of μFAIMS unit also causes losses, so we expected to see a drop in sensitivity. To further investigate the sensitivity changes affiliated with DF, five different DFs (50 Td, 100 Td, 150 Td, 200 Td and 250 Td) were applied continuously while the CF was scanned from −1 Td to 5 Td within each level of DF. As DF increased, ion signals from the BSA tryptic digest progressively expended to a wider CF range especially at 250 Td, and different features were transmitted to the MS with different CF windows. However, the signal intensities greatly decreased with increasing separation power. It is worth noting that at 50 Td DF, the signal intensity was higher than the intensity obtained when FAIMS was installed but inactivated, possibly because low DFs help with ion desolvation and facilitate ion transmission from the ESI emitter to the MS detector.
Figure 2.
a) Mass spectra signal for a 0.1 μg/μl solution of BSA in μFAIMS/IMS-MS analysis with (black) and without (red) the μFAIMS attached to the IMS-MS platform. The black trace represents the BSA signal with the μFAIMS coupled and activated at DF from 50 Td to 250 Td. The MS spectra extracted for 250 Td DF with b) 1.5 Td – 2.5 Td CF range, and c) 3.2 Td – 4 Td CF range.
To further illustrate the separation capability of μFAIMS at DF of 250 Td, the mass spectra nested within different CF ranges were extracted. Figure 2b shows the extracted mass spectrum for CF from 1.5 Td to 2.5 Td, with major m/z peaks appearing between 600 – 1500. However, the mass spectrum extracted for the CFs from 3.2 Td to 4 Td (Figure 2c) displays a lower m/z range of 400 – 900. Features at different m/z ranges were selectively transmitted by FAIMS in different CF windows, confirming the separation capability of the FAIMS device at high DFs (250 Td). Moreover, features with high m/z values (>1000) are mostly singly charged based on the predicted peptide profile from BSA tryptic digest, and they were transmitted through μFAIMS at lower CFs. In contrast, low m/z (<600) features with higher charge state (doubly charged or triply charged) were detected at higher CFs, which support the capability of FAIMS in the charge state separations seen in previous studies13, 42. The compromise between sensitivity and separation capability is illustrated in Figure 2, indicating the challenge in operating FAIMS to achieve the optimal separation while minimizing sensitivity losses.
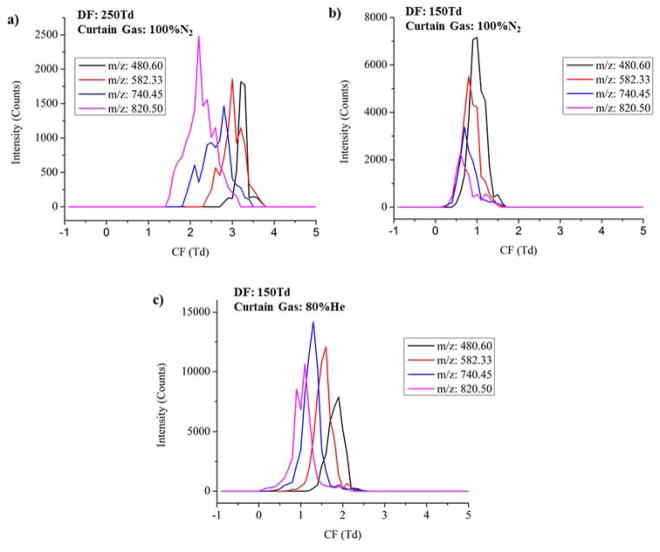
Previous studies have shown that the performance of FAIMS can be enhanced by utilizing helium gas mixtures29. Furthermore, Ibrahim et.al43 found that using helium in the ion funnel trap prior to IMS evaluation improved the IMS measurement sensitivity by allowing faster ejection of ions. Therefore, an 80:20 He/N2 curtain gas mixture was utilized to investigate the effects of helium in optimizing the balance between the resolving power and sensitivity of the μFAIM/IMS-MS analysis. When 100% N2 was used as the curtain gas, the DF was set at 150 Td, 200 Td, and 250 Td, and when He/ N2 gas mixture was introduced, the DF was set at 100 Td, 120 Td and 150 Td to prevent electrical breakdown40. At each DF setting, the CF was scanned from −1 Td to 5 Td to ensure that all detectable features in the BSA tryptic digest were transmitted. Figure 3 compares the separation capability of μFAIMS under different DFs in both 100% N2 and the 80:20 He/N2 mixture by overlaying the FAIMS CF separations of four major m/z features detected in the BSA tryptic digest. The improvement in resolving power at higher DF is evident since the targeted features in 100% N2 were separated at a DF of 250 Td while remaining indistinguishable at 150 Td (Figure 3a and 3b). For example, the CF separations of m/z=480.60 and m/z=820.50 are baseline resolved at 250 Td, however, these two peaks overlap at 150 Td. A significant decrease in sensitivity is also observed with increasing DF, matching the previous findings in Figure 2. The comparison between100% N2 and 80:20 He/N2 (Figure 3b and 3c) shows that under the same DF (150 Td), the features detected with He/N2 have 2 fold higher intensities compared to those in 100% N2. Furthermore, the addition of helium improved the FAIMS resolving power so that comparable separation was achieved at a lower DF in He/N2. The utilization of helium reduced the necessity of the high dispersion field, therefore improving sensitivity while maintaining resolving power. This observation demonstrates the combined effects of helium in enhancing performance of μFAIMS and improving the IFT efficiency, which significantly improved both the sensitivity and resolving power of the μFAIMS/IMS-MS analysis.
Figure 3.
The CF separations of four selected m/z features from the BSA digest (480.60, 582.33, 740.45, 820.50) at: a) 250 Td DF with 100% N2 as curtain gas, b) 150 Td DF with 100% N2 as curtain gas, c) 150 Td DF with He/N2 gas mixture as curtain gas. The x-axis represents the CF scan range from −1 Td to 5 Td, and y-axis represents the absolute intensity in counts.
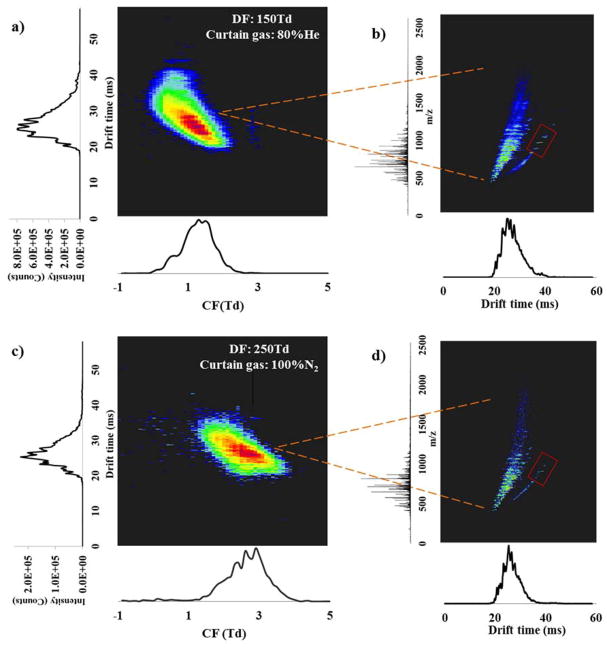
The more orthogonal the FAIMS, IMS and MS separations are, the better the multidimensional platform will perform. To understand their orthogonality, the three dimensional spectra of the BSA tryptic digest were collected under two different experimental conditions, DF of 150 Td using He/N2 as the curtain gas (Figure 4a and 4b) and DF of 250 Td using 100% N2 as curtain gas (Figure 4c and 4d). In general, features observed at higher IMS drift times were transmitted at lower CFs (Figure 4a and 4c), illustrating high orthogonality between the FAIMS and IMS dimensions due to the different separation mechanisms, i.e. IMS is based on the ions conformational size and FAIMS is associated with the differential ion mobility at very high fields. It is obvious that the orthogonality between IMS and MS is much less than the orthogonality between FAIMS and IMS since a certain degree of correlation exists between ionic size and m/z and as mass increases so does drift time (Figure 4b and 4d). Since this data shows that the μFAIMS is orthogonal to both the IMS and MS separations, coupling it to the existing IMS-MS platform is expected to improve the potential for multidimensional separations by providing higher overall peak capacities.
Figure 4.
The ultra-FAIMS/IMS-MS three dimensional separations of BSA tryptic digest at: a) DF of 150 Td with He/N2 and c) DF of 250 Td with N2 as curtain gases. The x dimension represents the FAIMS chromatogram and y dimension shows the IMS spectrum. To further illustrate the IMS-MS 2D spectra b) and d) are extracted with IMS on the x dimension and MS on the y dimension.
To understand the sensitivity difference between the 100% N2 curtain gas and the 80:20 He/N2 mixture, 90 peptides predicted for the tryptic digestion of BSA were targeted in each dataset. From the 90 peptides, 270 m/z features were generated representing the possible 1+, 2+ and 3+ charge states for each peptide. These features were then matched with the m/z features in the datasets having intensities > 3000 counts. In the He/N2 dataset, 50% more features were detected (104 features/72 peptides matched) compared with the 100% N2 (67 features/49 peptides matched). The heightened features and peptide identifications demonstrated how the enhanced sensitivity using helium improved the detection of low abundance features. Additionally, more features with higher m/z, especially those highlighted in the red box regions in b) and d), were observed with He/N2 compared to 100% N2, matching previously findings43 that the performance of ion funnel trap improved upon adding helium, especially for higher m/z features.
The analysis of isomers is also a very difficult problem, since they are indistinguishable in MS analyses. However, the orthogonality of the separation in the μFAIMS/IMS-MS platform has the potential to greatly aid in these separations, especially since both μFAIMS and IMS have the capability to distinguish isomers. To study isomeric compounds, the reversed peptides GRGDS and SDGRG were analyzed individually by FAIMS/IMS-MS at a concentration of 1 μM. The IMS drift time difference of the isomeric pair is shown in Figure 5a with [SDGRG+H]+ having an earlier drift time than [GRGDS+H]+. Although the drift time difference isn’t large enough for a baseline separation, it is still evident. However, in the FAIMS dimension (Figure 5b), the CF values of the isomers are too small to be distinguished since the resolving power of μFAIMS isn’t high due to its balance between resolving power and sensitivity. Therefore, the development of a FAIMS device with higher resolving power and good sensitivity will further enhance the μFAIMS/IMS-MS platform.
Figure 5.
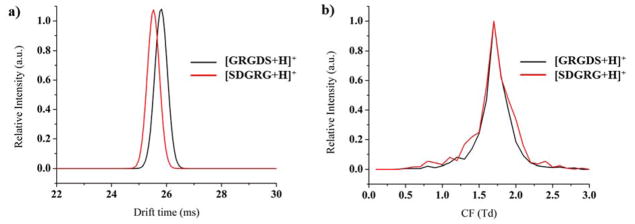
a) IMS and b) FAIMS separations of isomeric reversed peptides [GRGDS+H]+ and [SDGRG+H]+.
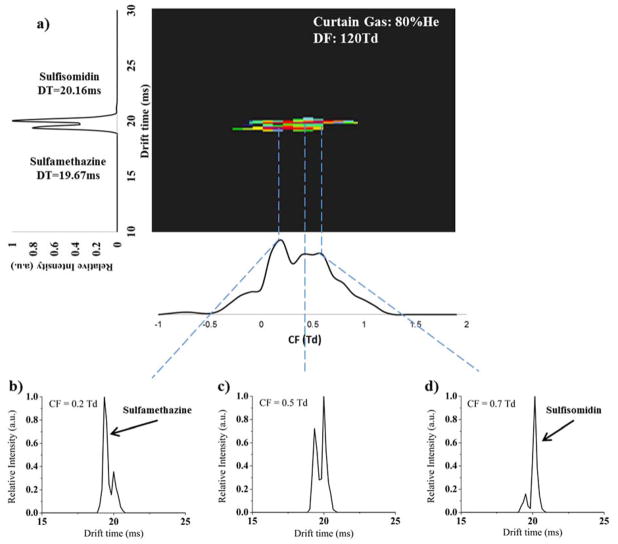
As illustrated in Figure 5, there are cases where μFAIMS/IMS-MS cannot baseline resolve isomeric compounds due to their high structural similarity. However, there are also cases where the multidimensional FAIMS/IMS analyses improve isomeric separations21, 44. In this study, drug isomers sulfamethazine and sulfisomidin were analyzed with the μFAIMS/IMS-MS platform as a mixture at 1 μM each. Figure 6 displays the FAIMS-IMS two dimensional spectrum extracted for the m/z of the compounds. In the spectra, IMS dimension separates the two isomers but not by baseline (Figure 6a). However, the addition of μFAIMS allows the isomer of interest to be isolated by selecting specific CF values (Figure 6b, 6c and 6d). At CF of 0.2 Td (Figure 6b), sulfamethazine was detected with higher abundance than sulfisomidin, while at CF of 0.7 Td, the FAIMS almost selectively transmitted sulfisomidin (Figure 6d). Although the separation of these two isomers was not baseline resolved in either the μFAIMS or IMS dimension, the combined separation power of the two dimensional FAIMS/IMS separations improved the selectivity of the isomer of interest. Since MS analysis alone can’t separate isomers, it is possible that a FAIMS-IMS platform can be utilized in the future as an identification and quantitation tool for isomeric compounds to reduce the cost and complexity of the analyses.
Figure 6.
The μFAIMS/IMS-MS analysis of sulfisomidin and sulfamethazine, where a) displays the IMS separation for all CF values. Extracted CF values of b) 0.2 Td, c) 0.5 Td and d) 0.7 Td illustrate the selectivity for each isomer when μFAIMS is utilized.
Conclusion
In summary, we evaluated a μFAIMS/IMS-MS platform using isomeric standards and complex mixtures. The sensitivity of the platform decreased with increasing FAIMS dispersion fields, but the ability to characterize mixtures increased due to the increased resolving power. The addition of helium in the curtain gas allowed the μFAIMS/IMS-MS platform to achieve higher sensitivity resulting in an increased number of detected features compared with using 100% N2. The μFAIMS/IMS-MS three dimensional separations were optimized with enhanced separation power and selectivity, therefore, improving the performance of isomeric separations and yielding more structural information for the analytes of interest compared to two-dimensional IMS-MS separations. We anticipate that understanding ion losses at the FAIMS interface will provide the basis for further improvements to the overall sensitivity of the platform. The development of the new FAIMS and IMS devices with higher speed and resolving power while maintaining sensitivity will further enhance the potential of fast multidimensional FAIMS/IMS-MS analyses.
Acknowledgments
Portions of this research were supported by grants from the National Institute of Environmental Health Sciences of the NIH (R01ES022190), National Institute of General Medical Sciences (P41 GM103493), the Laboratory Directed Research and Development Program at Pacific Northwest National Laboratory, and the U.S. Department of Energy Office of Biological and Environmental Research Genome Sciences Program under the Pan-omics program. This work was performed in the W. R. Wiley Environmental Molecular Sciences Laboratory (EMSL), a DOE national scientific user facility at the Pacific Northwest National Laboratory (PNNL). PNNL is operated by Battelle for the DOE under contract DE-AC05-76RL0 1830.
References
- 1.Mondello L, Tranchida PQ, Dugo P, Dugo G. Mass spectrometry reviews. 2008;27:101–124. doi: 10.1002/mas.20158. [DOI] [PubMed] [Google Scholar]
- 2.Theodoridis GA, Gika HG, Want EJ, Wilson ID. Analytica chimica acta. 2012;711:7–16. doi: 10.1016/j.aca.2011.09.042. [DOI] [PubMed] [Google Scholar]
- 3.Klampfl CW. Journal of Chromatography A. 2004;1044:131–144. doi: 10.1016/j.chroma.2004.04.072. [DOI] [PubMed] [Google Scholar]
- 4.Kanu AB, Dwivedi P, Tam M, Matz L, Hill HH., Jr Journal of mass spectrometry : JMS. 2008;43:1–22. doi: 10.1002/jms.1383. [DOI] [PubMed] [Google Scholar]
- 5.Eiceman GA, Karpas Z, Hill HH., Jr . Ion mobility spectrometry. CRC press; 2013. [Google Scholar]
- 6.McLean JA, Ruotolo BT, Gillig KJ, Russell DH. International journal of mass spectrometry. 2005;240:301–315. [Google Scholar]
- 7.Fenn LS, Kliman M, Mahsut A, Zhao SR, McLean JA. Analytical and bioanalytical chemistry. 2009;394:235–244. doi: 10.1007/s00216-009-2666-3. [DOI] [PMC free article] [PubMed] [Google Scholar]
- 8.Dwivedi P, Wu P, Klopsch SJ, Puzon GJ, Xun L, Hill HH. Metabolomics : Official journal of the Metabolomic Society. 2007;4:63–80. [Google Scholar]
- 9.Wu C, Siems WF, Hill HH., Jr Analytical chemistry. 2000;72:396–403. doi: 10.1021/ac9907235. [DOI] [PubMed] [Google Scholar]
- 10.Guevremont R. Journal of Chromatography A. 2004;1058:3–19. [PubMed] [Google Scholar]
- 11.Hatsis P, Kapron JT. Rapid communications in mass spectrometry : RCM. 2008;22:735–738. doi: 10.1002/rcm.3416. [DOI] [PubMed] [Google Scholar]
- 12.Brown LJ, Toutoungi DE, Devenport NA, Reynolds JC, Kaur-Atwal G, Boyle P, Creaser CS. Analytical chemistry. 2010:9827–9834. doi: 10.1021/ac102125u. [DOI] [PubMed] [Google Scholar]
- 13.Barnett DA, Ells B, Guevremont R, Purves RW. Journal of the American Society for Mass Spectrometry. 2002;13:1282–1291. doi: 10.1016/S1044-0305(02)00527-5. [DOI] [PubMed] [Google Scholar]
- 14.Papadopoulos G, Svendsen A, Boyarkin OV, Rizzo TR. Journal of the American Society for Mass Spectrometry. 2012;23:1173–1181. doi: 10.1007/s13361-012-0384-0. [DOI] [PubMed] [Google Scholar]
- 15.Shvartsburg AA, Smith RD. Anal Chem. 2010:8047–8051. doi: 10.1021/ac101992d. [DOI] [PMC free article] [PubMed] [Google Scholar]
- 16.Brown LJ, Smith RW, Toutoungi DE, Reynolds JC, Bristow AW, Ray A, Sage A, Wilson ID, Weston DJ, Boyle B, Creaser CS. Analytical chemistry. 2012;84:4095–4103. doi: 10.1021/ac300212r. [DOI] [PubMed] [Google Scholar]
- 17.Shvartsburg AA, Tang K, Smith RD, Holden M, Rush M, Thompson A, Toutoungi DE. Analytical chemistry. 2009;81:8048–8053. doi: 10.1021/ac901479e. [DOI] [PMC free article] [PubMed] [Google Scholar]
- 18.Shvartsburg AA. Analytical chemistry. 2014 doi: 10.1021/ac502389a,141023094508002. [DOI] [Google Scholar]
- 19.Smith RW, Reynolds JC, Lee SL, Creaser CS. Analytical Methods. 2013;5:3799. [Google Scholar]
- 20.Creese AJ, Smart J, Cooper HJ. Analytical chemistry. 2013;85:4836–4843. doi: 10.1021/ac400646m. [DOI] [PMC free article] [PubMed] [Google Scholar]
- 21.Bridon G, Bonneil E, Muratore-Schroeder T, Caron-Lizotte O, Thibault P. Journal of proteome research. 2012;11:927–940. doi: 10.1021/pr200722s. [DOI] [PubMed] [Google Scholar]
- 22.Shvartsburg AA, Tang K, Smith RD. Analytical chemistry. 2006;78:3706–3714. doi: 10.1021/ac052020v. [DOI] [PMC free article] [PubMed] [Google Scholar]
- 23.Mabrouki R, Kelly RT, Prior DC, Shvartsburg AA, Tang K, Smith RD. Journal of the American Society for Mass Spectrometry. 2009;20:1768–1774. doi: 10.1016/j.jasms.2009.05.019. [DOI] [PMC free article] [PubMed] [Google Scholar]
- 24.Wilks A, Hart M, Koehl A, Somerville J, Boyle B, Ruiz-Alonso D. International Journal for Ion Mobility Spectrometry. 2012;15:199–222. [Google Scholar]
- 25.Schneider BB, Nazarov EG, Covey TR. International Journal for Ion Mobility Spectrometry. 2012;15:141–150. doi: 10.1007/s12127-012-0111-3. [DOI] [PMC free article] [PubMed] [Google Scholar]
- 26.Schneider BB, Covey TR, Nazarov EG. International Journal for Ion Mobility Spectrometry. 2013;16:207–216. doi: 10.1007/s12127-013-0135-3. [DOI] [PMC free article] [PubMed] [Google Scholar]
- 27.Eiceman G, Krylov E, Krylova N, Nazarov E, Miller R. Analytical chemistry. 2004;76:4937–4944. doi: 10.1021/ac035502k. [DOI] [PubMed] [Google Scholar]
- 28.Levin DS, Miller RA, Nazarov EG, Vouros P. Analytical chemistry. 2006;78:5443–5452. doi: 10.1021/ac060003f. [DOI] [PubMed] [Google Scholar]
- 29.Shvartsburg AA, Smith RD. Analytical chemistry. 2010;82:2456–2462. doi: 10.1021/ac902852a. [DOI] [PMC free article] [PubMed] [Google Scholar]
- 30.Shvartsburg AA, Smith RD. Analytical chemistry. 2011;83:9159–9166. doi: 10.1021/ac202386w. [DOI] [PMC free article] [PubMed] [Google Scholar]
- 31.Rorrer LC, Yost RA. International journal of mass spectrometry. 2011;300:173–181. [Google Scholar]
- 32.Schumann A, Lenth C, Hasener J, Steckel V. International Journal for Ion Mobility Spectrometry. 2012;15:157–168. [Google Scholar]
- 33.Xia Y, Wu ST, Jemal M. Analytical chemistry. 2008:7137–7143. doi: 10.1021/ac8010846. [DOI] [PubMed] [Google Scholar]
- 34.Varesio E, Le Blanc JC, Hopfgartner G. Analytical and bioanalytical chemistry. 2012;402:2555–2564. doi: 10.1007/s00216-011-5444-y. [DOI] [PubMed] [Google Scholar]
- 35.Tang K, Li F, Shvartsburg AA, Strittmatter EF, Smith RD. Analytical chemistry. 2005;77:6381–6388. doi: 10.1021/ac050871x. [DOI] [PMC free article] [PubMed] [Google Scholar]
- 36.Smith RW, Toutoungi DE, Reynolds JC, Bristow AW, Ray A, Sage A, Wilson ID, Weston DJ, Boyle B, Creaser CS. Journal of chromatography A. 2013;1278:76–81. doi: 10.1016/j.chroma.2012.12.065. [DOI] [PubMed] [Google Scholar]
- 37.Shvartsburg AA, Ibrahim YM, Smith RD. Journal of the American Society for Mass Spectrometry. 2014;25:480–489. doi: 10.1007/s13361-013-0797-4. [DOI] [PMC free article] [PubMed] [Google Scholar]
- 38.Kinter M, Sherman NE. Protein sequencing and identification using tandem mass spectrometry. John Wiley & Sons; 2005. [Google Scholar]
- 39.Ibrahim YM, Baker ES, Danielson WF, Norheim RV, Prior DC, Anderson GA, Belov ME, Smith RD. International journal of mass spectrometry. 2015;377:655–662. doi: 10.1016/j.ijms.2014.07.034. [DOI] [PMC free article] [PubMed] [Google Scholar]
- 40.Shvartsburg AA, Tang K, Smith RD. Journal of the American Society for Mass Spectrometry. 2005;16:1447–1455. doi: 10.1016/j.jasms.2005.04.003. [DOI] [PubMed] [Google Scholar]
- 41.Shah AR, Davidson J, Monroe ME, Mayampurath AM, Danielson WF, Shi Y, Robinson AC, Clowers BH, Belov ME, Anderson GA, Smith RD. J Am Soc Mass Spectrom. 2010;21:1784–1788. doi: 10.1016/j.jasms.2010.06.014. [DOI] [PubMed] [Google Scholar]
- 42.Purves RW, Barnett DA, Ells B, Guevremont R. Journal of the American Society for Mass Spectrometry. 2001;12:894–901. doi: 10.1016/S1044-0305(01)00272-0. [DOI] [PubMed] [Google Scholar]
- 43.Ibrahim YM, Garimella SV, Tolmachev AV, Baker ES, Smith RD. Analytical chemistry. 2014;86:5295–5299. doi: 10.1021/ac404250z. [DOI] [PMC free article] [PubMed] [Google Scholar]
- 44.Creese AJ, Cooper HJ. Analytical chemistry. 2012;84:2597–2601. doi: 10.1021/ac203321y. [DOI] [PMC free article] [PubMed] [Google Scholar]


