

One-dimensional diffusion of myosin light chain kinase along actin filaments enables the rapid phosphorylation of smooth muscle myosin.
Abstract
Smooth muscle myosin (SMM) light chain kinase (MLCK) phosphorylates SMM, thereby activating the ATPase activity required for muscle contraction. The abundance of active MLCK, which is tightly associated with the contractile apparatus, is low relative to that of SMM. SMM phosphorylation is rapid despite the low ratio of MLCK to SMM, raising the question of how one MLCK rapidly phosphorylates many SMM molecules. We used total internal reflection fluorescence microscopy to monitor single molecules of streptavidin-coated quantum dot–labeled MLCK interacting with purified actin, actin bundles, and stress fibers of smooth muscle cells. Surprisingly, MLCK and the N-terminal 75 residues of MLCK (N75) moved on actin bundles and stress fibers of smooth muscle cell cytoskeletons by a random one-dimensional (1-D) diffusion mechanism. Although diffusion of proteins along microtubules and oligonucleotides has been observed previously, this is the first characterization to our knowledge of a protein diffusing in a sustained manner along actin. By measuring the frequency of motion, we found that MLCK motion is permitted only if acto–myosin and MLCK–myosin interactions are weak. From these data, diffusion coefficients, and other kinetic and geometric considerations relating to the contractile apparatus, we suggest that 1-D diffusion of MLCK along actin (a) ensures that diffusion is not rate limiting for phosphorylation, (b) allows MLCK to locate to areas in which myosin is not yet phosphorylated, and (c) allows MLCK to avoid getting “stuck” on myosins that have already been phosphorylated. Diffusion of MLCK along actin filaments may be an important mechanism for enhancing the rate of SMM phosphorylation in smooth muscle.
INTRODUCTION
Smooth muscle myosin (SMM) light chain kinase (MLCK; UniProt accession no. Q15746-7) is a Ca2+-calmodulin (CaM)–activated kinase (Hong et al., 2011) that is required for smooth muscle contraction (Itoh et al., 1989; He et al., 2008; Zhang et al., 2010) and regulation of tone in most of the hollow organs of the body (Kamm and Stull, 2011). It phosphorylates the regulatory light chains (RLCs) of SMM (a myosin II), causing a switch from low to high actin–activated myosin ATPase activity. Similar kinases modulate the activities of other myosin IIs in skeletal and cardiac muscles, and also in nonmuscle cells (Kamm and Stull, 2001).
The predominant form of MLCK in smooth muscle (Fig. 1 A) is a long multi-domain protein (Mabuchi et al., 2010) containing an N-terminal actin-binding domain (ABD; three DFRXXL motifs; Gallagher and Stull, 1997) within the first 75 residues, IgG and Fn domains, a kinase domain, and a C-terminal myosin-binding domain (MBD; also known as telokin domain) that interacts at the junction between the heads and the tail of myosin (Silver et al., 1997) near the phosphorylatable Ser-19 on the RLC. Interestingly, very little MLCK can be extracted from the contractile apparatus of smooth muscles under physiological conditions, presumably because of its combined interactions with actin and myosin (Weber et al., 2000). At the same time, even at a low ratio of MLCK to SMM, smooth muscles can reach maximal levels of SMM phosphorylation within seconds (Zimmermann et al., 1995). Calculations considering molecular dimensions suggest that at most eight local myosin heads could be phosphorylated by one statically bound MLCK, an insufficient number to explain phosphorylation levels in vivo (Hong et al., 2011). Presumably, more phosphorylation could proceed as contraction brings actin-tethered MLCK proximal to more myosin heads. However, any model requiring contraction to explain phosphorylation kinetics is weakened by the fact that ∼90% of all the myosin in gizzard tissue can be thiophosphorylated in the presence of ATPγS (a nucleotide that MLCK but not myosin can use as a substrate) when ATP is excluded from the buffer, a condition in which contraction does not occur (Kenney et al., 1990). This suggests that relative sliding of thick and thin filaments is not required for MLCK to access most of the myosin in muscle.
Figure 1.

MLCK and N75 structure and interactions with actin-containing structures. (A) Cartoon showing MLCK structural elements including the region corresponding to N75. Domains are labeled, and the functions are shown below. For more information, see Hong et al. (2011). (B–G) Merged images of QD-MLCK and QD-N75 (green) colocalized on TRITC-labeled actin (red). MLCK (B–D) and N75 (E–G) on MLCK-induced actin bundles (B and E), single actin filaments (C and F), and HASMC stress fibers (D and G). (B) 300 nM actin was applied and washed, and bundling was induced by adding 200 nM MLCK for 12 min (similar to Fig. S1 F). Actin bundles (brighter) and apparent single actin filaments (dimmer, long arrows) are shown. QD-MLCK (2 nM of biotinylated MLCK, 8 nM QD; Method A) was applied for 30 min, followed by a wash. Short arrows indicate QD-MLCK colocalized on actin bundles, and arrowhead indicates QD-MLCK colocalized on single actin filament. (C) 100 nM 5% biotinylated actin (red) applied to a PEG surface and washed, and then QD-MLCK was applied as in B. Most actin is not bundled. The arrow shows one QD colocalized. (D) MLCK is bound to HASMC stress fibers. (E) Same as B, except with 1 µM N75 and 0.2 nM QD. (F) Single actin filaments were bound to a poly-lysine–coated coverslip followed by 1 µM N75 and 0.2 nM QD. QD-N75 colocalizes to actin single filaments. (G) Same as D, except with N75. Bar shown is the same for all images, which are 512 pixels2 (54 µm2).
In an effort to understand how activated MLCK phosphorylates so much SMM so quickly in the 3-D environment of the muscle, in this study we used total internal reflection fluorescence (TIRF) microscopy to observe single molecules of MLCK interacting with three different actin substrates: single actin filaments, MLCK-induced actin bundles, and stress fibers in human airway smooth muscle cells (HASMCs). Surprisingly, MLCK moved along the long axis of actin bundles and stress fibers. The ABD contained within the first 75 residues of MLCK (N75; Fig. 1 A) was sufficient for motion, but it did not move on single actin filaments, suggesting that at least two actin filaments are needed for motion. MLCK moved by a random diffusion mechanism with no evidence of directed motion like a processive motor protein. The motion of MLCK on actin bundles did not require enzymatically activated MLCK, but the frequency of motion was enhanced in the combined presence of Ca+2-CaM and ATP, suggesting that cellular conditions that promote kinase activity also promote MLCK motion. This is the first characterization to our knowledge of a protein diffusing in a sustained manner along actin.
We present a model that explains the notable differences in MLCK motion frequency in actin bundles, which do not contain myosin, and in stress fibers, which do. It describes discrete molecular interactions that serve as barriers to motion and how motion is enabled by decreasing the concentration of the barriers. The data and model are consistent with the idea that the state of myosin, with respect to both phosphorylation and acto-myosin affinity, strongly controls the motion of MLCK. From our measured diffusion coefficients, along with other kinetic and geometric considerations relating to the contractile apparatus, we suggest that 1-D diffusion of MLCK along actin (a) ensures that diffusion is not rate limiting for myosin phosphorylation, (b) allows MLCK to “find” or self-locate to areas in which myosin is not yet phosphorylated, and (c) allows MLCK to avoid getting “stuck” on myosins that have already been phosphorylated. Our data suggest that diffusion of MLCK along actin filaments is physiologically relevant and may be an important mechanism for enhancing the rate of SMM phosphorylation in smooth muscle.
MATERIALS AND METHODS
Reagents
Collagen I (rat tail) and Qdot 525 (λ = 525 nm) ITK Streptavidin Conjugate kit, containing ∼5–10 streptavidin conjugates per streptavidin-coated quantum dot (QD), were from Invitrogen. D-(+)-glucose, glucose oxidase, type VII BSA, cow brain CaM, wortmannin, methylcellulose, apyrase, and ATP were from Sigma-Aldrich. Microscope coverslips (22 × 30 − 1.5) and slides (76.2 × 25.4 × 1 mm) were from Thermo Fisher Scientific. Phalloidin was from Alexis Corp. HASMC-culturing reagents and procedures were as described previously (Milton et al., 2011).
Proteins
Unless otherwise noted, experiments were with the short isoform of smooth muscle MLCK isolated from frozen chicken gizzards (Ngai et al., 1984). MLCK was biotinylated by EZ-Link sulfo-NHS-LC-LC-biotin according to the manufacturer’s recommendations (Thermo Fisher Scientific), giving two to five biotins per MLCK. The biotinylated MLCK activity was 3.8 µmol mg−1 min−1, which was comparable to MLCK without biotinylation (3.3 µmol mg−1 min−1) using purified RLC as the substrate. When noted, gizzard MLCK was instead labeled with DyLight 488 amine-reactive kit, according to the manufacturer’s recommendations (Thermo Fisher Scientific). For studies with human smooth muscle MLCK, a recombinant baculovirus transfer vector (pORB2) containing MLCK (UnitProt accession no. Q15746; MYLK_HUMAN) with an N-terminal 6× histag and biotag (see below) was prepared by Allele Biotechnology and Pharmaceuticals (details available from the manufacturer). They also generated baculovirus recombinants and amplified the recombinant baculovirus stock to >108 pfu ml−1. In house, Gibco sf21 insect cells (3 × 10⁷; Invitrogen) were seeded with 0.5 ml of high titer virus stock and grown for 3 d in T175 tissue culture flasks at 27°C. Cells extracts were incubated for 3 d in TALON resin (Takara Bio Inc.), followed by anion exchange chromatography in 20 mM Tris, pH 7.5, 50 mM NaCl, 0.1 mM EGTA, 5 mM MgCl2, and 1 mM DTT using a 1-ml Resource Q column attached to an AKTA FPLC (GE Healthcare). A gradient from 50 to 300 mM NaCl in 20 ml at 1 ml min−1 at room temperature eluted the protein. The MLCK was biotinylated using a biotin ligase kit (BirA-500; Avidity), and biotinylation was confirmed using Western blot.
The construct for N75 expression was LNDIFEAQKIEWHRRASVGSgggMDFRANLQRQVKPKTVSEEERKVHSPQQ VDFRSVLAKKGTPKTPVPEKAPPPKPATPDFRSVLGSKKKLPAENGS, with biotag (italics), kinase phosphorylation site (bold), ggg linker, and M starts the first 75 residues of rabbit smooth muscle MLCK. CVB101 cells (Avidity) containing the construct in the pGEX-2TK vector were incubated overnight at 37°C in lysogeny broth medium with 75 µg ml−1 ampicillin and 10 µg ml−1 chloramphenicol. To induce expression, the overnight starter culture was transferred to a baffled flask with MagicMedia Escherichia coli expression medium (Invitrogen) and 50 µM D-biotin (Invitrogen) and incubated for 18–24 h at 37°C. After centrifugation (14,000 g, 4°C, 10 min), pellets were resuspended in 2–3 ml g−1 PBS, pH 8.0, and frozen at −20°C for >12 h. After thawing on ice, cells were lysed with 1 mg ml−1 lysozyme (Sigma-Aldrich) for 10 min at 4°C, followed by microtip sonication on ice (10 s × 3 pulses), and centrifuged at 17,000 g at 4°C for 30 min. The supernatant was incubated for 4 h at 4°C with gentle rotation in glutathione Sepharose beads (5:1 ratio in PBS, pH 8.0; Thermo Fisher Scientific), and the bead slurry was transferred to a gravity flow column (1 × 10 cm) and washed with 10 column volumes of PBS. 20 U thrombin (GE Healthcare) was added to cleave off the GST, the column was sealed, and then it was rocked for 2 h at room temperature. A HiTrap Benzamidine FF column (1 ml; GE Healthcare) was attached to the column, and N75-containing fractions were eluted with PBS, pH 8.0, and verified by SDS-PAGE and Western blotting. Protein concentration was determined by an assay (Bio-Rad Laboratories) with a CaM standard curve. GST-N75 is glutathione-S-transferase appended to the first 75 residues of chicken smooth muscle MLCK as described previously (Hong et al., 2009). Most experiments were done with this construct, but similar results were obtained with the N75 construct, so for simplicity the peptide is indicated as N75.
Actin from chicken pectoralis muscle (Spudich and Watt, 1971) was incubated with equimolar tetramethylrhodamine isothiocyanate (TRITC)-labeled phalloidin (Alexis Corp.) overnight and stored on ice at 4°C. MLCK-induced TRITC-actin bundles or TRITC-actin–smooth muscle tropomyosin (Tm) bundles were prepared on glass coverslips as described in Fig. S1. Protein concentrations were determined using these extinction coefficients at 280 nm (1 mg ml−1): SMM = 0.56, MLCK = 1.14, and F-actin = 1.1.
Buffers
Actin buffer is 50 mM KCl, 50 mM imidazole, pH 7.4, 2 mM EGTA, 8 mM MgCl2, and 10 mM DTT. Actin-imaging buffer is actin buffer with added oxygen scavengers (0.1 mg ml−1 glucose oxidase, 0.018 mg ml−1 catalase, and 2.3 mg ml−1 glucose) and 0.5% methylcellulose. Buffer a is 150 mM KCl, 4 mM MgCl2, 2 mM EGTA, 10 mM DTT, and 25 mM imidazole, pH 7.0. If used during imaging, the buffers also contained 0.5% methylcellulose and oxygen scavengers as described above. The following buffers are the same as buffer A, with these additions: buffer B, Ca2+ at pCa4 and 100 nM CaM; buffer C, 2 mM ATP; buffer D, Ca2+CaM (CaM with Ca2+ bound at pCa 4) and ATP as described above. Buffer E is the same as buffer D, except at 300 mM KCl. Buffer F is 5 mM KCl, 2 mM MgCl2, 2 mM EGTA, 1 mM DTT, and 10 mM imidazole, pH 7.0.
Microscopy
Images of fluorescent actin were recorded using an epifluorescence microscope (TE2000; Nikon) with a 100× TIRF objective (NA 1.45; Plain Apo; Nikon) and a camera (Roper Cascade 512B; Princeton Instruments). Wide-field excitation (532 nm) was performed with an Hg-Xe lamp and a 565-nm (TRITC; Nikon) G-2E\C band-pass emission filter. Image sequences (see videos) of QD-labeled proteins were by TIRF using 488-nm excitation. The frame rate for the TIRF videos was 5 s−1 to ensure adequate contrast to perform centroid-based tracking. The merged images of the QD signal with TRITC signal were generated using ImageJ (National Institutes of Health). Videos or images were 512 pixel2 at a resolution of 106 nm pixel−1 (54 µm2).
Preparation of QD-labeled proteins
In Method A, 2 nM of biotinylated MLCK was premixed with 8 nM streptavidin QDs in buffer C before applying it to the actin bundles. The QD-MLCK was allowed to bind for 30 min, washed, and imaged in buffers indicated in the figure legends. This method was designed to minimize the probability of multiple MLCK molecules binding to one QD. In Method B, biotinylated-MLCK or another biotinylated protein was applied to the flow cell, incubated, and washed, and streptavidin QDs were added, followed by a wash to remove free QDs. N75 and GSTN75 peptides were biotinylated using EZ-link sulfo-NHS-LC-LC-biotin, and similar approaches to attaching QDs were used as described for MLCK. Method B was used exclusively in cell studies.
MLCK interactions with stress fibers of HASMC cytoskeletons
HASMCs on collagen-coated glass coverslips were allowed to differentiate to a contractile phenotype for 3–5 d (Milton et al., 2011) before cells were rinsed with actin buffer, and with 0.05% Triton X-100 in actin buffer for 5–10 min at room temperature. After rinsing, 2–3 µM TRITC-phalloidin was applied and incubated for 5 min before rinsing three times. Coverslips were assembled on a microscope slide to make a flow chamber, and actin buffer was used to keep the cells wet. Cells were incubated with 10–50 nM of biotinylated MLCK for 15 min at 25°C and washed, and 0.2 nM QDs was incubated for 1 min before a final wash with buffers D or E for imaging.
Effect of ATP on QD-MLCK diffusion on cell stress fibers at high ionic strength
After cell stress fibers were labeled with TRITC-phalloidin, 2 U apyrase in pH 6.8 actin buffer was applied for 20 min at 25°C and washed. Stress fibers were treated with 4 µM wortmannin (if required) for 30 min at 25°C and washed. Biotinylated MLCK, treated with 100 nM wortmannin, was applied to the wortmannin-treated cell stress fibers and incubated for 15 min at 25°C and washed, and then 0.5 nM QDs was loaded for 1 min, followed by a wash. Buffer E with or without 2 mM ATP was applied to the coverslip. For experiments with N75, the procedure was the same as for MLCK, except the peptide was not pretreated with wortmannin, and 1 µM peptide was applied to the coverslip and incubated for 30 min.
Particle tracking
Videos were analyzed using our custom centroid-based tracking algorithm. The threshold level was determined for each video to represent particles of interest without including excess background or joining adjacent fluorescent regions. The centroid for each region >5 pixels (∼0.5 µm) was calculated (Thompson et al., 2002). Trajectories were created by linking centroid positions through a simple displacement minimization algorithm, and those with durations <20 frames (0.2-s frame−1) were excluded from mean squared displacement (MSD) analysis. To exclude either fixed particles or those diffusing above the surface, trajectories with an aspect ratio <3:1 (X/Y) were not further analyzed. Finally, trajectories were manually reviewed to remove any remaining tracking artifacts to give the final curated dataset for MSD analysis. MSD versus time window-width plots for each trajectory were fit to Eq. 1, where d = 1 (1-D diffusion), t = time step or window width, and α is a variable relating to deviation from 1-D random diffusion.
| (1) |
If α < 1, motion is caged, if α > 1, motion is super diffusive, and if α = 2, motion is directed as in a processive motor protein.
Determination of frequency of QD motion
The total number of QDs that colocalized to actin were counted by eye for each video (QD and actin channels merged) and tabulated using the multipoint selection tool in ImageJ. QDs were not counted if they were (a) not obviously colocalized to actin, (b) too closely spaced to accurately count, (c) in a region that was blurry, (d) clearly diffusing above the surface, or (e) aggregated. Typically, <10% of the countable QDs in cells and <30% in bundles were considered ineligible. QDs were counted as moving if they clearly moved along actin lengthwise at any time during the video. The moving QD/total colocalized QD in percentages was calculated for each video. The average video length was 60 ± 11 s (SD) or 300 frames, and a full dataset was on average 1,270 ± 670 s (SD) of total video time. Results did not significantly change if data were weighted for total video time.
Online supplemental material
The supplemental text and Fig. S1 characterize the bundling activity of MLCK and lack thereof of N75, and provide an estimate of the number of actin filaments in bundles. Videos 1 and 2 show the dynamics of the actin-bundling process induced by MLCK. Video 3 shows an example of bidirectional motion of myosin filaments on MLCK-induced actin filament bundles, suggesting that actin bundles contain actin filaments of opposite polarity. Videos 4–6 show QD-MLCK, DyLight-labeled-MLCK, and human biotag-MLCK molecules moving on actin bundles, respectively. Videos 9 and 10 are two examples of QD-MLCK moving on HASMC stress fibers under different conditions. Video 7 shows QD-N75 motion on actin bundles, and Video 8 shows that QD-N75 does not move on single actin filaments. Videos 9 and 10 are two examples of QD-MLCK moving on HASMC stress fibers under different conditions. The online supplemental material is available at http://www.jgp.org/cgi/content/full/jgp.201511483/DC1.
RESULTS
Interactions of single molecules of MLCK or the first 75 amino acids of MLCK (N75) with actin-containing structures
We imaged QD-MLCK or QD-N75 using TIRF microscopy and TRITC-phalloidin–labeled actin using wide-field fluorescence microscopy, and merged the two images to assess their colocalization. Fig. 1 (B–G) shows representative merged images of QD-MLCK and QD-N75 interacting with the three types of actin-containing structures. Previous work (Hayakawa et al., 1994) has shown that MLCK induces actin bundling in solution. Fig. 1 B shows that QD-MLCK (green) binds to MLCK-induced actin bundles (red) that were preformed on the surface by adding unlabeled MLCK to actin (see Fig. S1 and Videos 1–3 for details about bundling and bundles). QD-MLCK colocalized on actin bundles (Fig. 1 B, short arrows), but it was unusual to find it colocalized (see arrowhead) with single filaments (long arrows). To visualize QD-MLCK bound to unbundled actin, we immobilized biotinylated single actin filaments on a streptavidin surface (Fig. 1 C; Haldeman et al., 2014) so that most of the free actin could be washed away, thus largely preventing bundling. It was rare to find QD-MLCK bound to the unbundled actin using the same concentrations of MLCK as for Fig. 1 B, and only one such QD-MLCK was found in this representative example (Fig. 1 C, arrow). If more MLCK was added to promote binding to actin, bundling again predominated and most of the MLCK was found attached to bundles (unpublished data). The mechanistic reason for the apparent preference of MLCK for bundles versus single actin filaments could have to do with slower effective detachment rates of MLCK, but no firm conclusions can be drawn from these data. Therefore, it appears likely that MLCK can bind to single actin filaments (also see data below for N75); it was just difficult to find conditions in which enough MLCK could be added to observe significant binding without also causing bundling.
To observe actin–MLCK interactions in cells, we treated cultured HASMCs with Triton X-100 to expose the cytoskeleton, and actin was labeled with TRITC-phalloidin. Cells were not fixed. Fig. 1 D shows that much of the QD-MLCK clearly colocalizes to actin-containing stress fibers. The remaining QD-MLCK could be interacting with actin structures out of the TIRF plane, with other target molecules, or nonspecifically with the surface. Direct interaction of the QD with actin was not the reason for the colocalization because QD-BSA did not bind under similar conditions (unpublished data). Because QD-MLCK was imaged using TIRF, it is interacting with ventral stress fibers that are within 100–200 nm of the coverslip surface.
Fig. 1 (E–G) shows the corresponding data for QD-N75. Like MLCK, QD-N75 binds to MLCK-induced bundles, but a higher concentration of QD-N75 (1 µM) was required to see appreciable colocalization (Fig. 1 E). Because N75 does not itself induce bundling (Fig. S1), we were able to add this higher concentration of QD-N75 (1 µM) to single actin filaments (Fig. 1 F) than was possible for QD-MLCK (2 nM; Fig. 1 C). As expected from prior studies of N75–actin interactions by centrifugation (see Hong et al., 2011, and references within), QD-N75 bound to single actin filaments. It also colocalized along cell stress fibers in a similar manner to QD-MLCK (Fig. 1 G; Method B).
QD-MLCK moves lengthwise along MLCK-induced actin bundles
QD-MLCK molecules that colocalized with actin bundles often moved along the long axis of the bundles. Fig. 2 A shows a montage of a QD-MLCK (green) moving along an actin bundle (red), the corresponding kymograph, and X–Y trajectory at nanometer resolution. The moving MLCK molecules are easy to see by inspection (Video 4). To ensure that motion was a property of MLCK, not an artifact relating to the QD, the biotinylation, and/or the type of construct, we showed that DyLight 488–labeled MLCK (Video 5), and an expressed human smooth muscle MLCK containing a single biotin on a biotag sequence at the N terminus (rather than multiple biotins on the tissue-purified chicken MLCK), moved in a similar manner (Video 6). The study was completed with QD-labeled MLCK because the DyLight probe photo-bleached too rapidly to collect a full dataset. Collectively, these data strongly suggest that MLCK itself has the ability to move along actin bundles.
Figure 2.

Examples of motion of single QD-MLCK and QD-N75 molecules on actin. (A) Montage of QD-MLCK (green) moving on an MLCK-induced actin bundle (red) showing the position of QD at 0.4-s intervals up to 7.4 s. Each image is 53 × 29 pixels or 5.6 × 3.1 µm. Below in greyscale is a kymograph showing position (vertical axis) with time (horizontal axis) generated by selecting a line following the actin filament, starting at the right, to match the X–Y trajectory shown below of the same QD. Blurry periods may be caused by the QD approaching the edge of the TIRF field. (B) Montage of QD-N75 (green) moving on a HASMC stress fiber (red) showing the position of QD at 0.2-s intervals up to 9.8 s. Each image is 20 × 26 pixels or 2.1 × 2.8 µm. Montages were prepared with ImageJ, and X–Y trajectories were prepared with the SpotTracker 2-D plugin for ImageJ.
The first 75 residues of MLCK were sufficient for motion on actin bundles but not on single actin filaments
QD-N75 also moved lengthwise along MLCK-induced actin bundles (Video 7). In contrast, no motion was observed among 1190 QD-N75 (nine videos totaling 472 s) colocalized with single actin filaments in buffers A, B, or D (see Video 8 as example). Therefore, we conclude that N75 moves on MLCK-induced actin bundles but not on single actin filaments, suggesting that at least two proximal actin filaments are required for motion.
MLCK and N75 both moved on HASMC stress fibers
QD-MLCK and QD-N75 also moved lengthwise on HASMC stress fibers. The montage in Fig. 2 B shows a typical example of QD-N75 moving along a stress fiber. The trajectory below shows that it ranged along the fiber for a total of ∼1.2 µm for 9.8 s before it detached from the fiber. A typical example of MLCK motion is shown in Video 9.
Factors that modify motion of MLCK and N75 on MLCK-induced actin bundles
Effect of Ca2+CaM, ATP, and Tm.
Ca2+CaM activates MLCK to phosphorylate the RLC of SMM using ATP as a substrate. Without Ca2+CaM, MLCK is inactive. To determine whether MLCK activity was required for motion on actin bundles or if motion was affected by Ca2+CaM and ATP, we analyzed the frequency of motion defined as the percentage of all the actin-colocalized QD-MLCK and QD-N75 that moved at any time during a video. Fig. 3 A shows that MLCK moves on actin in a physiological ionic strength buffer (150 mM KCl) in its enzymatically inactive form in the absence of Ca2+CaM and ATP. Adding Ca2+CaM or ATP alone had little effect on frequency, but when added together, the frequency increased significantly. The presence of the actin-binding protein Tm, which is abundant in the contractile apparatus of smooth muscle (Perry, 2001), further increased the frequency of motion. These results suggest that MLCK activation and the presence of Tm both enhanced movement. It is known that increasing ionic strength weakens the binding of the MLCK to actin (Dabrowska et al., 1982; Sellers and Pato, 1984). Fig. 3 A shows that increasing ionic strength by including 300 mM KCl had no significant effect, and the effects of adding Ca2+CaM, ATP, and Tm were similar. However, the movement of QD-MLCK was ionic-strength dependent because no motion was observed at 50 mM KCl regardless of buffer additions (unpublished data).
Figure 3.

Analysis of movement of MLCK and N75 on MLCK-induced actin bundles. MLCK (shaded bars) and N75 (open bars). All data are for actin bundles, except for those indicated as for actin-Tm bundles. (A and B) Conditions are summarized at the bottom. The 150-mM KCl corresponding to buffers A–D and the 300-mM KCl is the same except with added salt. (A) QDs localized on actin were counted, and those that clearly moved were plotted as a percentage of total. Error bars represent SEM. Each bar for MLCK motion is an analysis of the behaviors of at least 500 QDs (average number counted was 1,212) that met the criteria described in Determination of frequency of QD motion in Materials and methods. Data for the first three bars in the 150-mM KCl group and the sole N75 bar were not significantly different from one another (P > 0.05; two-tailed t test). This was also true for the first two bars in the 300-mM KCl group. All other comparisons within each ionic strength group were significantly different (P < 0.05). (B) Average D. Error bars represent SEM.
We determined the diffusion coefficient (D), which is a measure of the mean size and frequency of steps of diffusing particles, from trajectories of QD-MLCK moving on actin bundles using MSD analysis (Eq. 1; Fig. 3 B). The average durations of moving events ranged between ∼5.6 and 16 s, with no statistically significant differences between the tested conditions (P < 0.005). The durations of these trajectories are much too long to be transient binding interactions. For all conditions, D values fell within a tight range of 0.03–0.09 µm2s−1. At 150 mM KCl, Ca2+CaM alone significantly increased D (P < 0.01), but the change was less than a factor of 2. ATP alone had no effect, nor did ATP and Ca2+CaM together. However, with both Ca2+CaM and ATP, MLCK moved with a significantly higher D (P < 0.01) if the bundles included Tm at both 150 and 300 mM KCl. D was significantly higher (P < 0.01) at 300 mM versus 150 mM KCl without and with ATP, but with both ATP and Ca2+CaM, the increase was abolished. These data may suggest that more than one mechanism underlies the data and, although significant differences were observed, they were small. The fit to Eq. 1 also gives α values, the averages of which ranged from 0.51 to 1.04, with no statistically significant differences between conditions (P < 0.05). Because α values were <<2, there is no evidence for directed motion, as would be seen for a processive motor protein. In contrast, the data were consistent with random 1-D diffusion (α = 1) and random diffusion with spatial caging (α < 1).
Effect of ratio of MLCK to QD
There was no statistical difference in D when comparing Methods A and B that we used to prepare QD-MLCK (buffer D; P < 0.01). Similar results were obtained if QDs were added to the bundles after adding biotinylated MLCK (Method B, likely giving a MLCK > QD concentration), or QDs and MLCK were premixed before adding to the bundles (Method A; 4:1 QD/MLCK). This suggests that parameters of the motion did not depend significantly on the ratio of MLCK to QD concentrations and therefore the number of MLCKs attached to a QD.
Factors that modify the motion of MLCK and N75 on HASMC stress fibers
Effects of ATP and Ca2+CaM at physiological ionic strength.
Stress fibers are contractile assemblies in cultured cells that are composed primarily of actin and myosin. Therefore, by examining MLCK motion on stress fibers, we were able to explore the idea that the state of myosin, specifically its affinity for actin and its phosphorylation state, could affect the motion of MLCK and N75. MLCK is a long molecule that, when extended, is likely to be long enough to simultaneously bind both actin and myosin (Mabuchi et al., 2010), and importantly, the MBD binds tightly to unphosphorylated but weakly to phosphorylated SMM (Sellers and Pato, 1984; Hong et al., 2011, 2013). Because N75 lacks the MBD, comparison of MLCK with N75 will reveal the extent to which MBD–myosin interactions of MLCK control its motion. Finally, because MLCK-induced bundles do not contain myosin, they can be used as a reference structure to see if the effects of buffer conditions thought to affect the above interactions are unique to the presence of myosin.
To verify myosin phosphorylation in the HASMCs under the conditions used for TIRF imaging experiments, we immuno-stained cells with an antibody to the phosphorylated RLC of SMM and labeled actin with TRITC-phalloidin (Fig. 4). We have shown previously that stress fibers stain fairly uniformly along their length with a polyclonal antibody to SMM (Milton et al., 2011), giving images that look very similar to the phalloidin staining. In the absence of ATP and Ca2+CaM, the myosin in these cells was apparently completely dephosphorylated by endogenous phosphatases (Fig. 4, A and B). In the presence of ATP and Ca2+CaM, myosin becomes phosphorylated (Fig. 4, C and D), and the phosphorylation is inhibited by the selective MLCK inhibitor wortmannin (Fig. 4, E and F).
Figure 4.

Immunostaining of permeabilized HASMC with anti–phosphorylated RLC (pRLC) antibody. Permeabilized cells were treated with TRITC-phalloidin to label actin in stress fibers and with an anti-pRLC primary antibody, and then an Alexa Fluor 488 secondary antibody (Milton et al., 2011). (A, C, and E) TRITC-actin. (B, D, and F) Alexa Fluor 488. A and B, buffer control; C and D, treated with phosphorylation buffer (150 mM KCl, 2 mM ATP, 100 nM CaM, pCa 4, and 50 nM MLCK); E and F, treated with phosphorylation buffer in the presence of wortmannin to inhibit MLCK activity. Phosphorylation was for 5 min at 25°C. Slides were observed in imaging actin buffer.
Fig. 5 A shows the frequency of motion of QD-MLCK (gray bars) and QD-N75 (open bars) at 150 mM KCl and 300 mM KCl (see conditions summarized at the bottom). In the absence of added ATP or Ca2+CaM (buffer A), the myosin in the stress fibers was dephosphorylated (Fig. 4 B) and in a rigor state (no ATP) in which actin and myosin bind strongly. Of all conditions tested, this should promote the highest possible fraction of actin that has bound myosin heads. Very little of the MLCK moved (1.5 ± 0.33%; mean ± SEM), whereas a significantly larger (P < 0.001) fraction of N75 moved (18.3 ± 1.6%).
Figure 5.

Analysis of movement of MLCK and N75 on HASMC stress fibers. MLCK (shaded bars) and N75 (open bars). (A and B) Experimental conditions are summarized at the bottom. Buffers are as in Fig. 3. (A) QDs localized on stress fibers were counted, and the percentage of those that clearly moved are plotted. Error bars represent SEM. Within each ionic strength and molecule group, only the comparison between rigor and +ATP for N75 and for MLCK at 150 mM salt was not statistically different (P < 0.05; two-tailed t test). (B) Average D. Error bars represent SEM. For bars labeled “zero,” very few QD-MLCKs moved (see A), and D could not be determined reliably.
In the presence of ATP, myosin remains unphosphorylated (very low [Ca2+]) but now binds weakly to actin in the M · ATP and M · ADP · Pi states leading to fewer cross-bridges. The rate of ATP hydrolysis for dephosphorylated myosin is slow and the heads adopt a conformation in which they interact with each other and with the myosin filament backbone (Wendt et al., 1999, 2001; Liu et al., 2003; Woodhead et al., 2005; Burgess et al., 2007; Jung et al., 2011; Pinto et al., 2012). Alternatively, ATP can cause some of the myosin to leave the myosin filaments, where myosin adopts a soluble monomeric form called 10S (Onishi and Wakabayashi, 1982; Trybus and Lowey, 1984) that binds very weakly to actin (Olney et al., 1996). This process has been demonstrated in this cell system (Milton et al., 2011). By both mechanisms, including ATP decreases the number of strongly bound cross-bridges. Upon the addition of ATP, the frequency of N75 increased marginally relative to rigor by 1.3-fold to 24.3 ± 3.0% (Fig. 5 A), but it was not a significant increase (P = 0.06). In contrast, MLCK rarely moved (0.6 ± 0.2%) in the presence of ATP, as was found in its absence.
In the presence of ATP and Ca2+CaM, myosin in the stress fibers was phosphorylated by the activated endogenous and exogenous MLCK (Fig. 4 D). Upon the addition of ATP and Ca2+CaM, the frequency of motion of MLCK increased by a factor of 17.8 from 0.6 ± 0.2% (ATP alone) to 10.7 ± 0.9% (ATP and Ca2+CaM; see Video 9 as example). This was a much larger increase than that seen for N75, which increased by factor of 1.8 from 24.3 ± 3.0% to 44.3 ± 5.5% (Fig. 5 A).
Effect of ATP on MLCK and N75 motion at higher ionic strength.
One limitation of the experiments described from Fig. 5 A is that even under conditions that promote myosin phosphorylation (ATP + Ca2+CaM), myosin phosphorylation may be locally incomplete or, adding Ca2+CaM to the cell cytoskeletons may alter other processes that are unrelated to myosin phosphorylation. To determine if weaker MBD–myosin interactions underlie the effect of ATP + Ca2+CaM, we tried another way to weaken this interaction avoiding phosphorylation altogether. MBD–myosin interactions are known to be significantly weakened at higher ionic strengths as are ABD interactions (Sellers and Pato, 1984; Silver et al., 1997; Hong et al., 2011), but the data for the bundles (Fig. 3 A) suggest that the latter was not sufficient to alter the frequency of motion for the conditions tested. In contrast, the strong binding affinity of SMM for actin (unlike the skeletal muscle isoforms), both in the absence and presence of ATP, is relatively insensitive to increasing ionic strength (Greene et al., 1983). Using our buffers, we measured the Kd for the acto-myosin (S1 head) interaction to be 15 nM at 150 mM KCl and 25 nM at 300 mM KCl using the method of Cremo and Geeves (1998). The corresponding Kds in the presence of ATP are extremely weak but have been estimated to be >600 µM (Greene et al., 1983).
At 300 mM KCl in the absence of ATP, MLCK motion remained inhibited at 1.0 ± 0.2% (Fig. 5 A). This suggests that the weakened MBD interactions of MLCK with myosin were not sufficient to allow for significant motion. However, upon the addition of ATP, the frequency of motion for MLCK increased 24.4-fold to 24.4 ± 1.4% (see Video 10 as example). Without ATP, the frequency of motion for N75 was similar at the two ionic strengths (18.3 ± 1.6% at 150 mM KCl vs. 15.6 ± 2.2% at 300 mM KCl; Fig. 5 A). However, as with MLCK, the effect of ATP was pronounced at 300 mM KCl, increasing the moving frequency 3.9-fold from 15.6 ± 2.2% to 60.9 ± 2.4%.
D values for MLCK were similar to those seen in the actin bundles (Fig. 3 B) in a tight range between 0.025 and 0.08 µm2s−1. When most QD-MLCK did not move, D could not be determined because of an insufficient number of trajectories and is therefore shown as zero. For N75, which can be compared for all conditions, faster diffusion was observed when the myosin heads were phosphorylated and at 300 mM KCl, both in the absence and presence of ATP. Also, N75 moved faster than MLCK in the presence of ATP and Ca2+CaM and also at 300 mM KCl with ATP. The average values of α were very similar to those for actin bundles ranging from 0.62 to 0.76, with no statistically significant differences between conditions (P < 0.005). Because α values were <<2, there is no evidence for directed motion, as would be seen for a processive motor protein. In contrast, the data were consistent with random diffusion with spatial caging (α < 1).
DISCUSSION
We have observed that MLCK and N75 randomly diffuse in 1-D on actin bundles in vitro and on stress fibers in situ. We found no evidence for directed motion like a processive motor molecule. Random 1-D diffusion of proteins along microtubules (Hunter et al., 2003) and oligonucleotides (Halford and Marko, 2004; Yu et al., 2013) has been observed previously, but this is the first characterization to our knowledge of a protein diffusing in a sustained manner along actin.
It was experimentally difficult to determine whether MLCK moved on single actin filaments because of its actin-bundling activity. However, N75 (which does not bundle actin) did not move on single actin filaments but did move on MLCK-induced actin bundles and on HASMC stress fibers. Therefore, the first 75 residues of MLCK were sufficient for motion and more than one proximal actin filament appeared to be necessary for motion.
Diffusion of MLCK on actin may be an important mechanism for enhancing rates of SMM phosphorylation in smooth muscle. The ratio of active MLCK to SMM in smooth muscle is relatively low (Injeti et al., 2008), and thus one MLCK must phosphorylate many SMMs within 1–2 s to account for phosphorylation rates (see references in Hong et al., 2013). The time, t, it takes a single MLCK molecule to diffuse a distance, d, can be estimated by the first-passage time for 1-D diffusion, t = d2/2D (Berg, 1993; Howard, 2001). Assuming that SMM filaments are side polar and have two molecules (four heads) per 14.3-nm repeat on one side of the filament (Tonino et al., 2002), using D = 0.05 µm2s−1 (Fig. 5 B), it would take an average of 2 ms for MLCK to diffuse one repeat, and ∼1 s to visit 84 heads, giving 84 heads s−1 MLCK−1. Previously we showed, by observing single molecules in vitro, that the MLCK-myosin detachment rate is likely to be rate limiting for phosphorylation at 1.2 heads s−1 MLCK−1 (Hong et al., 2013), a value that is in reasonable agreement with the measured ratios of MLCK to myosin and typical phosphorylation rates in muscle. Therefore, diffusion time will be much shorter than phosphorylation time, ensuring that diffusion is not rate limiting for phosphorylation. Also, during 1-D (unlike 3-D) diffusion, the MBD of actin-bound MLCK will maintain an orientation for productive collisions with myosin. Finally, simply the fact that MLCK remains bound to the contractile apparatus keeps the MLCK localized where it effectively controls contractile rates, rather than in other cytoplasmic regions that likely only contain myosin in its ATPase-inhibited monomeric form (Milton et al., 2011), should it exist in significant quantities in muscle (Horowitz et al., 1994).
Using permeabilized HASMCs allowed us to examine factors that affected diffusion of MLCK and N75 in the presence of MLCK’s substrate, myosin. Interestingly, these data reveal an additional feature of MLCK diffusion that is likely important to enhance rates of phosphorylation in smooth muscle. Diffusion of MLCK on actin will increase the probability that it can access unphosphorylated myosin, while avoiding getting “stuck” on myosins that have already been phosphorylated. This idea is best explained by summarizing all our data pertaining to the frequencies of motion of both MLCK and N75 on both actin bundles (Fig. 3 A) and on stress fibers (Fig. 5 A) in the context of a model (Fig. 6). If the concentration of physical barriers to motion is higher than a cutoff value, D will be zero, and essentially no motion will be observed. Below this cutoff value, the frequency of motion will vary depending on the linear density of barriers along actin filaments. This is essentially a percolation model of diffusion (Saxton, 1990, 1993), where the barriers are: (a) myosin strongly bound to actin, (b) simultaneous binding of MLCK to both myosin and actin, (c) MBD tight interaction with unphosphorylated but not phosphorylated myosin, and (d) MBD interaction that is weakened at higher ionic strength. In MLCK-induced actin bundles (Fig. 6, A and E), which contain no myosin, the barrier to both MLCK (orange, green, and blue domains) and N75 (orange) motion is most likely MLCK itself (greyed out molecules are not QD labeled), which was added during the bundling procedure. The presence of two actin-binding regions, residues 2–114 and 138–213 (Fig. 6, green domain), are necessary and sufficient for bundling activity of MLCK (Hayakawa et al., 1994; Ye et al., 1997). The MLCK-induced actin bundles used here probably do not represent a physiological structure found in cells or muscle because the ratio of MLCK to actin is quite high during their formation. However, that does not mean that individual MLCK molecules do not have actin-bundling activity in cultured cells or intact muscle. We do not know how far apart the single actin filaments are in the bundles, but at this wavelength, two actin filaments would have to be ≥4 pixels or ∼400 nm apart for us to discern them as two proximal single filaments. Additional work is required to determine if MLCK molecules that bundle actin can at the same time move or if they switch between bundling and motion. Also, we are currently working to test our prediction that MLCK can move on actin bundled by other proteins such as α-actinin, because it is an abundant actin-bundling protein in cultured cell stress fibers in which we do observe motion. The existence and relevance of actin bundles per se in intact muscle is not known, but many bundling proteins are present in smooth muscle and cultured cells, such as SM22 (Han et al., 2009); fascin-1 (De Arcangelis et al., 2004); α-actinin, caldesmon, and others (Marston and Smith, 1985). Many actin filaments can surround a single myosin filament in smooth muscles (Devine and Somlyo, 1971), but the spacing between these actin filaments in relation to their bundled status remains unclear.
Figure 6.

Predicted interactions of MLCK/N75 that affect the frequency of motion according to our simple percolation model. The left side of each box shows barriers to MLCK/N75 motion, and the right side shows molecules moving where barrier concentration is lower. Frequency of motion from Figs. 3 and 6 is shown in red type above each molecule. Top (A–D) and bottom (E–G) rows at 150 mM KCL and 300 mM KCl, respectively. In vitro actin bundles (A and E) or stress fibers (B–D and F and G) are parallel blue lines (actins shown apart for clarity). Text at top summarizes conditions (blue) and acto-myosin state (black). The key is in the bottom right box.
The frequencies of motion of both MLCK and N75 were independent of ionic strength between 150 and 300 mM KCl on actin bundles (Fig. 6, A and E, respectively), but no motion was observed at 50 mM KCl regardless of buffer additions (unpublished data). From 150 to 50 mM KCl, the affinity of MLCK for actin increases ∼50-fold (Sellers and Pato, 1984), suggesting that increasing actin-binding affinity stops the motion. This suggests that motion is enhanced by decreasing ionic interactions between the ABD and actin, consistent with the positive charge on the ABD and negative charge on actin. We show that these bundles contain anti-parallel actin filaments (Fig. S1), and junction points and incorrect actin polarity could present barriers to motion. Therefore, we speculate that the moving molecules are in regions of low density of MLCK that is participating in bundling and in regions of actin–actin polarity (either anti-parallel or not) conducive to movement.
In the absence of ATP and Ca2+CaM (Fig. 6 B), unphosphorylated myosin heads bind strongly to the MBD of MLCK; actin and myosin bind strongly to one another, restricting both MLCK and N75 motion; and silent MLCK molecules bound to myosin will present a barrier to QD-MLCK (should it not already be interacting with myosin). Adjacent actin-binding sites for myosin are 35 nm apart, and an MLCK trapped between two such barriers would exhibit no noticeable motion. The difference between MLCK (1.5%) and N75 (18%) moving may be caused by the lack of the MBD in N75, whereas rigor cross-bridges may explain the significant amount of nonmoving N75. At higher ionic strength (Fig. 6 F), similar data were obtained, suggesting that the weakened MBD–myosin interactions were not sufficient to allow MLCK to move. This points to the importance of acto-myosin cross-bridges as a barriers to motion.
In the presence of ATP (Fig. 6, C and G), myosin is in a weak actin-binding state but remains unphosphorylated. The MBD still binds strongly to myosin and restricts motion along with the silent MLCK molecules. Even in the absence of rigor heads, <1% of the MLCK moves. Again, the frequency of N75 motion is relatively high, at 24%. The small increase from 18% (no ATP) to 24% (+ATP) moving may be caused by the lack of rigor head barriers, but silent MLCK–myosin complexes remain. As expected, increasing the ionic strength (Fig. 6, C–G) significantly increased motion for MLCK and N75. This effect was largely caused by weakened MBD–myosin interactions rather than by weakened actin–myosin interactions (see Results). The result was essentially the same with or without the MLCK inhibitor wortmannin, suggesting that the increase in movement was not caused by myosin phosphorylation. Nor was this attributable to ATP affecting MLCK–actin interactions, because under the same conditions, there was little effect of ATP on motion frequency in actin bundles, increasing only 1.2-fold (Fig. 3 A). At the higher ionic strength, N75 motion is also greatly enhanced by adding ATP (compare Fig. 6, F and G; from 16 to 60%), likely because of the diminished MBD–myosin interactions of silent MLCK.
An alternative explanation is that ATP simply weakens the affinity of MLCK for myosin (Fig. 6, B and C, and F and G). Using SMM filaments stabilized against ATP-induced disassembly (Haldeman et al., 2014), we found that the apparent Kd for MLCK binding was 1.3 ± 0.1 µM without ATP and 1.5 ± 0.2 µM with 1 mM ATP. Therefore, the presence of ATP alone does not appreciably alter the affinity of MLCK for unphosphorylated SMM filaments. This suggests that the increase in moving frequency of MLCK upon the addition of ATP (Fig. 6, F vs. G) is a consequence of ATP-induced weakening of the acto–myosin interaction rather than weakening of the MBD–myosin interactions.
If both ATP and Ca2+CaM are present (Fig. 6 D), phosphorylated myosin can now cyclically interact with actin. Importantly, the MBD binds weakly to phosphorylated myosin, allowing a significant frequency of motion for MLCK (11%). The remaining immobile fraction may be caused by residual unphosphorylated myosin. But also the stress fibers likely cannot shorten because they are adhered to the surface, and phosphorylated myosin can enter a strained state in which the rate of ADP release is slow (Cremo and Geeves, 1998; Khromov et al., 2004). This ADP state binds strongly to actin, similar to the rigor state (Cremo and Geeves, 1998), and could therefore present a barrier to MLCK motion. N75 motion is also enhanced (44%) compared with ATP alone (24%). A small fraction of this increase may be caused by direct effects on MLCK that alter its interactions with actin because ATP and Ca2+CaM together modestly increase the frequency of MLCK motion in actin bundles (Fig. 3 A), which lack myosin. The majority of the increase is likely the result of the weak MBD interaction with phosphorylated myosin, but the phosphorylated strained ADP myosin remains as a barrier.
The percolation model of diffusion also leads to predictions about the D of moving molecules. In general, below the cutoff for no diffusion, fewer barriers to motion will lead to faster diffusion (higher D) (Saxton, 1990, 1993). Exact predictions are not possible, but for N75 where all conditions can be compared (Fig. 5 B), faster diffusion correlated with weak myosin–MBD interactions, consistent with our model (Fig. 6, D, F, and G). In bundles, the different D may be related to the kinetics of interactions involved in actin bundling.
Fig. 7 explains how diffusion of MLCK on actin will increase the probability that it can access distal unphosphorylated myosin, while avoiding getting stuck on myosins that have already been phosphorylated. In smooth muscle at physiological [ATP] and low [Ca2+] holding a basal tone at low phosphorylation (Fig. 7 A), MLCK will be localized to regions of unphosphorylated myosin through strong MBD–myosin interactions. Upon muscle activation at higher [Ca2+], MLCK enzyme activity will increase, leading to phosphorylation of local myosin within reach of one MLCK molecule (Fig. 7 B). This may involve several myosins, but only one is shown for clarity. Upon phosphorylation, MBD–myosin interactions are weakened and MLCK can begin longer-range diffusion largely unimpeded by local acto–myosin barriers because the adjacent yet unphosphorylated myosin binds weakly to actin, and the number of cycling heads relative to the total heads is low for this low duty ratio myosin. Diffusion allows MLCK to access unphosphorylated myosin heads that are too distant to reach without diffusion (Fig. 7 C). This is the point at which diffusion may be quite important to the net phosphorylation rate. We have shown that the rate-limiting step in the cyclic interaction of MLCK with myosin is detachment of MLCK from myosin (Hong et al., 2013). Importantly, detachment rates are the same, regardless of whether or not MLCK has already phosphorylated the myosin. Therefore, higher efficiency is attained if MLCK avoids attaching to prephosphorylated myosin altogether. Diffusion of MLCK on actin will increase the probability that it accesses unphosphorylated myosin (Fig. 7 D). As the [Ca2+] falls and the muscle relaxes, some myosin will be dephosphorylated by the phosphatase, and diffusion allows MLCK to rapidly localize to the dephosphorylated myosin to prepare for the next contractile cycle (Fig. 7 E).
Figure 7.
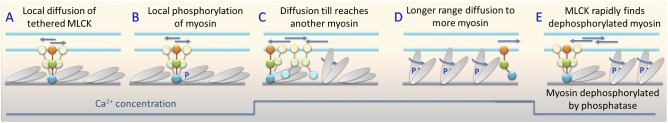
Proposed mechanism for how MLCK diffusion on actin facilitates myosin phosphorylation during a contractile cycle. (A–E) See Fig. 6 for definition of cartoon elements and text for descriptions. Straight blue arrows indicate moving MLCK. Curved blue arrows and blue P on myosin heads indicate cycling phosphorylated myosin. The blue line at the bottom indicates the changes in Ca2+ concentration over time.
Our data point to a novel mechanism in which the state of an enzyme substrate controls the localization of the enzyme. Here, the state of myosin, with respect to both phosphorylation and acto-myosin affinity, controls the motion and therefore the localization of MLCK on actin. This happens only because MLCK can move on actin by diffusion. We suggest that the diffusion of smooth muscle MLCK on actin is an adaptation specific to smooth muscles. The predominant form of myosin in adult smooth muscles must be phosphorylated to turn on the ATPase activity, and therefore phosphorylation is required for contraction. This is in contrast to skeletal and cardiac muscle in which the level of phosphorylation remains fairly constant from contraction to contraction and phosphorylation/dephosphorylation modulates rather than turns on/off the ATPase activity of the respective myosin (Kamm and Stull, 2011). Interestingly, the skeletal and cardiac isoforms of MLCK do not have the ABD domain that is sufficient for diffusion. They are soluble proteins that presumably diffuse in the cytosol. In contrast, the long isoforms of smooth muscle MLCK found in nonmuscle cells and undifferentiated smooth muscle have an N-terminal extension that contains two additional copies of the diffusion domain sequence. It will be of interest to see if this longer MLCK also moves on actin-containing structures.
Our data suggest that 1-D diffusion of MLCK on proximal actin filaments is a mechanism by which one MLCK molecule can phosphorylate many myosin heads in a relatively short period of time. Our observations that MLCK diffusion is influenced by myosin- and MLCK-dependent barriers to diffusion suggest novel mechanisms by which MLCK diffusion is modulated to optimize smooth muscle activation rates.
Supplementary Material
Acknowledgments
We thank Ron Rock and coworkers for experiments of myosin X moving on MLCK-induced actin bundles.
This work was supported by grants from National Heart, Lung and Blood Institute (5R01HL110214 to C.R. Cremo and J.E. Baker) and Canadian Institutes of Health Research (MOP-111262 to M.P. Walsh). M.P. Walsh is an Alberta Innovates-Health Solutions Scientist and Canada Research Chair (Tier 1) in Vascular Smooth Muscle Research.
The authors declare no competing financial interests.
Richard L. Moss served as editor.
Footnotes
Abbreviations used in this paper:
- ABD
- actin-binding domain
- CaM
- calmodulin
- HASMC
- human airway smooth muscle cell
- MBD
- myosin-binding domain
- MLCK
- smooth muscle myosin light chain kinase
- MSD
- mean squared displacement
- QD
- streptavidin-coated quantum dot
- RLC
- regulatory light chain
- SMM
- smooth muscle myosin
- TIRF
- total internal reflection fluorescence
- Tm
- smooth muscle tropomyosin
- TRITC
- tetramethylrhodamine isothiocyanate
References
- Berg H. 1993. Random Walks in Biology. Princeton University Press, Princeton, NJ: 166 pp. [Google Scholar]
- Burgess S.A., Yu S., Walker M.L., Hawkins R.J., Chalovich J.M., and Knight P.J.. 2007. Structures of smooth muscle myosin and heavy meromyosin in the folded, shutdown state. J. Mol. Biol. 372:1165–1178. 10.1016/j.jmb.2007.07.014 [DOI] [PubMed] [Google Scholar]
- Cremo C.R., and Geeves M.A.. 1998. Interaction of actin and ADP with the head domain of smooth muscle myosin: Implications for strain-dependent ADP release in smooth muscle. Biochemistry. 37:1969–1978. 10.1021/bi9722406 [DOI] [PubMed] [Google Scholar]
- Dabrowska R., Hinkins S., Walsh M.P., and Hartshorne D.J.. 1982. The binding of smooth muscle myosin light chain kinase to actin. Biochem. Biophys. Res. Commun. 107:1524–1531. 10.1016/S0006-291X(82)80172-1 [DOI] [PubMed] [Google Scholar]
- De Arcangelis A., Georges-Labouesse E., and Adams J.C.. 2004. Expression of fascin-1, the gene encoding the actin-bundling protein fascin-1, during mouse embryogenesis. Gene Expr. Patterns. 4:637–643. 10.1016/j.modgep.2004.04.012 [DOI] [PubMed] [Google Scholar]
- Devine C.E., and Somlyo A.P.. 1971. Thick filaments in vascular smooth muscle. J. Cell Biol. 49:636–649. 10.1083/jcb.49.3.636 [DOI] [PMC free article] [PubMed] [Google Scholar]
- Gallagher P.J., and Stull J.T.. 1997. Localization of an actin binding domain in smooth muscle myosin light chain kinase. Mol. Cell. Biochem. 173:51–57. 10.1023/A:1006876318155 [DOI] [PubMed] [Google Scholar]
- Greene L.E., Sellers J.R., Eisenberg E., and Adelstein R.S.. 1983. Binding of gizzard smooth muscle myosin subfragment 1 to actin in the presence and absence of adenosine 5′-triphosphate. Biochemistry. 22:530–535. 10.1021/bi00272a002 [DOI] [PubMed] [Google Scholar]
- Haldeman B.D., Brizendine R.K., Facemyer K.C., Baker J.E., and Cremo C.R.. 2014. The kinetics underlying the velocity of smooth muscle myosin filament sliding on actin filaments in vitro. J. Biol. Chem. 289:21055–21070. 10.1074/jbc.M114.564740 [DOI] [PMC free article] [PubMed] [Google Scholar]
- Halford S.E., and Marko J.F.. 2004. How do site-specific DNA-binding proteins find their targets? Nucleic Acids Res. 32:3040–3052. 10.1093/nar/gkh624 [DOI] [PMC free article] [PubMed] [Google Scholar]
- Han M., Dong L.H., Zheng B., Shi J.H., Wen J.K., and Cheng Y.. 2009. Smooth muscle 22 alpha maintains the differentiated phenotype of vascular smooth muscle cells by inducing filamentous actin bundling. Life Sci. 84:394–401. 10.1016/j.lfs.2008.11.017 [DOI] [PubMed] [Google Scholar]
- Hayakawa K., Okagaki T., Higashi-Fujime S., and Kohama K.. 1994. Bundling of actin filaments by myosin light chain kinase from smooth muscle. Biochem. Biophys. Res. Commun. 199:786–791. 10.1006/bbrc.1994.1298 [DOI] [PubMed] [Google Scholar]
- He W.Q., Peng Y.J., Zhang W.C., Lv N., Tang J., Chen C., Zhang C.H., Gao S., Chen H.Q., Zhi G., et al. 2008. Myosin light chain kinase is central to smooth muscle contraction and required for gastrointestinal motility in mice. Gastroenterology. 135:610–620. 10.1053/j.gastro.2008.05.032 [DOI] [PMC free article] [PubMed] [Google Scholar]
- Hong F., Haldeman B.D., John O.A., Brewer P.D., Wu Y.Y., Ni S., Wilson D.P., Walsh M.P., Baker J.E., and Cremo C.R.. 2009. Characterization of tightly associated smooth muscle myosin-myosin light-chain kinase-calmodulin complexes. J. Mol. Biol. 390:879–892. 10.1016/j.jmb.2009.05.033 [DOI] [PMC free article] [PubMed] [Google Scholar]
- Hong F., Haldeman B.D., Jackson D., Carter M., Baker J.E., and Cremo C.R.. 2011. Biochemistry of smooth muscle myosin light chain kinase. Arch. Biochem. Biophys. 510:135–146. 10.1016/j.abb.2011.04.018 [DOI] [PMC free article] [PubMed] [Google Scholar]
- Hong F., Facemyer K.C., Carter M.S., Jackson R., Haldeman B.D., Ruana N., Sutherland C., Walsh M.P., Cremo C.R., and Baker J.E.. 2013. Kinetics of myosin light chain kinase activation of smooth muscle myosin in an in vitro model system. Biochemistry. 52:8489–8500. 10.1021/bi401001x [DOI] [PMC free article] [PubMed] [Google Scholar]
- Horowitz A., Trybus K.M., Bowman D.S., and Fay F.S.. 1994. Antibodies probe for folded monomeric myosin in relaxed and contracted smooth muscle. J. Cell Biol. 126:1195–1200. 10.1083/jcb.126.5.1195 [DOI] [PMC free article] [PubMed] [Google Scholar]
- Howard J. 2001. Mechanics of Motor Proteins and the Cytoskeleton. Sinauer Associates, Sunderland, MA: 367 pp. [Google Scholar]
- Hunter A.W., Caplow M., Coy D.L., Hancock W.O., Diez S., Wordeman L., and Howard J.. 2003. The kinesin-related protein MCAK is a microtubule depolymerase that forms an ATP-hydrolyzing complex at microtubule ends. Mol. Cell. 11:445–457. 10.1016/S1097-2765(03)00049-2 [DOI] [PMC free article] [PubMed] [Google Scholar]
- Injeti E.R., Sandoval R.J., Williams J.M., Smolensky A.V., Ford L.E., and Pearce W.J.. 2008. Maximal stimulation-induced in situ myosin light chain kinase activity is upregulated in fetal compared with adult ovine carotid arteries. Am. J. Physiol. Heart Circ. Physiol. 295:H2289–H2298. 10.1152/ajpheart.00606.2008 [DOI] [PMC free article] [PubMed] [Google Scholar]
- Itoh T., Ikebe M., Kargacin G.J., Hartshorne D.J., Kemp B.E., and Fay F.S.. 1989. Effects of modulators of myosin light-chain kinase activity in single smooth muscle cells. Nature. 338:164–167. 10.1038/338164a0 [DOI] [PubMed] [Google Scholar]
- Jung H.S., Billington N., Thirumurugan K., Salzameda B., Cremo C.R., Chalovich J.M., Chantler P.D., and Knight P.J.. 2011. Role of the tail in the regulated state of myosin 2. J. Mol. Biol. 408:863–878. 10.1016/j.jmb.2011.03.019 [DOI] [PMC free article] [PubMed] [Google Scholar]
- Kamm K.E., and Stull J.T.. 2001. Dedicated myosin light chain kinases with diverse cellular functions. J. Biol. Chem. 276:4527–4530. 10.1074/jbc.R000028200 [DOI] [PubMed] [Google Scholar]
- Kamm K.E., and Stull J.T.. 2011. Signaling to myosin regulatory light chain in sarcomeres. J. Biol. Chem. 286:9941–9947. 10.1074/jbc.R110.198697 [DOI] [PMC free article] [PubMed] [Google Scholar]
- Kenney R.E., Hoar P.E., and Kerrick W.G.. 1990. The relationship between ATPase activity, isometric force, and myosin light-chain phosphorylation and thiophosphorylation in skinned smooth muscle fiber bundles from chicken gizzard. J. Biol. Chem. 265:8642–8649. [PubMed] [Google Scholar]
- Khromov A.S., Webb M.R., Ferenczi M.A., Trentham D.R., Somlyo A.P., and Somlyo A.V.. 2004. Myosin regulatory light chain phosphorylation and strain modulate adenosine diphosphate release from smooth muscle Myosin. Biophys. J. 86:2318–2328. 10.1016/S0006-3495(04)74289-7 [DOI] [PMC free article] [PubMed] [Google Scholar]
- Liu J., Wendt T., Taylor D., and Taylor K.. 2003. Refined model of the 10S conformation of smooth muscle myosin by cryo-electron microscopy 3D image reconstruction. J. Mol. Biol. 329:963–972. 10.1016/S0022-2836(03)00516-3 [DOI] [PubMed] [Google Scholar]
- Mabuchi Y., Mabuchi K., Stafford W.F., and Grabarek Z.. 2010. Modular structure of smooth muscle myosin light chain kinase: Hydrodynamic modeling and functional implications. Biochemistry. 49:2903–2917. 10.1021/bi901963e [DOI] [PMC free article] [PubMed] [Google Scholar]
- Marston S.B., and Smith C.W.. 1985. The thin filaments of smooth muscles. J. Muscle Res. Cell Motil. 6:669–708. 10.1007/BF00712237 [DOI] [PubMed] [Google Scholar]
- Milton D.L., Schneck A.N., Ziech D.A., Ba M., Facemyer K.C., Halayko A.J., Baker J.E., Gerthoffer W.T., and Cremo C.R.. 2011. Direct evidence for functional smooth muscle myosin II in the 10S self-inhibited monomeric conformation in airway smooth muscle cells. Proc. Natl. Acad. Sci. USA. 108:1421–1426. 10.1073/pnas.1011784108 [DOI] [PMC free article] [PubMed] [Google Scholar]
- Ngai P.K., Carruthers C.A., and Walsh M.P.. 1984. Isolation of the native form of chicken gizzard myosin light-chain kinase. Biochem. J. 218:863–870. 10.1042/bj2180863 [DOI] [PMC free article] [PubMed] [Google Scholar]
- Olney J.J., Sellers J.R., and Cremo C.R.. 1996. Structure and function of the 10 S conformation of smooth muscle myosin. J. Biol. Chem. 271:20375–20384. 10.1074/jbc.271.34.20375 [DOI] [PubMed] [Google Scholar]
- Onishi H., and Wakabayashi T.. 1982. Electron microscopic studies of myosin molecules from chicken gizzard muscle I: The formation of the intramolecular loop in the myosin tail. J. Biochem. 92:871–879. [DOI] [PubMed] [Google Scholar]
- Perry S.V. 2001. Vertebrate tropomyosin: distribution, properties and function. J. Muscle Res. Cell Motil. 22:5–49. 10.1023/A:1010303732441 [DOI] [PubMed] [Google Scholar]
- Pinto A., Sánchez F., Alamo L., and Padrón R.. 2012. The myosin interacting-heads motif is present in the relaxed thick filament of the striated muscle of scorpion. J. Struct. Biol. 180:469–478. 10.1016/j.jsb.2012.08.010 [DOI] [PubMed] [Google Scholar]
- Saxton M.J. 1990. Lateral diffusion in a mixture of mobile and immobile particles. A Monte Carlo study. Biophys. J. 58:1303–1306. 10.1016/S0006-3495(90)82470-X [DOI] [PMC free article] [PubMed] [Google Scholar]
- Saxton M.J. 1993. Lateral diffusion in an archipelago. Single-particle diffusion. Biophys. J. 64:1766–1780. 10.1016/S0006-3495(93)81548-0 [DOI] [PMC free article] [PubMed] [Google Scholar]
- Sellers J.R., and Pato M.D.. 1984. The binding of smooth muscle myosin light chain kinase and phosphatases to actin and myosin. J. Biol. Chem. 259:7740–7746. [PubMed] [Google Scholar]
- Silver D.L., Vorotnikov A.V., Watterson D.M., Shirinsky V.P., and Sellers J.R.. 1997. Sites of interaction between kinase-related protein and smooth muscle myosin. J. Biol. Chem. 272:25353–25359. 10.1074/jbc.272.40.25353 [DOI] [PubMed] [Google Scholar]
- Spudich J.A., and Watt S.. 1971. The regulation of rabbit skeletal muscle contraction. I. Biochemical studies of the interaction of the tropomyosin-troponin complex with actin and the proteolytic fragments of myosin. J. Biol. Chem. 246:4866–4871. [PubMed] [Google Scholar]
- Thompson R.E., Larson D.R., and Webb W.W.. 2002. Precise nanometer localization analysis for individual fluorescent probes. Biophys. J. 82:2775–2783. 10.1016/S0006-3495(02)75618-X [DOI] [PMC free article] [PubMed] [Google Scholar]
- Tonino P., Simon M., and Craig R.. 2002. Mass determination of native smooth muscle myosin filaments by scanning transmission electron microscopy. J. Mol. Biol. 318:999–1007. 10.1016/S0022-2836(02)00191-2 [DOI] [PubMed] [Google Scholar]
- Trybus K.M., and Lowey S.. 1984. Conformational states of smooth muscle myosin. Effects of light chain phosphorylation and ionic strength. J. Biol. Chem. 259:8564–8571. [PubMed] [Google Scholar]
- Weber L.P., Seto M., Sasaki Y., Swärd K., and Walsh M.P.. 2000. The involvement of protein kinase C in myosin phosphorylation and force development in rat tail arterial smooth muscle. Biochem. J. 352:573–582. 10.1042/bj3520573 [DOI] [PMC free article] [PubMed] [Google Scholar]
- Wendt T., Taylor D., Messier T., Trybus K.M., and Taylor K.A.. 1999. Visualization of head-head interactions in the inhibited state of smooth muscle myosin. J. Cell Biol. 147:1385–1390. 10.1083/jcb.147.7.1385 [DOI] [PMC free article] [PubMed] [Google Scholar]
- Wendt T., Taylor D., Trybus K.M., and Taylor K.. 2001. Three-dimensional image reconstruction of dephosphorylated smooth muscle heavy meromyosin reveals asymmetry in the interaction between myosin heads and placement of subfragment 2. Proc. Natl. Acad. Sci. USA. 98:4361–4366. 10.1073/pnas.071051098 [DOI] [PMC free article] [PubMed] [Google Scholar]
- Woodhead J.L., Zhao F.Q., Craig R., Egelman E.H., Alamo L., and Padrón R.. 2005. Atomic model of a myosin filament in the relaxed state. Nature. 436:1195–1199. 10.1038/nature03920 [DOI] [PubMed] [Google Scholar]
- Ye L.H., Hayakawa K., Kishi H., Imamura M., Nakamura A., Okagaki T., Takagi T., Iwata A., Tanaka T., and Kohama K.. 1997. The structure and function of the actin-binding domain of myosin light chain kinase of smooth muscle. J. Biol. Chem. 272:32182–32189. 10.1074/jbc.272.51.32182 [DOI] [PubMed] [Google Scholar]
- Yu S., Wang S., and Larson R.G.. 2013. Proteins searching for their target on DNA by one-dimensional diffusion: overcoming the “speed-stability” paradox. J. Biol. Phys. 39:565–586. 10.1007/s10867-013-9310-3 [DOI] [PMC free article] [PubMed] [Google Scholar]
- Zhang W.C., Peng Y.J., Zhang G.S., He W.Q., Qiao Y.N., Dong Y.Y., Gao Y.Q., Chen C., Zhang C.H., Li W., et al. 2010. Myosin light chain kinase is necessary for tonic airway smooth muscle contraction. J. Biol. Chem. 285:5522–5531. 10.1074/jbc.M109.062836 [DOI] [PMC free article] [PubMed] [Google Scholar]
- Zimmermann B., Somlyo A.V., Ellis-Davies G.C., Kaplan J.H., and Somlyo A.P.. 1995. Kinetics of prephosphorylation reactions and myosin light chain phosphorylation in smooth muscle. Flash photolysis studies with caged calcium and caged ATP. J. Biol. Chem. 270:23966–23974. 10.1074/jbc.270.41.23966 [DOI] [PubMed] [Google Scholar]
Associated Data
This section collects any data citations, data availability statements, or supplementary materials included in this article.