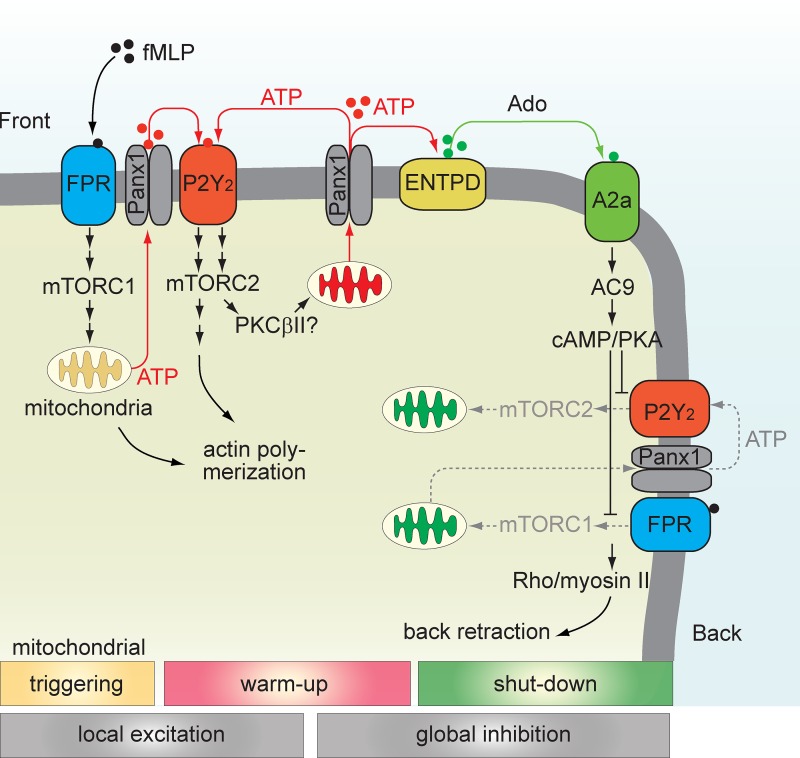
Neutrophil chemotaxis is regulated by opposing autocrine purinergic signaling mechanisms, which are stimulated by mitochondrial ATP formation that is up-regulated via mTOR and P2Y2 receptors at the front and down-regulated via A2a receptors and cAMP/PKA signaling at the back of cells.
Abstract
Neutrophils use chemotaxis to locate invading bacteria. Adenosine triphosphate (ATP) release and autocrine purinergic signaling via P2Y2 receptors at the front and A2a receptors at the back of cells regulate chemotaxis. Here, we examined the intracellular mechanisms that control these opposing signaling mechanisms. We found that mitochondria deliver ATP that stimulates P2Y2 receptors in response to chemotactic cues, and that P2Y2 receptors promote mTOR signaling, which augments mitochondrial activity near the front of cells. Blocking mTOR signaling with rapamycin or PP242 or mitochondrial ATP production (e.g., with CCCP) reduced mitochondrial Ca2+ uptake and membrane potential, and impaired cellular ATP release and neutrophil chemotaxis. Autocrine stimulation of A2a receptors causes cyclic adenosine monophosphate accumulation at the back of cells, which inhibits mTOR signaling and mitochondrial activity, resulting in uropod retraction. We conclude that mitochondrial, purinergic, and mTOR signaling regulates neutrophil chemotaxis and may be a pharmacological target in inflammatory diseases.
Introduction
Efficient chemotaxis is an essential feature of polymorphonuclear neutrophils (PMNs), allowing these important immune cells to orient and navigate in chemical gradients that emanate from sites of infection and inflammation. The cellular processes involved in chemotaxis are triggered by chemoattractant receptors expressed on the cell surface of PMNs. Mathematical modeling suggests that chemotaxis is regulated by local excitatory and global inhibitory mechanisms at the front and back of cells (Parent and Devreotes, 1999; Jilkine and Edelstein-Keshet, 2011). Various local excitation and global inhibition (LEGI) models of chemotaxis were proposed in an attempt to explain how such excitatory and inhibitory feedback mechanisms might convert external chemotactic cues into the cellular signaling events that regulate cell polarization, gradient sensing, and the effective migration of PMNs upstream of chemotactic gradient fields (Parent and Devreotes, 1999; Levchenko and Iglesias, 2002; Wang, 2009; Houk et al., 2012; Ku et al., 2012).
We reported previously that ATP release and autocrine purinergic signaling regulate PMN chemotaxis (Chen et al., 2006; Bao et al., 2013). This inside-out signaling mechanism involves several members of the purinergic receptor family that is comprised of P1 receptors recognizing adenosine (A1, A2a, A2b, and A3), P2X receptors recognizing ATP (P2X1-7), and P2Y receptors recognizing ATP and other nucleotides (Burnstock, 2007; Burnstock et al., 2010). The most prominently expressed purinergic receptor subtypes in PMNs are A2a, P2Y2, and A3 receptors, which have key roles in the regulation of chemotaxis (Chen et al., 2006; Bao et al., 2013). Autocrine stimulation of P2Y2 and A3 receptors amplifies formyl peptide receptor (FPR) signaling by promoting excitatory signals that elicit chemotactic responses at the front of cells (Chen et al., 2006). Autocrine stimulation of A2a receptors at the back of cells triggers cAMP/protein kinase A (PKA) signaling and a global inhibition mechanism that maintains cell polarization and promotes uropod retraction (Bao et al., 2013).
Carole Parent and coworkers have recently shown that metabolic regulation via mTOR complex 2 (mTORC2) contributes to F-actin polarization at the front of cells, whereas adenylyl cyclase 9 (AC9) stimulates cAMP/PKA/MyoII-mediated signaling that contributes to uropod retraction at the back of cells (Liu et al., 2010, 2014). Despite these remarkable advances in our understanding of the mechanisms that regulate chemotaxis, the upstream signaling events that trigger mTORC2 and AC9 activation have remained unclear. In the current study, we focused on these open questions and on the missing links that tie metabolic signaling pathways to the autocrine purinergic signaling mechanisms that convert external cues to appropriate chemotactic responses at the front and back of PMNs.
We recently discovered that mitochondria in PMNs produce ATP to fuel the purinergic signaling mechanisms that trigger cell activation (Bao et al., 2014). Because mitochondria can be regulated by mTOR signaling (Desai et al., 2002; Ramanathan and Schreiber, 2009), we hypothesized that mTOR signaling is linked to mitochondrial ATP production and the localized ATP release that drives the autocrine purinergic mechanisms in PMN chemotaxis. Our results demonstrate that chemotactic stimuli trigger two phases of mTOR signaling that differentially regulate mitochondria and purinergic signaling at the front and back of PMNs.
Results
Mitochondria regulate PMN chemotaxis
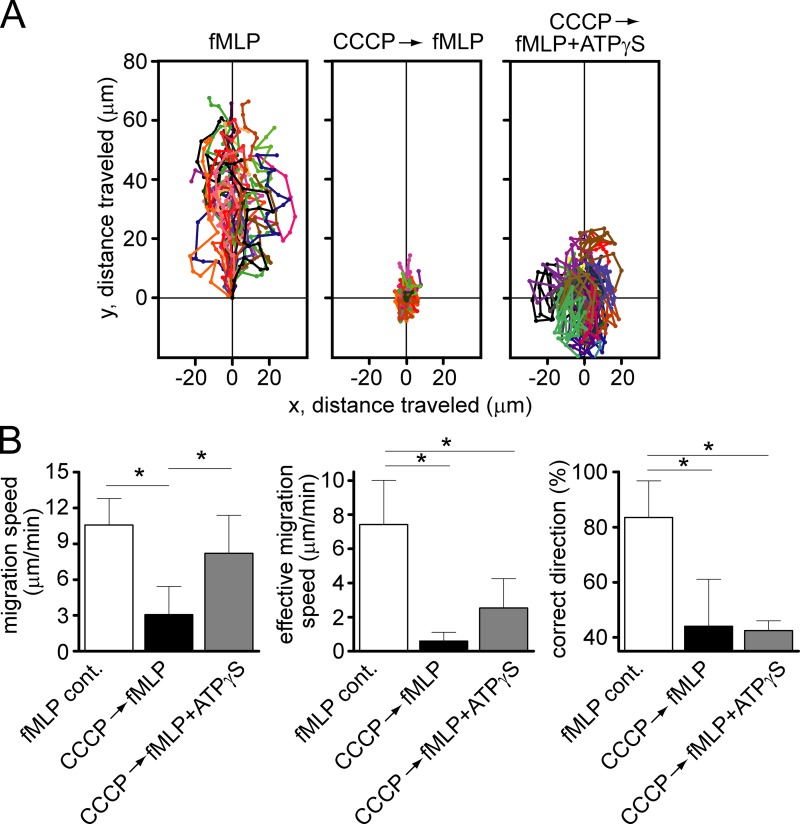
We reported previously that mitochondria are required for FPR-induced ATP release and activation of PMNs (Bao et al., 2014). Here, we studied whether mitochondria regulate PMN chemotaxis using live-cell imaging of human PMNs in a chemotactic gradient field generated with a micropipette loaded with 100 nM fMLP (Fig. 1). Inhibition of mitochondrial ATP production with carbonyl cyanide m-chlorophenyl hydrazone (CCCP) blocked PMN chemotaxis by impairing gradient sensing and reducing the speed of migration. CCCP completely abolished the ability of cells to recognize and navigate in a chemotactic gradient field (Fig. 1, A and B; and Video 1). The addition of the nonhydrolyzable ATP analogue ATPγS increased migration speed of CCCP-treated PMNs, but it did not restore the gradient-sensing ability of these cells (Fig. 1, A and B). Using potassium cyanide and rotenone that inhibit other steps involved in mitochondrial ATP production also impaired chemotaxis (Fig. S1, A and B; and Video 1). Inhibition of mitochondria with CCCP also impaired chemotaxis of neutrophils to interleukin-8 (IL-8) and leukotriene B4 (LTB4; Fig. S1, C and D, and Video 2). Collectively with our previous work, these findings indicate that mitochondria have an important role in PMN chemotaxis by delivering the ATP that fuels the localized autocrine purinergic signaling events at the front and back of cells.
Figure 1.
Inhibition of mitochondria by CCCP impairs PMN chemotaxis. (A) Freshly isolated primary human PMNs were exposed to a chemotactic gradient using a micropipette loaded with 100 nM fMLP, and migration of cells was recorded under the microscope. The chemotactic behavior of untreated cells and of cells pretreated with 1 µM CCCP with or without 100 µM ATPγS was compared using traces of individual cells (see also Video 1, top). Data shown are representative of results obtained with cells from at least three different healthy individuals. (B) The total length each cell traveled over the observation period was used to calculate migration speed. The effective migration speed was calculated from the Euclidean distance each cell traveled. Cells were considered to migrate in the correct direction when their migration paths did not deviate by more than 60° from a straight line toward the micropipette tip. Cells were isolated from at least three different healthy individuals, and data are expressed as mean ± SD (error bars) of n = 20–40 cells from each donor. Statistical analysis was done with one-way ANOVA; *, P < 0.05.
Differential mitochondrial activation in polarized cells
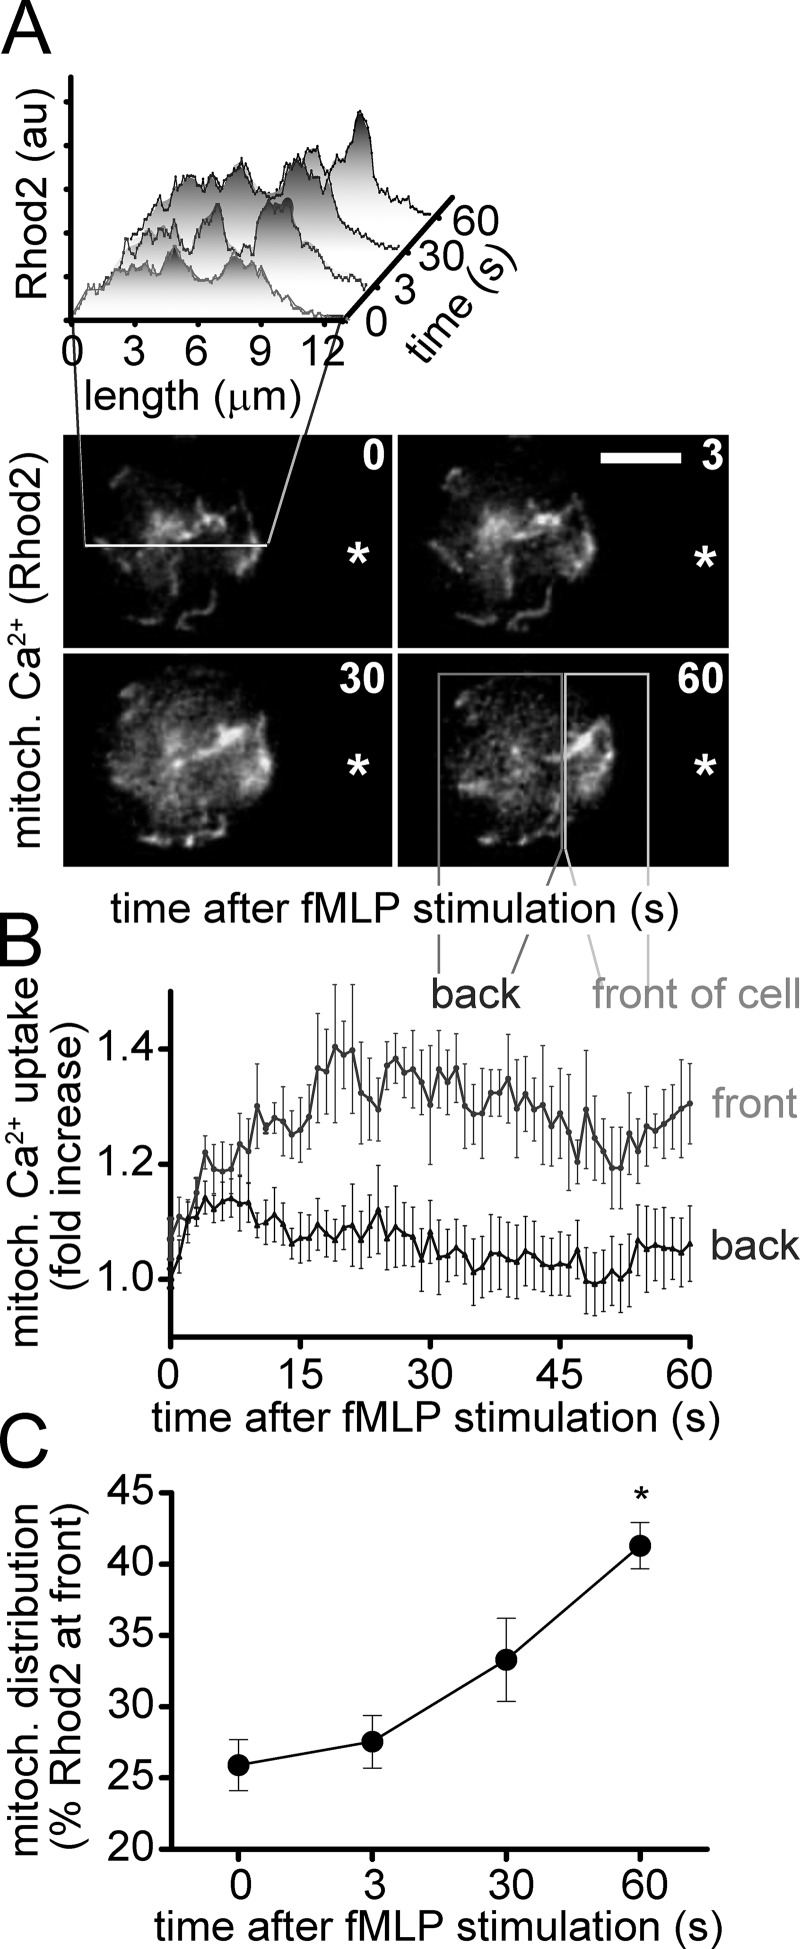
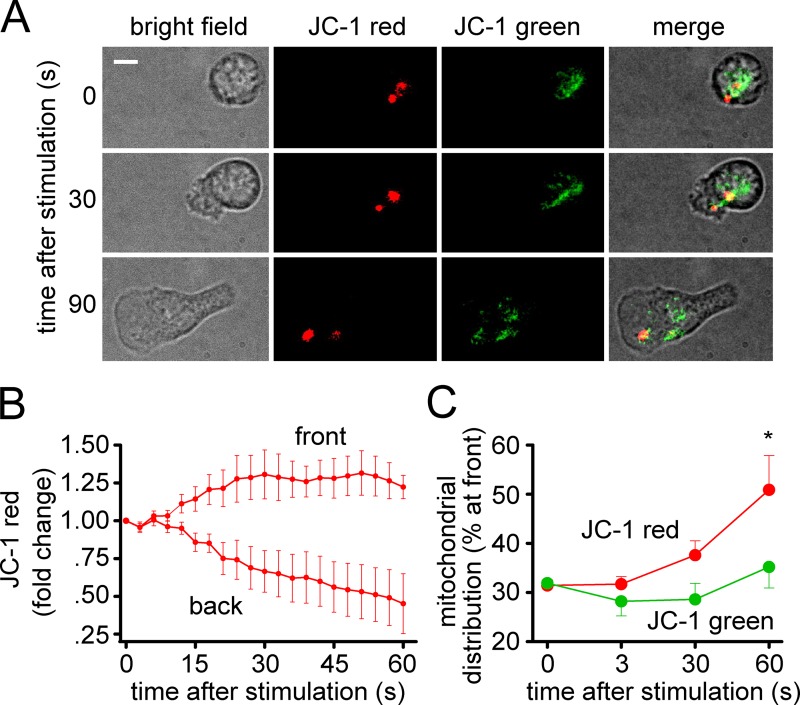
Localized ATP release regulates gradient sensing by promoting excitatory feedback loops at the front of PMNs (Chen et al., 2006, 2010). These local excitatory feedback mechanisms at the front are accompanied by global inhibitory feedback at the back of cells, which is mediated by A2a receptors that translocate from the front to the back during cell polarization (Bao et al., 2013). However, it is unclear how these excitatory and inhibitory purinergic signaling systems are fueled at the front and back of cells. We hypothesized that one possible mechanism could be through differential regulation of mitochondrial activation at the front versus back of cells. To study the activation of mitochondria in PMNs, we used the fluorescent probe Rhod2 to monitor mitochondrial Ca2+ uptake, which is an essential step in the activation of mitochondrial ATP production (Brookes et al., 2004). Counterstaining with MitoTracker green was used to verify optimal experimental conditions that result in loading of Rhod2 primarily in mitochondria (Fig. S2 A). Rhod2 and MitoTracker staining revealed a complex mitochondrial network extending from the nucleus throughout the cell (Fig. S2, A–C). Stimulation of PMNs in a chemotactic gradient generated with a micropipette loaded with 100 nM fMLP triggered rapid mitochondrial Ca2+ uptake (Figs. 2 A and S2 C; and Video 3). Immediately after cell stimulation, the Rhod2 signal rose rapidly throughout the entire mitochondrial network, followed by a condensation in more discrete regions that translocated from the back toward the front of polarized cells (Fig. 2 B). As a consequence, the Rhod2 signal was stronger at the front than at the back of polarized PMNs (Fig. 2, A–C). These findings demonstrate that the stimulation of PMNs with fMLP triggers initial rapid global mitochondrial activation, which is followed by cell polarization, and the differential distribution of active mitochondria at the front versus back of cells. Next, we assessed the mitochondrial membrane potential (Δψm) in PMNs during cell polarization and chemotaxis. For that purpose, we used the mitochondrial probe JC-1, which accumulates in the mitochondrial membrane where it emits a red fluorescent signal when Δψm is high and a green or no fluorescent signal when Δψm is low (Reers et al., 1995; Keil et al., 2011). Human PMNs stained with JC-1 were exposed to an fMLP gradient field generated with the micropipette system described above, and changes in Δψm were monitored with fluorescence microscopy (Figs. 3 and S2 D). We found distinct subsets of mitochondria that separated during cell polarization (Fig. 3 A and Video 4). Although a small population of mitochondria with high Δψm (red JC-1 signal) was found near the front of polarized cells, a larger portion of mitochondria with low (green JC-1 signal) or with potentially no detectable Δψm (no JC-1 signal) accumulated at the back of these cells (Fig. 3, A–C). These findings suggest that activated mitochondria deliver the ATP that promotes purinergic signaling at the front of polarized PMNs, whereas decreased mitochondrial activity at the back may contribute to uropod retraction.
Figure 2.
FPR stimulation activates mitochondria at the front of cells. PMNs were plated onto fibronectin-coated glass coverslips and stained with 1 µM Rhod2 for 5 min, and mitochondrial Ca2+ uptake was monitored in real-time using fluorescence microscopy (DMI6000 B; Leica; objective: 100× oil, NA 1.30; DFC365 FX camera; Leica). (A) Rhod2 fluorescence changes after stimulation with 100 nM fMLP using a micropipette (tip indicated by asterisk) were recorded over time and analyzed using ImageJ (inset). The data shown are from a single representative experiment out of at least 15 separate experiments with cells from three donors (bar, 5 µm). (B and C) Rhod2 signal changes at the front and back of the cells were analyzed over time using the sections as shown in A. The distribution of activated mitochondria to the front over time (C) is shown as the percentage of Rhod2 signal at the front versus the whole cell. Data represent means ± SD (error bars) of 15–25 cells (see also Video 3). Statistical analysis was done with one-way ANOVA; *, P < 0.05.
Figure 3.
Activated mitochondria with higher Δψm accumulate at the front of cells. (A) PMNs were plated onto fibronectin-coated glass coverslips and stained with 100 ng/ml JC-1 for 15 min, and the Δψm was recorded in real time using fluorescence microscopy (DMI6000 B; Leica; objective: 100× oil, NA 1.30; Spot Boost EMCCD camera, EM 150; bar, 5 µm; see also Video 4). (B) The change in JC-1 red fluorescence was analyzed separately for mitochondria at the front and back of cells. (C) The change in the percentage of mitochondria with high versus low membrane potential at the front of cells is shown at different times after fMLP stimulation. Data represent means ± SD (error bars) of normalized gray values of 15–25 cells. Statistical analysis was done with one-way ANOVA; *, P < 0.05.
mTOR signaling regulates mitochondrial function and chemotaxis
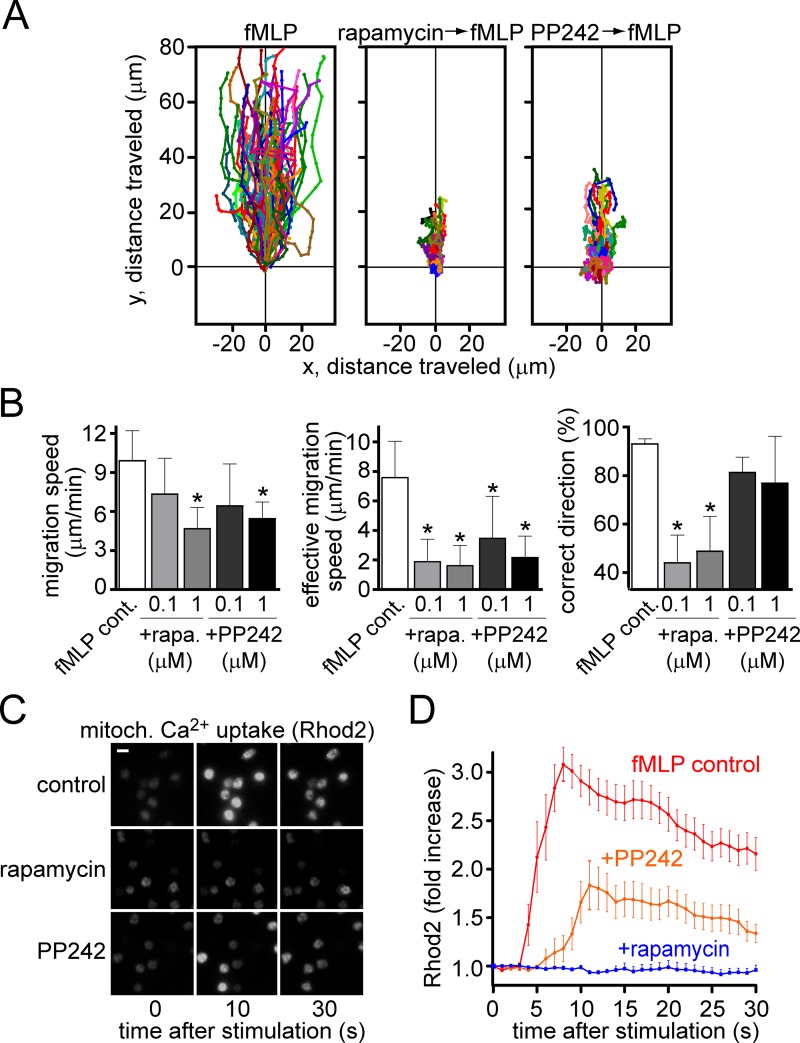
Previous reports have shown that mTOR activation is involved in the regulation of PMN chemotaxis (Liu et al., 2010). Specifically, mTORC2 was shown to induce pseudopod extension and cAMP accumulation in polarized PMNs (Liu et al., 2010). Other reports have shown that mTORC1 is also involved in the migration of dendritic cells and cancer cells (Delgado-Martín et al., 2011; Dillenburg-Pilla et al., 2015). Mitochondrial activation in human T cells and various other cell types is regulated by mTOR signaling (Desai et al., 2002; Ramanathan and Schreiber, 2009; Wang et al., 2010; Colombi et al., 2011; Murata et al., 2011; Hagiwara et al., 2012; Yuan et al., 2012; Wu et al., 2013). Therefore, we hypothesized that mTOR signaling could also regulate mitochondrial activity in PMNs and contribute to PMN chemotaxis. To test this hypothesis, we first evaluated how inhibition of mTOR signaling affects purinergic signaling and chemotaxis. We used rapamycin to block mTORC1 signaling and PP242 to block signaling via both mTORC1 and mTORC2 (Liu et al., 2012). Pretreatment of PMNs with rapamycin or PP242 reduced FPR- and IL-8–induced chemotaxis (Figs. 4 A and S3 A, and Video 5). Both inhibitors reduced overall migration speed and the effective migration speed of cells toward the chemoattractant source (Figs. 4 B and S3 B). Rapamycin and PP242 also inhibited FPR-induced ATP release from PMNs (Fig. S4 A). Collectively, these results indicate that mTOR signaling contributes to chemotaxis by regulating ATP production and purinergic signaling of PMNs. To study the role of mTOR signaling in the regulation of mitochondrial activity, we loaded PMNs with Rhod2 to assess mitochondrial Ca2+ uptake after the inhibition of mTOR signaling with rapamycin or PP242 (1 µM). Both inhibitors markedly impaired mitochondrial Ca2+ uptake in response to fMLP stimulation (Fig. 4, C and D; and Video 6). We found similar results with human HL-60 leukemia cells that were differentiated with DMSO to induce a PMN-like phenotype capable of chemotaxis in response to fMLP (Fig. S4, B and C; and Video 7). Blocking FPR-induced ATP release with the gap junction inhibitor carbenoxolone inhibited mitochondrial Ca2+ uptake in both PMNs and differentiated HL-60s (Fig. S4, D and E; and Video 8; data on HL-60 cells not depicted). These results indicate that mTOR signaling, mitochondrial activity, ATP release, and autocrine feedback via purinergic receptors synergize to regulate chemotaxis of human PMNs and HL-60 cells.
Figure 4.
Inhibition of mTOR impairs FPR-induced PMN chemotaxis and blocks mitochondrial activity. (A and B) Freshly isolated primary human PMNs were exposed to a chemotactic gradient using 100 nM fMLP in a micropipette, and cell migration was monitored. The chemotactic behavior of untreated cells and of cells pretreated for 30 min with 1 µM rapamycin or 1 µM PP242 was recorded (see also Video 5, top). Data shown are representative of results obtained with cells from at least three different healthy individuals. (B) Migration speed, effective migration speed, and correct direction were calculated as described for Fig. 1. Data shown are expressed as mean ± SD, and accumulated results are from using cells from at least three different individuals; n = 20–40 cells in each experiment. Statistical analysis was done with one-way ANOVA; *, P < 0.05. (C and D) Mitochondrial Ca2+ uptake in PMNs was assessed with 1 µM Rhod2 as described in Fig. 2 by using a fluorescence microscope (DMI6000 B; Leica; objective: 100× oil, NA 1.30; DFC365 FX camera; Leica). Cells were stimulated with 1 nM fMLP in the absence or presence of 1 µM rapamycin or 1 µM PP242. Data shown are means ± SD (error bars) of normalized gray values of 15–25 cells (bar, 10 µm; see also Video 6).
FPR-induced purinergic signaling activates mTOR and mitochondria
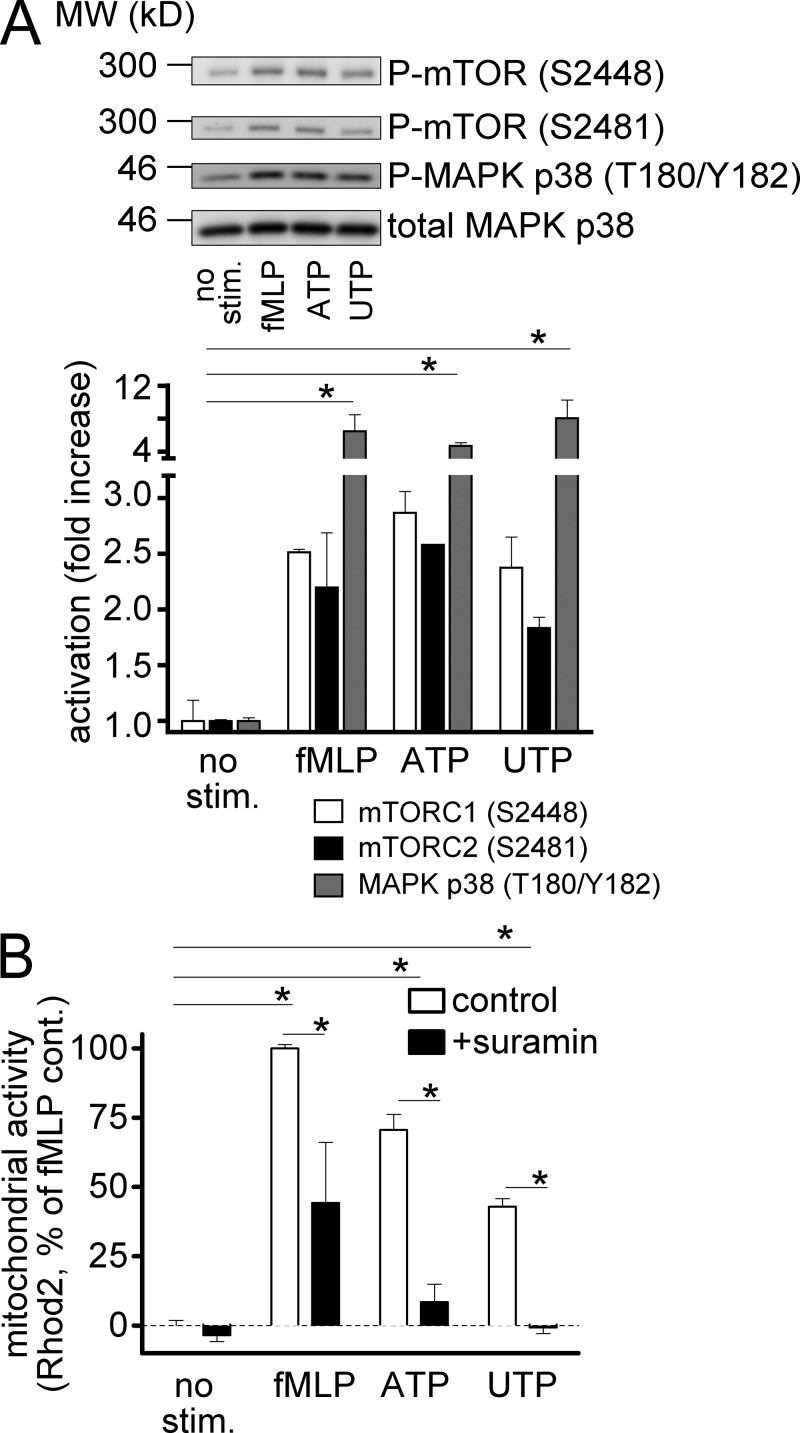
The findings above demonstrate that mTOR signaling is linked to the purinergic signaling mechanisms that regulate chemotaxis. Cellular ATP release fuels purinergic signaling and triggers functional PMN responses (Bao et al., 2014). Therefore, we investigated possible links between P2 receptors and mTOR signaling. Stimulation of differentiated HL-60 cells with fMLP caused robust phosphorylation of mTOR at positions S2448 and S2481 (Fig. 5 A). Phosphorylation at these positions is associated with mTORC1 and mTORC2 signaling, respectively (Copp et al., 2009). ATP, the natural ligand of many P2 receptor subtypes including P2Y2, and UTP, a specific ligand of P2Y2 receptors, also triggered robust mTOR phosphorylation on positions S2448 and S2481 (Fig. 5 A). These effects of fMLP, ATP, and UTP were paralleled by phosphorylation of MAPK p38 on positions T180 and Y182, which has been previously shown to occur as a result of FPR-induced P2Y2 receptor stimulation (Chen et al., 2010). These findings suggest that P2Y2 receptors facilitate the activation of mTOR and mitochondria in response to FPR stimulation. In support of this notion, we found that ligands of P2Y2 receptors mimicked the effects of fMLP on mitochondrial activation, and that this process was inhibited by the P2 receptor antagonist suramin (Fig. 5 B). These findings demonstrate that autocrine purinergic signaling via P2 receptors is linked to mTOR activation and the stimulation of mitochondria downstream of FPR.
Figure 5.
FPR and P2Y2 trigger mTOR phosphorylation and mitochondrial activation. (A) Differentiated HL-60 cells were stimulated for 30 s with 1 µM fMLP, 100 µM ATP, or 100 µM UTP, and mTOR and MAPK p38 activation was determined by immunoblotting with phosphospecific anti-mTOR and anti–MAPK p38 antibodies. Antibodies recognizing total MAPK p38 were used to verify equal protein loading. (B) Freshly isolated PMNs were loaded with 1 µM Rhod2 for 5 min, pretreated or not (control) with 100 µM suramin, and stimulated with fMLP, ATP, or UTP for 1 min, and mitochondrial Ca2+ uptake was estimated with flow cytometry. Results are expressed as means ± SD (error bars) and are representative of at least three independent experiments; one-way ANOVA; *, P < 0.05.
P2Y2 receptors trigger mTORC2
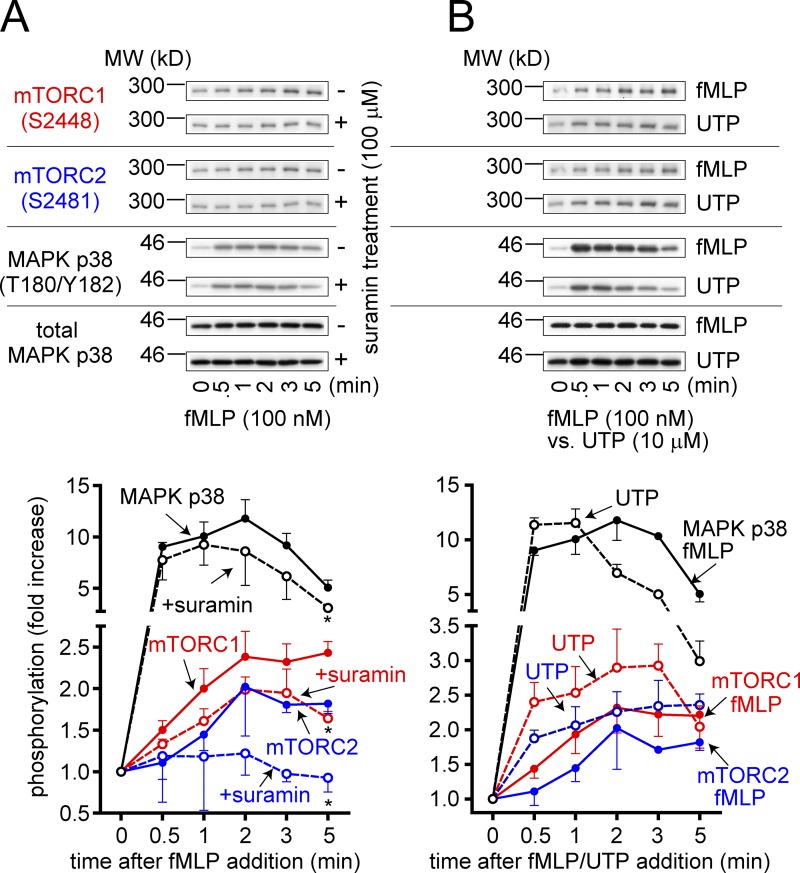
The findings above indicate that FPR-induced stimulation of P2Y2 receptors regulates mTOR signaling, mitochondrial activity, and chemotaxis. To define how FPR and P2Y2 receptors are tied to mTOR signaling, we studied the temporal sequence of activation of MAPK p38, mTORC1, and mTORC2 in response to FPR and P2Y2 receptor stimulation. Stimulation of FPR with fMLP triggered the phosphorylation of MAPK p38 followed by mTOR on positions S2448 and S2481 (Fig. 6 A). This suggests sequential activation of MAPK p38, mTORC1, and then mTORC2. Suramin inhibited the activation of MAPK p38 and mTORC1 and completely abrogated the activation of mTORC2 (Fig. 6 A), which indicates that FPR and P2Y2 receptors synergize in the induction of MAPK p38 and mTORC1 activation, whereas P2Y2 receptors seem solely responsible for triggering mTORC2 signaling. This conclusion is further supported by the effects of fMLP and UTP on MAPK p38 and mTOR signaling. UTP was more effective than fMLP in triggering mTORC2 signaling (Fig. 6 B). Suramin blocks P2Y2-induced mTOR phosphorylation (Fig. S5 A). Collectively, these findings demonstrate that FPR and P2Y2 receptors cooperate in stimulating mTORC1 signaling via autocrine purinergic feedback amplification. However, triggering of mTORC2 signaling is dependent on P2Y2 receptors and purinergic signaling amplification.
Figure 6.
P2Y2 receptors trigger mTORC2 signaling. Differentiated HL-60 cells were pretreated with or without 100 µM suramin (A) for 5 min and stimulated with (B) 100 nM fMLP or 10 µM UTP for the indicated periods of time, and activation of MAPK p38, mTORC1, and mTORC2 signaling was determined by immunoblotting as described in Fig. 5. Total MAPK p38 antibodies were used as a protein loading control. Error bars represent means ± SD (error bars) of at least three independent experiments; *, P < 0.05, compared with corresponding control; Student’s t test.
Inhibitory autocrine feedback via A2a receptors blocks mTOR signaling
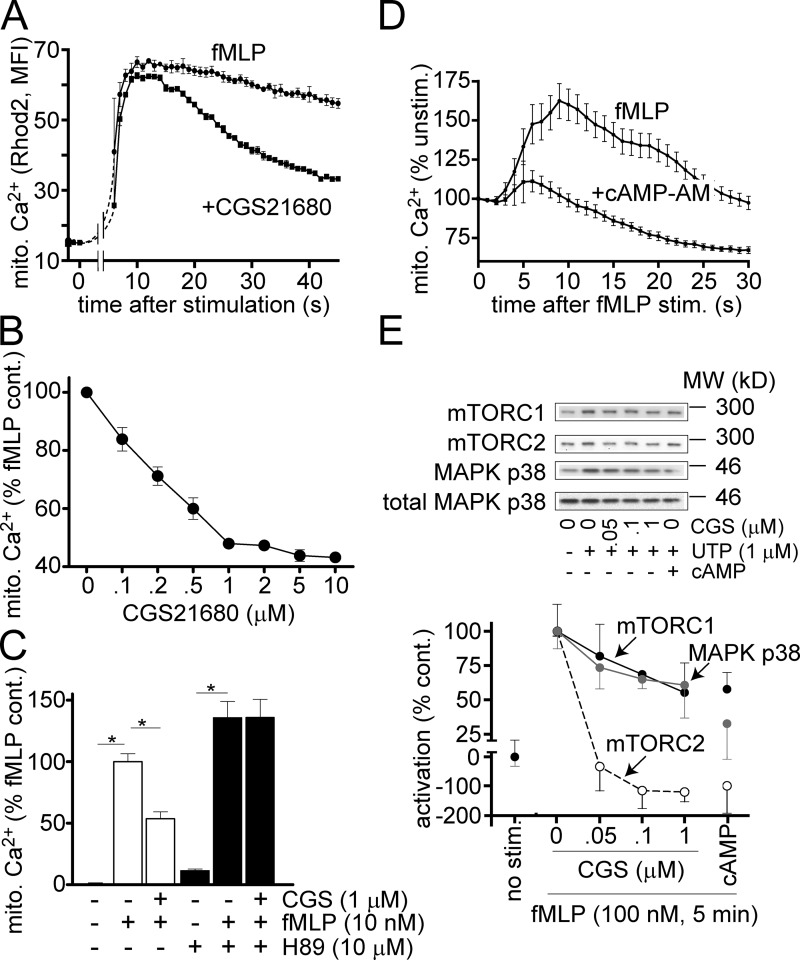
The findings above demonstrate that FPR and P2Y2 receptor–induced mTOR signaling events amplify chemotactic cues by activating mitochondria. Mitochondria in turn fuel stimulatory feedback mechanisms that provide local excitation at the front of polarized cells. Next, we wondered whether related mechanisms could provide global inhibition at the back of cells. Previous work has shown that A2a receptors translocate from the leading edge to the back during the polarization of PMNs, and that A2a receptors trigger cAMP accumulation, which facilitates uropod retraction at the back of cells (Liu et al., 2010; Bao et al., 2013). Therefore, we studied whether A2a receptors contribute to the differential regulation of mTOR and mitochondria in stimulated PMNs. We found that the A2a receptor agonist CGS21680 dose-dependently blocked mitochondrial activity of PMNs by diminishing mitochondrial Ca2+ uptake in response to FPR stimulation (Fig. 7, A and B). This inhibitory effect of A2a receptors can explain the decrease in mitochondrial activity we observed at the back during the polarization of PMNs in a chemotactic gradient field (Figs. 2 and 3). Pretreatment of PMNs with H89, an inhibitor of the cAMP-dependent PKA abolished the inhibitory effect of CGS21680 on mitochondrial Ca2+ uptake (Fig. 7 C). Conversely, the cell-permeable cAMP analogue cAMP-AM replicated the inhibitory effect of A2a receptors on mitochondria (Fig. 7 D and Video 9). Collectively, these results indicate that A2a receptors down-regulate mitochondrial activity of PMNs and that this process requires A2a receptor–mediated cAMP/PKA signaling. A2a receptor stimulation with CGS21680 completely abolished FPR-induced mTORC2 signaling and partially inhibited the activation of mTORC1 and MAPK p38 signaling (Fig. 7 E). In addition, we found that stimulation of A2a receptors reduced P2Y2-induced mTOR and MAPK signaling (Fig. S5 B). These results demonstrate that autocrine stimulation of A2a receptors blocks mTORC2 signaling and the activation of mitochondria at the back of polarized cells.
Figure 7.
A2a receptors block mTORC2 and mitochondrial activation. (A and B) Freshly isolated PMNs were loaded with Rhod2 as described in Fig. 2 and stimulated simultaneously with 10 nM fMLP and 1 µM of the A2a receptor agonist CGS21680 at t = 0 s, and mitochondrial Ca2+ uptake was assessed by flow cytometry. (B) Mitochondrial Ca2+ uptake in cells treated with the indicated concentrations of CGS21680. (C) PMNs loaded with Rhod2 were incubated with or without 10 µM H89 for 30 min and stimulated with 10 nM fMLP ± 1 µM CGS21680, and mitochondrial Ca2+ uptake was assessed with flow cytometry. (D) PMNs loaded with Rhod2 were incubated for 30 min with or without 1 µM cAMP-AM, and mitochondrial Ca2+ uptake in response to fMLP stimulation (1 nM) was monitored with fluorescence microscopy (see also Video 9). (E) Differentiated HL-60 cells were pretreated with 1 µM cAMP-AM and stimulated with 100 nM fMLP, or exposed to the indicated concentrations of CGS21680 and simultaneously stimulated with 100 nM fMLP. After 5 min, mTOR and MAPK p38 activation was determined with immunoblotting as described in Fig. 5. Results are expressed as means ± SD (error bars) of at least three independent experiments; *, P < 0.05; Student’s t test.
Defective mitochondrial activation in PMNs lacking P2Y2 or A2a receptors
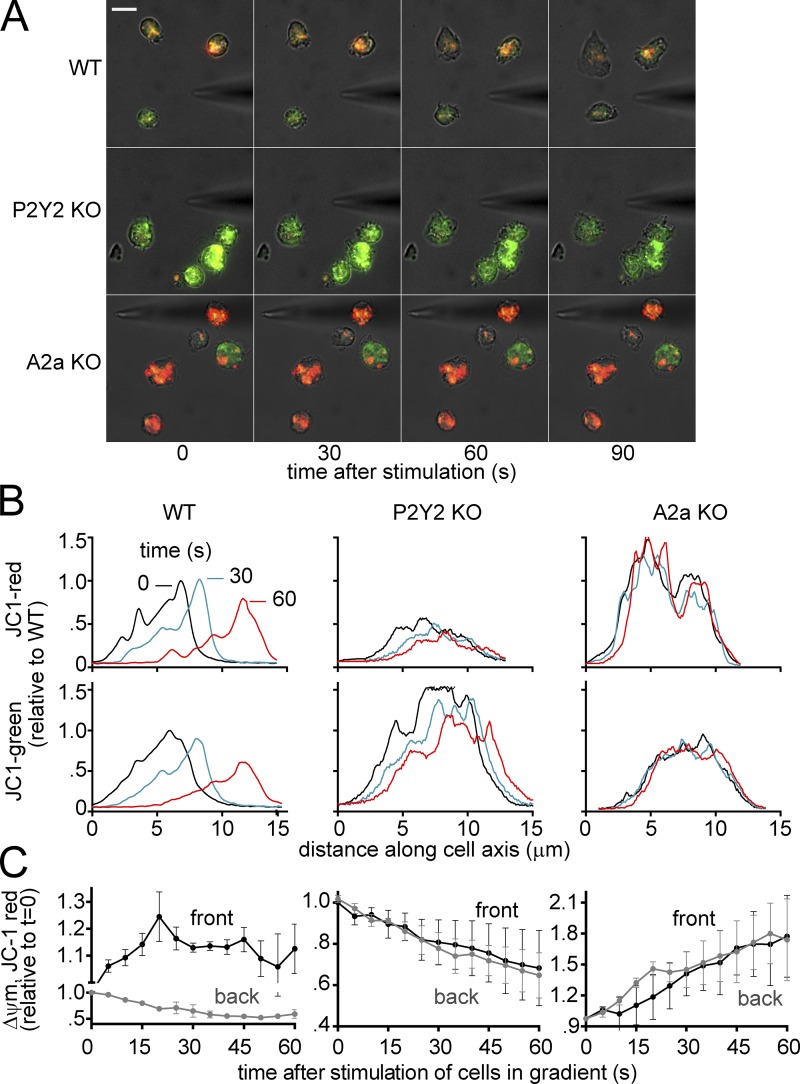
To investigate the role of purinergic signaling in the regulation of mitochondrial activity and chemotaxis, we stained PMNs from wild-type (WT) mice and P2Y2 or A2a receptor knockout (KO) mice with JC-1. PMNs from WT mice showed differential mitochondrial responses similar to those seen in human PMNs (Fig. 8 and Video 10). In cells from P2Y2 receptor KO mice, however, the Δψm was greatly reduced and chemotaxis was severely impaired. PMNs from A2a receptor KO mice showed a Δψm that was markedly higher than that of P2Y2 KO and WT mice. Stimulation of these cells in a chemotactic gradient field did not reduce the proportion of the mitochondrial mass with high membrane potential, and the ability of these cells to polarize and undergo chemotaxis was clearly impaired (Fig. 8 and Video 10). These results further support our conclusion that chemotaxis requires a LEGI mechanism that involves differential activation of mitochondria, localized ATP release, and autocrine stimulation of P2Y2 and A2a receptors at the front and back of polarized cells.
Figure 8.
Impaired neutrophil chemotaxis in P2Y2 or A2a KO mice is caused by disturbed mitochondrial distribution. Mice were injected intraperitoneally with 1 ml zymosan A solution (1 mg/ml in PBS) and sacrificed 12–15 h later. Peritoneal lavage fluid was collected in HBSS plus 0.1% BSA and cultured in fibronectin-coated dishes. (A) Cells were loaded with 200 ng/ml JC-1 for 20 min, washed with HBSS, and exposed to a chemotactic gradient using a micropipette loaded with 1 µM w-peptide (WKYMVM), and Δψm was recorded in real time by using a fluorescence microscope (DMI6000 B; Leica; objective: 100× oil, NA 1.30; DFC365 FX camera; Leica; bar, 10 µm; see also Video 10). (B and C) The distribution of JC-1 red or green signal (B) or change in JC-1 red signal at the front or back of cells over time (C) was analyzed by ImageJ software. Results are representative for experiments done with three to four mice/group (data shown are means ± SD [error bars]).
Discussion
Chemotaxis, the coordinated response of cells to chemical stimuli, is critical for many physiological processes including development, embryogenesis, angiogenesis, wound healing, and host immune defense (Devreotes and Janetopoulos, 2003). PMNs rely on chemotaxis to locate sites of infection and inflammation. Neutrophil chemotaxis comprises several separate processes: (a) gradient sensing allows cells to recognize microbial and inflammatory products through specialized receptors such as FPR; (b) cell polarization results in elongated cell shapes with defined front and back sections that align within a chemotactic gradient field; and (c) cell migration or locomotion, the actual movement of polarized cells along a chemotactic gradient field. Collectively, these processes allow PMNs to rapidly reach sites of infection. These chemotactic processes are fine-tuned by a sensory system that provides PMNs with real-time information about chemoattractant cues in their extracellular environment. Although it is widely accepted that PMNs must have such a sensory system, its molecular components are still not fully defined (Liu et al., 2010; Junger, 2011; Graziano and Weiner, 2014).
Our previous work has revealed that PMNs use purinergic signaling systems to amplify chemotactic gradient cues. These purinergic signaling systems are triggered by pannexin 1 (panx1)-mediated ATP release from the cell surface closest to the chemotactic source. The released ATP stimulates nearby P2Y2 receptors, which amplify chemotactic cues via intracellular signaling pathways that promote actin polymerization and cell polarization (Chen et al., 2010; Bao et al., 2013). During cell polarization, panx1, ectonucleotidases (e.g., CD39), and A3 receptors translocate to the leading edge, whereas A2a receptors move to the back of cells (Chen et al., 2006; Corriden et al., 2008; Junger, 2011; Bao et al., 2013). These translocation processes result in purinergic signaling systems that heighten the sensitivity of the front and lessen chemotactic responsiveness at the back of cells (Bao et al., 2013).
These opposing purinergic signaling arrangements are consistent with mathematical models proposing LEGI mechanisms at the front and back of neutrophils (Parent and Devreotes, 1999; Xu et al., 2003; Wang, 2009; Jilkine and Edelstein-Keshet, 2011; Bao et al., 2013). In a series of recent reports, mTORC2 and cAMP signaling has been shown to contribute to LEGI by regulating F-actin polarization at the front and myosin II phosphorylation and uropod retraction at the back of cells (Liu et al., 2010, 2014). These mechanisms involve PKCβII, AC9, and cAMP/PKA and are thought to be elicited by various heterotrimeric G proteins. However, the G protein–coupled receptors associated with these heterotrimeric G proteins and the upstream signaling mechanisms that initiate mTORC2 and cAMP/PKA signaling have remained unknown. Our current study sheds light on these open questions (Fig. 9). We found that FPR-induced mTORC1 signaling and mitochondrial activation are involved in PMN chemotaxis, triggering an initial burst of ATP release that promotes autocrine purinergic signaling by stimulation of P2Y2 receptors, which results in the initiation of mTORC2 signaling and enhanced mitochondrial ATP production. The latter mechanism further increases ATP release and maintains a state of sustained PMN stimulation at the front of migrating cells (Fig. 9). Concomitant cell polarization, hydrolysis of released ATP to adenosine, and stimulation of A2a receptors at the back of cells results in cAMP accumulation. This inhibitory mechanism blocks P2Y2 receptor–induced mTORC2 signaling and mitochondrial activity, and represents an inhibitory mechanism consistent with that reported to promote uropod retraction at the back of cells (Liu et al., 2010, 2014). Thus, our findings are in agreement with other reports that place mTORC2 at the center of the signaling network that regulates chemotaxis. Moreover, our study identified P2Y2 and A2a receptors as the G protein–coupled receptors to integrate mTORC2 and cAMP signaling at the front and back of cells (Fig. 9). In contrast to reports by others, we found that mTORC1 is also involved in the regulation of chemotaxis, namely by acting upstream of mTORC2 signaling (Liu et al., 2010). Differences in the fMLP concentrations used in both studies may explain this discrepancy. We used comparatively low fMLP concentrations (100 nM or less) because in our hands, higher fMLP concentrations cause degranulation of PMN and the release of ATP through mechanisms that are independent of mitochondria and thus trigger mTORC2 signaling without the need for mTORC1 activation (Bao et al., 2014).
Figure 9.
Regulation of chemotaxis by mitochondria, mTOR, and purinergic signaling. Phase 1, trigger: FPR stimulation induces mTORC1 signaling and mitochondrial activation and ATP formation. Phase 2, warm up: ATP release through panx1 triggers P2Y2 receptors that stimulate mTORC2 and enhance mitochondrial activity and ATP production. This promotes actin polymerization and pseudopod protrusion at the front of cells. Phase 3, shut-down: ATP is hydrolyzed to adenosine by ectonucleotidases (ENTPD) on the cell surface, resulting in the stimulation of A2a adenosine receptors at the back of cells. This results in cAMP accumulation and the inhibition of FPR/P2Y2-mediated mTORC signaling and mitochondrial activation, leading to uropod retraction at the back. We propose a purinergic LEGI model, with phases 1 and 2 representing local excitation and phase 3 representing global inhibition.
ATP is widely known for its function as energy carrier that fuels most cellular processes, whereas the role of ATP as an intercellular messenger and autocrine regulator of cell functions is less well characterized (Ralevic and Burnstock, 1998; Burnstock, 2007; Burnstock et al., 2010; Junger, 2011). We have recently been able to show that mitochondria generate the ATP that is required for FPR-induced PMN activation (Bao et al., 2014). In the current study, we demonstrate that differential activation of mitochondria within polarized cells serves to fine-tune local ATP release and activation processes involved in PMN chemotaxis. Thus, mitochondria have a key role in host defense by guiding PMNs to sites of infection. Consequently, conditions that impair mitochondrial function should weaken host defense, a notion that is supported by studies that have demonstrated an increased risk of sepsis in patients with hypoxia and mitochondrial dysfunction (van den Berghe et al., 2001; Kozlov et al., 2011; Asfar et al., 2012; Waisman et al., 2012). Mitochondria generate ATP by oxidative phosphorylation, which requires an energy source and O2 as electron acceptor. Thus, it is likely that hypoxic conditions impair PMN chemotaxis by disrupting mitochondrial function, resulting in increased morbidity and mortality in critical care patients (van den Berghe et al., 2001).
Several studies have shown that mTOR signaling can directly regulate mitochondrial function (Desai et al., 2002; Ramanathan and Schreiber, 2009; Liu et al., 2010, 2014). In agreement with those reports, we found that FPR stimulation triggers mTORC1 signaling, which is followed by mTORC2 and cAMP signaling that differentially regulate mitochondrial activity in polarized cells. These findings suggest that mTOR and associated signaling events are potential novel therapeutic targets to modulate chemotaxis of PMNs in inflammatory diseases. Recent studies of mTOR inhibitors in mouse models of acute lung injury and metastasis support this notion (Lorne et al., 2009; Dillenburg-Pilla et al., 2015).
Materials and methods
Human PMN isolation
The institutional review board of the Beth Israel Deaconess Medical Center approved all studies involving human subjects. PMNs were isolated from the peripheral blood of healthy volunteers as described previously, using dextran sedimentation followed by Percoll gradient centrifugation (Chen et al., 2006, 2010; Bao et al., 2013, 2014). In brief, 10 ml of heparinized blood was mixed with 3 ml of a 5% (wt/vol) Dextran 500 (Pharmacosmos) solution in infusion-grade normal saline (Baxter). White blood cells enriched in the supernatants were washed with HBSS containing Ca2+ and Mg2+, and PMNs were separated by Percoll density gradient centrifugation using 55 and 73% (vol/vol) sterile and pyrogen-free Percoll solutions (GE Healthcare) in normal saline. Purified PMNs were washed twice and suspended in HBSS with Ca2+ and Mg2+ until further use for ∼6 h. All reagents and supplies were strictly pyrogen-free, and osmotic or excessive mechanical stimulation was carefully avoided.
PMN isolation from mice
All animal experiments were approved by the Institutional Animal Care and Use Committee of the Beth Israel Deaconess Medical Center and performed according to the guidelines of the National Institutes of Health (NIH). C57BL/6 WT mice were obtained from Charles River. P2Y2 receptor KO mice were provided by R. Boucher (University of North Carolina, Chapel Hill, NC), and A2a receptor KO mice were provided by J.-F. Chen (Boston University, Boston, MA) and maintained in our laboratory. Mice were injected intraperitoneally with 1 ml of zymosan A solution (1 mg/ml in PBS; Sigma-Aldrich). Mice were sacrificed 12–15 h later, and peritoneal lavage fluid was collected in HBSS containing 0.1% bovine serum albumin.
Cell culture
HL-60 cells were maintained as described previously (Bao et al., 2014). To obtain cells with a PMN-like phenotype, HL-60 cells were differentiated by treatment with 1.3% DMSO for 3 d. Cells were washed, and all chemotaxis and cellular signaling events were studied with differentiated HL-60 cells.
Chemotaxis assays
Chemotaxis was assessed using a live-cell imaging system described previously (Chen et al., 2006; Bao et al., 2013). In brief, freshly isolated human PMNs (2 × 10⁶/ml in HBSS) were plated onto 25-mm glass coverslips (Thermo Fisher Scientific) coated with 40 µg/ml human fibronectin and placed into a temperature-controlled stage incubator (Harvard Apparatus) at 37°C. Cells were treated with or without reagents as described in each individual experiment and exposed to a chemoattractant gradient field generated with a micropipette loaded with 100 nM fMLP, 10 µg/ml IL-8, or 1 µM LTB4. The tip of the micropipette was placed in the proximity of cells to be studied, and cell migration was tracked by time-lapse microscopy with a DMI6000 B microscope (Leica) equipped with a Spot Boost EMCCD camera (Diagnostic Instruments Inc.) or a DFC365 FX camera (Leica) using 20 sequential images at 20-s intervals (20×, air, NA 0.40; three frames min−1). Imaging was done using IP Lab imaging software (BD) or LAS AF software (Leica). From these images, the migration paths of individual cells toward the point source of fMLP were calculated using ImageJ software (NIH). Each trace shown in the associated figures corresponds to the path of a single cell, with the origin of each path assigned the coordinate x = y = 0 µm, and the location of the tip of the micropipette assigned the coordinate x = 0 µm, y = 200 µm. The total length each cell traveled over the observation period was used to calculate migration speed. Cells were considered to migrate in the correct direction when their migration paths did not deviate by more than 60° from a straight line toward the micropipette tip. The effective migration speed was calculated from the Euclidean distance each cell traveled.
Mitochondrial Ca2+ uptake and Δψm
The fluorescent indicator Rhod2 (Molecular Probes) was used to measure mitochondrial Ca2+ influx, and JC-1 (Molecular Probes) was used to monitor Δψm during cell stimulation and migration. Fluo4 (Molecular Probes) was used as an indicator for Ca2+ influx into the cytosol. MitoTracker green (Molecular Probes) was used as a dye to stain the total mitochondrial content of cells. Freshly isolated human PMNs or differentiated HL-60 cells (2 × 10⁶/ml in HBSS) were placed into 25-mm glass-bottom dishes as described above and kept at 37°C using a stage incubator. Then Rhod2, Fluo4, JC-1, or MitoTracker green was added at a final concentration of 1 µM for 5 min, 5 µM for 20 min, 100 ng/ml for 20 min, or 100 nM for 20 min, respectively. Next, cells were stimulated by global addition of 1 nM fMLP or by applying an fMLP gradient using the micropipette method described above. Fluorescence changes were recorded using a microscope (DMI6000 B; Leica) equipped with a CARV II confocal unit (BD) and BrightLine filter sets FF593 and FF495 from Semrock for imaging of Texas red (for JC-1 red or Rhod2) and EGFP (for JC-1 green, Fluo4 or MitoTracker green) or FITC and TRITC filter sets (Leica), by using a 100× objective lens (oil, NA 1.30) and a Spot Boost EMCCD camera (Diagnostic Instruments Inc.) or a DFC365 FX camera (Leica). The acquisition was done with IP Lab imaging software (BD) or acquisition software (LAS AF; Leica). Image analysis was done with ImageJ software. In some experiments, PMNs were loaded with 1 µM Rhod2 for 5 min, and Rhod2 fluorescence signal changes were monitored with flow cytometry after cell stimulation.
Measurement of ATP release
Freshly isolated PMNs (4 × 10⁶/ml) were treated for 30 min with 1 µM rapamycin or 1 µM PP242, stimulated with 10 nM fMLP for 15 s, placed on ice to stop reactions, and centrifuged for 5 min at 325 g and 0°C. The supernatants were collected and the amount of ATP released was determined using a commercially available luciferase assay kit (Invitrogen).
Measurement of mTOR and MAPK p38 phosphorylation
MAPK p38 and mTORC1 and mTORC2 activation was assessed by immunoblotting with phosphospecific antibodies that recognize the phosphorylated and thus activated forms of MAPK p38 (T180/Y182) and mTOR (S2448, as an indicator of mTORC1, and S2481, as an indicator of mTORC2) using reagents from Cell Signaling Technology. Total MAPK p38 antibodies (Santa Cruz Biotechnology, Inc.) were used as a loading control. All antibodies used were raised in rabbit to human antigens.
Statistical analyses
Data are shown as means ± SD unless otherwise stated. Statistical analyses were done with Student’s t test or one-way ANOVA, followed by Newman–Keuls test, and differences were considered significant at P < 0.05.
Online supplemental material
Fig. S1 and Videos 1 and 2 show that mitochondria are required for chemotaxis in response to FPR, IL-8, and LTB4. Fig. S2 (A–C) and Video 3 show that mitochondrial calcium influx is increased at the front and decreased at the back of polarized neutrophils. Fig. S2 D and Video 4 show that mitochondria at the front have a high membrane potential, whereas the membrane potential of mitochondria decreases at the back. Fig. S3 and Video 5 show that inhibition of mTOR reduces neutrophil chemotaxis in response to fMLP and IL-8. Fig. S4 and Videos 6–9 demonstrate links between mTOR signaling, mitochondrial activity, and purinergic signaling. Fig. S5 shows that P2Y2 and A2a receptor signaling is linked to mTOR activation. Video 10 demonstrates that P2Y2 or A2a receptor signaling regulates mitochondrial activity and neutrophil chemotaxis. The online supplemental material is available at http://www.jcb.org/cgi/content/full/jcb.201503066/DC1.
Supplementary Material
Acknowledgments
We thank R. Boucher (University of North Carolina, Chapel Hill, NC) and J.-F. Chen (Boston University, Boston, MA) for kindly providing P2Y2 and A2A receptor KO mice, respectively.
This study was supported in part by National Institutes of Health grants GM51477, GM60475, AI080582, and GM103702, and Deutsche Forschungsgemeinschaft grant LE-3209/1-1.
The authors declare no competing financial interests.
Footnotes
Abbreviations used in this paper:
- AC9
- adenylyl cyclase 9
- CCCP
- carbonyl cyanide m-chlorophenyl hydrazone
- Δψm
- mitochondrial membrane potential
- FPR
- formyl peptide receptor
- IL-8
- interleukin-8
- KO
- knockout
- LEGI
- local excitation and global inhibition
- LTB4
- leukotriene B4
- mTORC2
- mTOR complex 2
- panx1
- pannexin 1
- PKA
- protein kinase A
- PMN
- polymorphonuclear neutrophil
- WT
- wild type
References
- Asfar P., Calzia E., Huber-Lang M., Ignatius A., and Radermacher P.. 2012. Hyperoxia during septic shock—Dr. Jekyll or Mr. Hyde? Shock. 37:122–123. 10.1097/SHK.0b013e318238c991 [DOI] [PubMed] [Google Scholar]
- Bao Y., Chen Y., Ledderose C., Li L., and Junger W.G.. 2013. Pannexin 1 channels link chemoattractant receptor signaling to local excitation and global inhibition responses at the front and back of polarized neutrophils. J. Biol. Chem. 288:22650–22657. 10.1074/jbc.M113.476283 [DOI] [PMC free article] [PubMed] [Google Scholar]
- Bao Y., Ledderose C., Seier T., Graf A.F., Brix B., Chong E., and Junger W.G.. 2014. Mitochondria regulate neutrophil activation by generating ATP for autocrine purinergic signaling. J. Biol. Chem. 289:26794–26803. 10.1074/jbc.M114.572495 [DOI] [PMC free article] [PubMed] [Google Scholar]
- Brookes P.S., Yoon Y., Robotham J.L., Anders M.W., and Sheu S.S.. 2004. Calcium, ATP, and ROS: a mitochondrial love-hate triangle. Am. J. Physiol. Cell Physiol. 287:C817–C833. 10.1152/ajpcell.00139.2004 [DOI] [PubMed] [Google Scholar]
- Burnstock G. 2007. Purine and pyrimidine receptors. Cell. Mol. Life Sci. 64:1471–1483. 10.1007/s00018-007-6497-0 [DOI] [PMC free article] [PubMed] [Google Scholar]
- Burnstock G., Fredholm B.B., North R.A., and Verkhratsky A.. 2010. The birth and postnatal development of purinergic signalling. Acta Physiol. (Oxf.). 199:93–147. 10.1111/j.1748-1716.2010.02114.x [DOI] [PubMed] [Google Scholar]
- Chen Y., Corriden R., Inoue Y., Yip L., Hashiguchi N., Zinkernagel A., Nizet V., Insel P.A., and Junger W.G.. 2006. ATP release guides neutrophil chemotaxis via P2Y2 and A3 receptors. Science. 314:1792–1795. 10.1126/science.1132559 [DOI] [PubMed] [Google Scholar]
- Chen Y., Yao Y., Sumi Y., Li A., To U.K., Elkhal A., Inoue Y., Woehrle T., Zhang Q., Hauser C., and Junger W.G.. 2010. Purinergic signaling: A fundamental mechanism in neutrophil activation. Sci. Signal. 3:ra45 10.1126/scisignal.2000549 [DOI] [PMC free article] [PubMed] [Google Scholar]
- Colombi M., Molle K.D., Benjamin D., Rattenbacher-Kiser K., Schaefer C., Betz C., Thiemeyer A., Regenass U., Hall M.N., and Moroni C.. 2011. Genome-wide shRNA screen reveals increased mitochondrial dependence upon mTORC2 addiction. Oncogene. 30:1551–1565. 10.1038/onc.2010.539 [DOI] [PubMed] [Google Scholar]
- Copp J., Manning G., and Hunter T.. 2009. TORC-specific phosphorylation of mammalian target of rapamycin (mTOR): Phospho-Ser2481 is a marker for intact mTOR signaling complex 2. Cancer Res. 69:1821–1827. 10.1158/0008-5472.CAN-08-3014 [DOI] [PMC free article] [PubMed] [Google Scholar]
- Corriden R., Chen Y., Inoue Y., Beldi G., Robson S.C., Insel P.A., and Junger W.G.. 2008. Ecto-nucleoside triphosphate diphosphohydrolase 1 (E-NTPDase1/CD39) regulates neutrophil chemotaxis by hydrolyzing released ATP to adenosine. J. Biol. Chem. 283:28480–28486. 10.1074/jbc.M800039200 [DOI] [PMC free article] [PubMed] [Google Scholar]
- Delgado-Martín C., Escribano C., Pablos J.L., Riol-Blanco L., and Rodríguez-Fernández J.L.. 2011. Chemokine CXCL12 uses CXCR4 and a signaling core formed by bifunctional Akt, extracellular signal-regulated kinase (ERK)1/2, and mammalian target of rapamycin complex 1 (mTORC1) proteins to control chemotaxis and survival simultaneously in mature dendritic cells. J. Biol. Chem. 286:37222–37236. 10.1074/jbc.M111.294116 [DOI] [PMC free article] [PubMed] [Google Scholar]
- Desai B.N., Myers B.R., and Schreiber S.L.. 2002. FKBP12-rapamycin-associated protein associates with mitochondria and senses osmotic stress via mitochondrial dysfunction. Proc. Natl. Acad. Sci. USA. 99:4319–4324. 10.1073/pnas.261702698 [DOI] [PMC free article] [PubMed] [Google Scholar]
- Devreotes P., and Janetopoulos C.. 2003. Eukaryotic chemotaxis: Distinctions between directional sensing and polarization. J. Biol. Chem. 278:20445–20448. 10.1074/jbc.R300010200 [DOI] [PubMed] [Google Scholar]
- Dillenburg-Pilla P., Patel V., Mikelis C.M., Zárate-Bladés C.R., Doçi C.L., Amornphimoltham P., Wang Z., Martin D., Leelahavanichkul K., Dorsam R.T., et al. 2015. SDF-1/CXCL12 induces directional cell migration and spontaneous metastasis via a CXCR4/Gαi/mTORC1 axis. FASEB J. 29:1056–1068. 10.1096/fj.14-260083 [DOI] [PMC free article] [PubMed] [Google Scholar]
- Graziano B.R., and Weiner O.D.. 2014. Self-organization of protrusions and polarity during eukaryotic chemotaxis. Curr. Opin. Cell Biol. 30:60–67. 10.1016/j.ceb.2014.06.007 [DOI] [PMC free article] [PubMed] [Google Scholar]
- Hagiwara A., Cornu M., Cybulski N., Polak P., Betz C., Trapani F., Terracciano L., Heim M.H., Rüegg M.A., and Hall M.N.. 2012. Hepatic mTORC2 activates glycolysis and lipogenesis through Akt, glucokinase, and SREBP1c. Cell Metab. 15:725–738. 10.1016/j.cmet.2012.03.015 [DOI] [PubMed] [Google Scholar]
- Houk A.R., Jilkine A., Mejean C.O., Boltyanskiy R., Dufresne E.R., Angenent S.B., Altschuler S.J., Wu L.F., and Weiner O.D.. 2012. Membrane tension maintains cell polarity by confining signals to the leading edge during neutrophil migration. Cell. 148:175–188. 10.1016/j.cell.2011.10.050 [DOI] [PMC free article] [PubMed] [Google Scholar]
- Jilkine A., and Edelstein-Keshet L.. 2011. A comparison of mathematical models for polarization of single eukaryotic cells in response to guided cues. PLOS Comput. Biol. 7:e1001121 10.1371/journal.pcbi.1001121 [DOI] [PMC free article] [PubMed] [Google Scholar]
- Junger W.G. 2011. Immune cell regulation by autocrine purinergic signalling. Nat. Rev. Immunol. 11:201–212. 10.1038/nri2938 [DOI] [PMC free article] [PubMed] [Google Scholar]
- Keil V.C., Funke F., Zeug A., Schild D., and Müller M.. 2011. Ratiometric high-resolution imaging of JC-1 fluorescence reveals the subcellular heterogeneity of astrocytic mitochondria. Pflugers Arch. 462:693–708. 10.1007/s00424-011-1012-8 [DOI] [PMC free article] [PubMed] [Google Scholar]
- Kozlov A.V., Bahrami S., Calzia E., Dungel P., Gille L., Kuznetsov A.V., and Troppmair J.. 2011. Mitochondrial dysfunction and biogenesis: do ICU patients die from mitochondrial failure? Ann Intensive Care. 1:41 10.1186/2110-5820-1-41 [DOI] [PMC free article] [PubMed] [Google Scholar]
- Ku C.J., Wang Y., Weiner O.D., Altschuler S.J., and Wu L.F.. 2012. Network crosstalk dynamically changes during neutrophil polarization. Cell. 149:1073–1083. 10.1016/j.cell.2012.03.044 [DOI] [PMC free article] [PubMed] [Google Scholar]
- Levchenko A., and Iglesias P.A.. 2002. Models of eukaryotic gradient sensing: Application to chemotaxis of amoebae and neutrophils. Biophys. J. 82:50–63. 10.1016/S0006-3495(02)75373-3 [DOI] [PMC free article] [PubMed] [Google Scholar]
- Liu L., Das S., Losert W., and Parent C.A.. 2010. mTORC2 regulates neutrophil chemotaxis in a cAMP- and RhoA-dependent fashion. Dev. Cell. 19:845–857. 10.1016/j.devcel.2010.11.004 [DOI] [PMC free article] [PubMed] [Google Scholar]
- Liu Q., Kirubakaran S., Hur W., Niepel M., Westover K., Thoreen C.C., Wang J., Ni J., Patricelli M.P., Vogel K., et al. 2012. Kinome-wide selectivity profiling of ATP-competitive mammalian target of rapamycin (mTOR) inhibitors and characterization of their binding kinetics. J. Biol. Chem. 287:9742–9752. 10.1074/jbc.M111.304485 [DOI] [PMC free article] [PubMed] [Google Scholar]
- Liu L., Gritz D., and Parent C.A.. 2014. PKCβII acts downstream of chemoattractant receptors and mTORC2 to regulate cAMP production and myosin II activity in neutrophils. Mol. Biol. Cell. 25:1446–1457. 10.1091/mbc.E14-01-0037 [DOI] [PMC free article] [PubMed] [Google Scholar]
- Lorne E., Zhao X., Zmijewski J.W., Liu G., Park Y.J., Tsuruta Y., and Abraham E.. 2009. Participation of mammalian target of rapamycin complex 1 in Toll-like receptor 2- and 4-induced neutrophil activation and acute lung injury. Am. J. Respir. Cell Mol. Biol. 41:237–245. 10.1165/rcmb.2008-0290OC [DOI] [PMC free article] [PubMed] [Google Scholar]
- Murata H., Sakaguchi M., Jin Y., Sakaguchi Y., Futami J., Yamada H., Kataoka K., and Huh N.H.. 2011. A new cytosolic pathway from a Parkinson disease-associated kinase, BRPK/PINK1: Activation of AKT via mTORC2. J. Biol. Chem. 286:7182–7189. 10.1074/jbc.M110.179390 [DOI] [PMC free article] [PubMed] [Google Scholar]
- Parent C.A., and Devreotes P.N.. 1999. A cell’s sense of direction. Science. 284:765–770. 10.1126/science.284.5415.765 [DOI] [PubMed] [Google Scholar]
- Ralevic V., and Burnstock G.. 1998. Receptors for purines and pyrimidines. Pharmacol. Rev. 50:413–492. [PubMed] [Google Scholar]
- Ramanathan A., and Schreiber S.L.. 2009. Direct control of mitochondrial function by mTOR. Proc. Natl. Acad. Sci. USA. 106:22229–22232. 10.1073/pnas.0912074106 [DOI] [PMC free article] [PubMed] [Google Scholar]
- Reers M., Smiley S.T., Mottola-Hartshorn C., Chen A., Lin M., and Chen L.B.. 1995. Mitochondrial membrane potential monitored by JC-1 dye. Methods Enzymol. 260:406–417. 10.1016/0076-6879(95)60154-6 [DOI] [PubMed] [Google Scholar]
- van den Berghe G., Wouters P., Weekers F., Verwaest C., Bruyninckx F., Schetz M., Vlasselaers D., Ferdinande P., Lauwers P., and Bouillon R.. 2001. Intensive insulin therapy in critically ill patients. N. Engl. J. Med. 345:1359–1367. 10.1056/NEJMoa011300 [DOI] [PubMed] [Google Scholar]
- Waisman D., Brod V., Rahat M.A., Amit-Cohen B.C., Lahat N., Rimar D., Menn-Josephy H., David M., Lavon O., Cavari Y., and Bitterman H.. 2012. Dose-related effects of hyperoxia on the lung inflammatory response in septic rats. Shock. 37:95–102. 10.1097/SHK.0b013e3182356fc3 [DOI] [PubMed] [Google Scholar]
- Wang F. 2009. The signaling mechanisms underlying cell polarity and chemotaxis. Cold Spring Harb. Perspect. Biol. 1:a002980 10.1101/cshperspect.a002980 [DOI] [PMC free article] [PubMed] [Google Scholar]
- Wang Y., Weiss L.M., and Orlofsky A.. 2010. Coordinate control of host centrosome position, organelle distribution, and migratory response by Toxoplasma gondii via host mTORC2. J. Biol. Chem. 285:15611–15618. 10.1074/jbc.M109.095778 [DOI] [PMC free article] [PubMed] [Google Scholar]
- Wu Z., Sawada T., Shiba K., Liu S., Kanao T., Takahashi R., Hattori N., Imai Y., and Lu B.. 2013. Tricornered/NDR kinase signaling mediates PINK1-directed mitochondrial quality control and tissue maintenance. Genes Dev. 27:157–162. 10.1101/gad.203406.112 [DOI] [PMC free article] [PubMed] [Google Scholar]
- Xu J., Wang F., Van Keymeulen A., Herzmark P., Straight A., Kelly K., Takuwa Y., Sugimoto N., Mitchison T., and Bourne H.R.. 2003. Divergent signals and cytoskeletal assemblies regulate self-organizing polarity in neutrophils. Cell. 114:201–214. 10.1016/S0092-8674(03)00555-5 [DOI] [PubMed] [Google Scholar]
- Yuan M., Pino E., Wu L., Kacergis M., and Soukas A.A.. 2012. Identification of Akt-independent regulation of hepatic lipogenesis by mammalian target of rapamycin (mTOR) complex 2. J. Biol. Chem. 287:29579–29588. 10.1074/jbc.M112.386854 [DOI] [PMC free article] [PubMed] [Google Scholar]
Associated Data
This section collects any data citations, data availability statements, or supplementary materials included in this article.


