

Significance
We have derived a new technology for the detection of genes within undisturbed nuclei of fixed cells and tissues. Previous approaches have used fluorescent DNA probes to hybridize to genes of interest, requiring treatment of heat and disruptive chemicals that distort the natural organization of the nucleus. Instead, we have used a bacterial protein, CRISPR (clustered regularly interspaced short palindromic repeats), combined with an RNA sequence as probes to find the genes of interest in the intact genome. This approach preserves the spatial relationships of the genetic elements, which are important for understanding gene expression, and the process is remarkably rapid (15 min), convenient, and can be used directly on tissues for diagnosis of disease.
Keywords: Cas9, FISH, genome organization, CRISPR, Halo
Abstract
Direct visualization of genomic loci in the 3D nucleus is important for understanding the spatial organization of the genome and its association with gene expression. Various DNA FISH methods have been developed in the past decades, all involving denaturing dsDNA and hybridizing fluorescent nucleic acid probes. Here we report a novel approach that uses in vitro constituted nuclease-deficient clustered regularly interspaced short palindromic repeats (CRISPR)/CRISPR-associated caspase 9 (Cas9) complexes as probes to label sequence-specific genomic loci fluorescently without global DNA denaturation (Cas9-mediated fluorescence in situ hybridization, CASFISH). Using fluorescently labeled nuclease-deficient Cas9 (dCas9) protein assembled with various single-guide RNA (sgRNA), we demonstrated rapid and robust labeling of repetitive DNA elements in pericentromere, centromere, G-rich telomere, and coding gene loci. Assembling dCas9 with an array of sgRNAs tiling arbitrary target loci, we were able to visualize nonrepetitive genomic sequences. The dCas9/sgRNA binary complex is stable and binds its target DNA with high affinity, allowing sequential or simultaneous probing of multiple targets. CASFISH assays using differently colored dCas9/sgRNA complexes allow multicolor labeling of target loci in cells. In addition, the CASFISH assay is remarkably rapid under optimal conditions and is applicable for detection in primary tissue sections. This rapid, robust, less disruptive, and cost-effective technology adds a valuable tool for basic research and genetic diagnosis.
In cells, genomic DNA is highly folded and organized in three dimensions. The spatial organization of chromatin in the nucleus and the relative positions of distinct chromatin regions are tightly associated with gene regulation in normal development and disease (1). DNA FISH has been widely used to visualize sequence-specific chromatin domains or genes for research and diagnostic purposes (2). Despite continuous improvements, DNA FISH requires harsh treatments of heat and formamide to denature dsDNA to allow probe hybridization, thus running the risk of affecting the integrity of the biological structure and genome organization. DNA FISH also is limited in detection resolution with BAC probes and by the high cost of oligo probes (3). Thus there is an opportunity to develop simpler, more efficient and robust in situ imaging of cellular DNA.
The type II clustered regularly interspaced short palindromic repeats (CRISPR)-CRISPR-associated caspase 9 (Cas9) system derived from Streptococcus pyogenes has become a revolutionary tool for targeted genome editing (4), and its nuclease-deficient derivatives (dCas9) also are used for control of gene expression (5) and visualization of genomic loci in live cells (6–8) through fusion with a transcription-regulation domain or a fluorescent protein, respectively. Inherent multiplexing features offered by the CRISPR system hold great promise for applications in high-throughput assays. However, expanding its use in studying the spatial dynamics of any given genomic loci remains challenging because of the need for multicolored labels and efficient transduction of tens to hundreds of single-guide RNAs (sgRNAs) (6). In vitro studies of the CRISPR system indicated that Cas9/sgRNA had a strong and stable affinity for its target DNA (9). We hypothesized that the dCas9/sgRNA binary complex could be repurposed as a highly specific and efficient enzymatic probe for labeling DNA without global DNA denaturation, which is generated by heat or chemical treatments in DNA FISH protocols (Fig. 1A). Here we report the method exploiting the CRISPR/Cas9 system for DNA FISH studies allowing multicolored and expansive labeling of genomic DNA sequences in cells and tissues.
Fig. 1.

In vitro assembled dCas9/sgRNA fluorescently labels genomic DNA in cells. (A) Schematic of the CASFISH strategy. (B, Upper) Relative positions of indicated DNA elements on a murine chromosome. (B, Lower) sgRNA sequences as indicated. (C) CASFISH against pericentromeres in MEFs using the indicated fluorescent dCas9/sgMajSat probe assembled in vitro. dCas9 was labeled by JF646, and sgMajSat was labeled with DY547. Fluorescent images were taken with indicated filter settings and are pseudocolored for visualization purposes. (D, Left) CASFISH against telomeres in MEFs using the indicated fluorescent dCas9/sgTelomere complex. (D, Right) Histogram of the number of detected telomeres per cell; n = 134 cells. (E) CASFISH in MEF cells against minor satellite elements in centromeres. Maximum projection of z-stacks is shown. (Scale bars, 5 μM.)
Results
To produce fluorescently labeled dCas9 protein, we constructed a dCas9 fusion protein that contains a hexahistidine affinity tag at the N terminus and a Halo tag at the C terminus. The Halo tag can be labeled efficiently and covalently by Halo ligands conjugated to a variety of organic fluorescent dyes for different imaging purposes (10). We purified recombinant dCas9 fusion protein expressed in Escherichia coli and labeled the protein with Halo ligands conjugated with Janelia Fluor 646 (JF646) (11). (All fluorochromes are listed in Table S1.) We first chose to test our strategy on the highly repetitive major satellite (MajSat) sequences at murine pericentromeric regions (12) and thus generated a 5′-DY547 (Cy3 alternative)-labeled sgRNA (sgMajSat) (Fig. 1B). Equal molar amounts of purified JF646-dCas9 and DY547-sgMajSat were incubated together to form the dCas9/sgMajSat complex and then were applied to mouse embryonic fibroblasts (MEFs) that were fixed with methanol/acetic acid solution. Within 30 min of incubation, dCas9/sgMajSat probes effectively hybridized to the target satellite DNA in pericentromeres (Fig. 1C). Images from the DY547 channel that detects sgMajSat, the JF646 channel that detects dCas9 protein, and the DAPI channel generated a colocalized pattern of the pericentromeres in nuclei. Pericentromeres were of various sizes and numbers, as observed in live MEF cells coexpressing dCas9-halo and sgMajSat (Fig. S1A). Staining of pericentromeres by the fluorescent dCas9/sgMajSat complex was verified further by dCas9 staining with an independent sgRNA (sgMajSat-2) targeting the other strand of the major satellite sequence (Fig. S1B) and by its colocalization with heterochromatin protein 1 alpha (HP1α) immunofluorescence staining (Fig. S1C). In contrast, JF646-dCas9 alone or incubated with the backbone hairpin portion of sgMajSat lacking a target complementary sequence failed to generate any specific staining (Fig. S1D), indicating that dCas9/sgMajSat-mediated staining of pericentromeres was sequence-specific. DY547-sgMajSat alone did not hybridize with the target major satellite DNA, suggesting that the target DNA was not denatured during the Cas9-mediated FISH (CASFISH) procedure and that the observed signal was not caused simply by RNA–DNA hybridization independent of dCas9 (Fig. S1D). To demonstrate dCas9-mediated fluorescent staining with an independent labeling method, we engineered a genetically encoded aldehyde tag to the N terminus of dCas9 protein and labeled the aldehyde-tagged dCas9 with Cy5 hydrazide (Cy5HZ) (13). The Cy5-labeled dCas9 protein assembled with DY547-sgMajSat generated the same specific staining of pericentromeres as JF646-labeled dCas9 protein (Fig. S2). In summary, these results demonstrated that in vitro assembled fluorescent dCas9/sgRNA complex could label its genomic DNA target sequences in cells effectively and specifically. We therefore named the method “CRISPR/Cas9-mediated FISH,” CASFISH.
Table S1.
Spectral properties of fluorochromes
| Fluorochrome | Absorption maximum, nm | Emission maximum, nm | Emission color |
| Alexa 488 | 495 | 519 | Green |
| DY547 | 557 | 574 | Orange |
| Cy5 | 650 | 670 | Red |
| JF549 | 549 | 571 | Orange |
| JF646 | 646 | 664 | Red |
Fig. S1.

(A) Live-cell imaging of pericentromeres in MEFs expressing dCas9-Halo and sgMajSat. (B) sgMajSat-2 sequence and CASFISH against sgMajSat-2 in MEFs. (C) Anti-HP1α immunofluorescence staining in pericentromeres costained with sgMajSat CASFISH. (D) CASFISH controls using the indicated reagents demonstrated that detection of pericentromeres requires the complex formed by dCas9 protein and the full-length sgRNA. Maximum projection of z-stacks is shown. (Scale bars, 5 μM.)
Fig. S2.

CASFISH using Cy5-labeled dCas9 protein. (A) DY547-labeled full-length sgMajSat detected pericentromeres. (B) The indicated truncated forms of unlabeled sgRNA or absence of sgRNA failed to detect the pericentromeres. Maximum projection of z-stacks is shown. (Scale bars, 5 μM.)
The synthesis of fluorochrome-conjugated sgRNA probes (∼110 nt) is costly, whereas labeling of the Halo tag is efficient and cost-effective; thus we developed a strategy of assembling fluorescent dCas9-Halo and unlabeled sgRNA for CASFISH. Specifically, we labeled dCas9-Halo protein through Halo ligands providing flexibility in the choice of fluorochromes and used T7 polymerase to synthesize sgRNA in vitro, a solution combining low cost and scalability for multiplexing. dCas9-Halo proteins labeled with both tested fluorochromes [JF549 and JF646 (11)] retained their activity, as demonstrated by successful CASFISH imaging and specific binding to target DNA in vitro (see below). Assembling labeled dCas9-Halo with T7-synthesized sgRNA, we successfully stained various DNA targets including telomeres, minor satellites, and a gene array containing repeated MS2-binding sequences (Fig. 1 D and E and Fig. S3A). The number of detected telomeres was in agreement with the number of chromosomes in MEF cells by cytogenetic analysis (Fig. 1D and Fig. S3 B and C). Telomere sequences are G-rich and have a higher melting temperature than regular genomic DNA. Although conventional DNA FISH of telomeres requires peptide nucleic acid probes for hybridization (14), the CASFISH probe detected telomeres effectively with unmodified sgRNA, indicating CASFISH’s superiority to DNA FISH in detecting G-rich sequences. Thus, we established a cost-effective and convenient pipeline for synthesizing fluorescent CASFISH probes for customized sequences.
Fig. S3.

(A) CASFISH against MS2-binding sites (MBS) in a U2OS cell line that contains a repetitive MBS array (22). All examined cells were labeled as shown in the representative views. Maximum projection of z-stacks is indicated by scale bars. (B) A representative cytogenetic analysis performed on G-banded metaphase of the MEF cell line used in this study. (C) Composite metaphase karyotypes of 10 MEF cells. The MEF cell line has a variable chromosome composition among cells with an average of 94.5.
Simultaneous imaging of multiple chromatin domains or genes is critical for studying chromatin interactions. To explore the possibility of using CASFISH to detect multiple DNA targets simultaneously, we first investigated the binding of CASFISH probes to target DNA by electrophoretic mobility shift assays (EMSA). Using fluorescently labeled dCas9 protein, sgMajSat, and its target DNA, we found that dCas9 protein formed a binary complex with sgMajSat and a tertiary complex upon the addition of target DNA. These two complexes migrated on the gel as distinct bands away from free dCas9, free sgMajSat, or free target DNA (Fig. S4A). As expected, dCas9 showed no detectable interaction with target DNA in the absence of sgMajSat. To examine the stability of dCas9/sgMajSat binding to its target DNA, we carried out competition assays by adding excessive amounts of unlabeled target DNA to a preformed tertiary complex of JF549-dCas9/sgMajSat/Cy5-DNA. We found that incubation with increasing amounts of competitor DNA did not displace the Cy5-DNA from the preformed tertiary complex, as indicated by unchanged Cy5 fluorescence intensity of the tertiary complex even in the presence of a 100-fold excess of competitor DNA (Fig. 2A). Incubating preassembled tertiary complex with 30-fold of unlabeled competitor DNA for up to 1.5 h did not dissociate preformed tertiary complex either (Fig. S4B). In line with previous findings (9), these results demonstrated that, once bound to its DNA substrate, the Cas9/sgRNA/DNA complex is exceptionally stable. This prominent feature would allow a strategy of sequential CASFISH by subjecting cells to multiple rounds of CASFISH assays using probes labeled with different fluorochromes and targeting different DNA sequences.
Fig. S4.

(A) EMSA assays of reactions using the indicated fluorescent or unlabeled reagents on 1% agarose gel. The gel was scanned with the two indicated filter settings, a green channel detecting JF549 and DY547 and a red channel detecting JF646 and Cy5. The color of the plus sign denotes that the indicated molecules were fluorescently labeled (green or red) or were unlabeled (black). +, 10 nM; ++, 40 nM; +++, 400 nM. Lanes 1–4 show migration of dCas9 protein alone (lanes 1 and 2), sgRNA alone (lane 3), or DNA substrate alone (lane 4) on the gel. The binary complex formed by dCas9 and sgRNA (lane 5) and the tertiary complex formed by dCas9, sgRNA, and DNA (lanes 6 and 8) migrated at distinct positions on the gel as indicated. dCas9 and DNA (lane 7) did not form a complex, because no new bands were detected on the gel. The addition of 10× unlabeled target DNA before complex formation (lane 10) resulted in about 10-fold less Cy5-DNA incorporated into the tertiary complex, as expected. (B, Left) The indicated fluorescent tertiary complex with Cy5-labeled sgMajSat target DNA was assembled in solution and incubated further at 37 °C for the indicated minutes with or without 30× unlabeled target DNA as competitor. (Right) The Cy5 fluorescent intensity of the bands corresponding to the tertiary complex was plotted as a histogram. The stability of the complex is evident from the lack of competition. Error bars represent SD of three independent experiments.
Fig. 2.

Two-color CASFISH. (A) Competition EMSA assessing the stability of the tertiary complex. (Left) The indicated fluorescent tertiary complex was assembled in solution and further incubated in 37 °C for 15 min with indicated fold-amounts of unlabeled sgMajSat target DNA as competitor. (Right) The fluorescent intensity of the bands of the tertiary complex plotted as a histogram. The stability of the complex is evident from the lack of competition. The control lane (ctrl) indicates the reaction product from a mixture of Cy5 DNA and 30-fold of unlabeled target DNA with dCas9/sgRNA binary complex. As expected, only a small fraction of Cy5-DNA was incorporated into the dCas9 tertiary complex. (B) Competition EMSAs assessing the stability of the binary complex. (Left) The indicated fluorescent binary complex was assembled at room temperature for 10 min and incubated further with the indicated fold-amounts of unlabeled sgMajSat at room temperature for 10 min. Unlabeled target DNA was added to the solution subsequently to form a tertiary complex followed by gel electrophoresis. (Right) The DY547 intensity of the bands of the tertiary complex plotted as a histogram. The stability of the binary complex of dCas9 and DY547-sgRNA is evident from the lack of competition. The control lane (ctrl) indicates the reaction product from the binary complex formed by a mixture of DY547-sgMajSat and 100-fold of unlabeled sgMajSat with dCas9 protein. As expected, only a small fraction of DY547-sgMajSat was incorporated into the dCas9 tertiary complex. (C) Schematic of two-color CASFISH methods. (D) Fluorescent imaging of sequential CASFISH against pericentromeres and telomeres in MEFs using the indicated JF549- or JF646-labeled dCas9 proteins and unlabeled sgRNAs. Results from sequential CASFISH are similar to those from one-step method. Maximum projection of z-stacks is shown. (Scale bars, 5 μM.) Error bars represent the SD of three independent experiments.
To explore the possibility of applying multiple dCas9/sgRNA species in one step for multicolor imaging, we assessed the stability of the binary complex by sgRNA competition assay. We found that increasing amounts of competitor unlabeled sgRNA up to 100-fold did not displace the DY547-sgRNA from preassembled fluorescent dCas9/sgRNA, as indicated by the unchanged DY547 fluorescence intensity of the dCas9 complex (Fig. 2B). In contrast, adding unlabeled sgRNA competitor before the formation of the binary complex substantially reduced the incorporation of DY547-sgRNA to the dCas9 complex. These results demonstrated the high stability of the binary complex and the feasibility of one-step multicolor CASFISH. Therefore, we tested two methods for multicolor CASFISH: sequential rounds of CASFISH or a one-step application of multiple probes (Fig. 2C). Using JF549-dCas9/sgMajSat and JF646-dCas9/sgTelomere probes, we produced two-color imaging of pericentromeres and telomeres in cells with either the sequential CASFISH method (Fig. 2D) or the one-step method in which the two color probes are applied to the cell simultaneously (Fig. S5). There was no detectable cross-reactivity between the two imaging channels in either case. Probes with switched fluorescent labels gave the same results. As expected, CASFISH using two different sgRNAs targeting sgMajSat and sgMajSat-2 showed identical patterns (Fig. 2D). Thus we demonstrated that CASFISH could be used for imaging multiple sequence-specific genomic regions with multiple colors.
Fig. S5.

Fluorescent imaging of pericentromeres and telomeres generated by one-step, two-color CASFISH using the indicated fluorescent dCas9 proteins and unlabeled sgRNAs. Maximum projection of z-stacks is shown. (Scale bars, 5 μM.)
The major satellite and telomere sequences contain hundreds to thousands of repeats for sgRNA targeting. To assess the sensitivity of CASFISH, we tested sgRNAs against DNA substrates with lower copy numbers at the level of tens to hundreds. The human mucin 4 (MUC4) and mucin 1 (MUC1) genes contain repetitive sequences that have been imaged successfully in live cells with dCas9-EGFP (6). CASFISH using sgRNA against the ∼400 copies of the target in exon 2 of the MUC4 gene (sgMUC4-E2) and ∼45 copies of the target in intron 3 (sgMUC4-I1) detected prominent fluorescent puncta in all examined HeLa cell nuclei using either JF549- or JF646-labeled dCas9 protein (Fig. 3A and Fig. S6A). There are three fluorescent puncta in the majority of cells, as expected for the three copies of MUC4 loci in interphase HeLa cells (Fig. 3B). We also observed that labeling appeared weaker in sister chromatids (Fig. S6B, puncta 1 and 2) than in replicating sites in the same cells (Fig. S6B, puncta 3 and 4). Two-color sequential CASFISH using these two sgRNA produced puncta in close proximity, verifying that the signal was specific to MUC4 genes. Based on the fraction of loci labeled in both colors, we estimate the detection efficiency to be ≥94%. As a control, sequential CASFISH of the MUC4 and MUC1 genes (sgMUC4-I1 and sgMUC1-E1) showed distinct locations of these two genes in the nuclei (Fig. 3C), revealing no detectable cross-reactivity between sequential rounds of CASFISH probing. In summary, these results demonstrated that CASFISH is robust and efficient for the simultaneous and multiplexing labeling of multiple given genomic DNA sequences.
Fig. 3.

CASFISH imaging of endogenous coding genes in human cells. (A) Fluorescent imaging of sequential CASFISH targeting two repetitive DNA sequences within intron 3 (sgMUC4-I1) or exon 2 (sgMUC4-E2) of the MUC4 gene. (B) Quantification of the number of MUC4 loci per cell and the total number of loci stained by sequential CASFISH against sgMUC4-I1 (green) and sgMUC4-E2 (red) as in A. n = 80 cells. Loci labeled by both probes are colored yellow. (C) Fluorescent imaging of sequential CASFISH against the MUC4 and MUC1 genes. (D) Sequential CASFISH against repetitive intron 3 (sgMUC4-I1) and nonrepetitive intron 1 (sgMUC4-tiling) of the MUC4 gene. White arrowheads denote the labeled MUC4 genes. dCas9 was labeled by JF549 or JF646, as indicated. Maximum projection of z-stacks is shown. (Scale bars, 5 μM.)
Fig. S6.

(A) Fluorescent imaging of a representative field of view of MUC4 CASFISH. All cells were labeled efficiently. Maximum projection of z-stacks is shown. (B) An example of MUC4 labeling in replicating cells. The fluorescent intensity of each spot was measured, and the background intensity was subtracted. Maximum projection of z-stacks is shown. (Scale bars, 5 μM.)
To explore the ability of CASFISH to image nonrepetitive genomic loci, we synthesized in vitro 73 sgRNAs tiling the 5-kb nonrepetitive region in the first intron of MUC4 gene (sgMUC4-tiling) (6). CASFISH probes assembled by the sgRNA mixture and JF646-labeled dCas9 protein were applied to fixed HeLa cells. We observed specific labeling of MUC4 genes in cells, as verified by proximally localized puncta from a second round of the CASFISH assay using JF549-dCas9/sgMUC4-I1 targeting its repetitive intron 3 (Fig. 3D). We found that CASFISH using sgMUC4-tiling had lower labeling efficiency and higher background than labeling with sgMUC4-I1. Similar observations were made in the live-cell dCas9 imaging (6), suggesting that further understanding and optimization on sgRNA targeting efficiency are needed to improve the imaging of genomic DNA by Cas9.
A diagnostic procedure would be facilitated by a rapid and robust assay for genomic sequences present in tissue. To test whether CASFISH can be applied to tissue sections, we prepared cryostat sections of adult mouse brain and proceeded with CASFISH assays against pericentromeres and telomeres. The dCas9/sgRNA probes penetrated to 15 μm of the brain sections and efficiently labeled their targets in all examined cells (Fig. 4A). We envision that rapid detection of genomic elements by CASFISH could be advantageous in various scenarios, such as a rapid genetic diagnosis and detection of infectious agents. To derive an even more rapid CASFISH protocol, we reduced the reaction time of each step and achieved a 15-min protocol (5-min fixation and concurrent 5-min binary complex assembly, 5-min DNA binding, and 5-min washing between steps) using sgMUC-E2 as an example. The rapid protocol achieved robust labeling for the MUC4 gene, with most cells having three labeled puncta, as expected (Fig. 4B). The fluorescent intensity of the labeled locus was similar to that obtained by the standard protocol. These results suggested that CASFISH could be a rapid and robust method for visualizing specific genomic elements in cells and primary tissue. We expect that a similar procedure could be developed for detection of RNA (15).
Fig. 4.
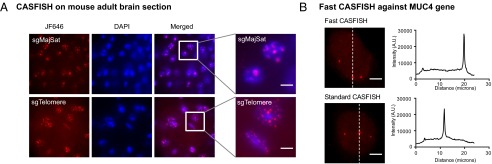
CASFISH imaging on a tissue section and a fast CASFISH protocol. (A) CASFISH of mouse cryostat brain sections against major satellites and telomeres as indicated. (B, Left) Fifteen-minute and standard CASFISH of the MUC4 gene in HeLa cells. (B, Right) Intensity profiles across the labeled loci as indicated by the dotted lines on the left panel. dCas9 were labeled by JF646. Maximum projection of z-stacks is shown. (Scale bars, 5 μM.)
Discussion
The CASFISH assay is rapid, cost-effective, and convenient (Table 1). First, CASFISH takes advantage of the CRISPR-based mechanism for rapid DNA hybridization. This enzymatic probe is more efficient than the nuclei-acid-only probe of DNA FISH that requires heat and formamide treatment to denature dsDNA. Thus, while DNA FISH takes hours or longer, CASFISH can be as fast as 15 min under optimized conditions. Second, the mild conditions of CASFISH (room temperature and 37 °C) can better preserve cell morphology and DNA structure, and thus CASFISH can be a useful tool for studying genome organization combined with single-molecule superresolution imaging (16). Third, the two-component nature of CASFISH probes provides great potential for multiplexing and room for further engineering (Fig. S7). Halo tagging of dCas9, as demonstrated in this study, allows the ease and flexibility of fluorescent labeling for various imaging purposes. A single reagent of labeled dCas9 protein can be assembled with a number of customized unlabeled sgRNAs at minimal cost. CASFISH therefore can be used to interrogate multiple targets with multiple single colors or with combinatory color codes, facilitating studies of spatial relationships of multiple distinct genomic loci. The fast-binding kinetics of CASFISH probes to targets and the mild reaction conditions would allow highly multiplexed DNA profiling in single cells (17). In addition, the protein moiety of CASFISH probes provides room for exploring other labeling methods and incorporating multiple fluorochromes per molecule to achieve higher sensitivity and specificity. Fourth, CASFISH holds great potential for applications. CASFISH can be advantageous in detecting “difficult” DNA FISH sequences as exemplified by G-rich telomeres. CASFISH can be potentially advantageous in detecting subtle DNA variations such as SNPs because the sgRNA sequence composition near the protospacer adjacent motif (PAM) is sensitive to permutation (18). The CASFISH strategy allows delivery of fluorescent dCas9 protein coupled with unlimited numbers of sgRNA, thereby allowing the labeling of gene loci and chromatin domain of any given size. In principle, customized CASFISH probes can be delivered to live cells via direct microinjection or protein delivery methods to allow studies of native chromatin organization. CASFISH is rapid and applicable to primary tissue, thus offering advantages for rapid genetic diagnosis such as the detection of DNA translocations. The CASFISH assay also could be expanded to orthogonal CRISPR systems (19), allowing a wide range of reagent development and providing an opportunity for developing combinatorial, multiplexed, multicolor imaging systems.
Table 1.
Comparison of CASFISH with DNA FISH and live Cas9 imaging
| DNA FISH | Live Cas9 imaging | CASFISH | |
| Probe | Nucleic acid probe | Genetically coded dCas9/sgRNA | In vitro assembled dCas9/sgRNA |
| Difficulty of probe generation | Reliable synthesis | Variable and time-consuming | Reliable synthesis |
| Experiment duration | Hours to days | Immediately | Minutes to 1 h |
| Color | Multicolor | One color per CRISPR system | Multicolor per CRISPR system |
| High-throughput multiplexing | Yes | Challenging | Yes |
| Global DNA denaturation | Yes | No | No |
| Fixed cell imaging | Yes | No | Yes |
| Live cell imaging | No | Yes | Possible |
| Tissue imaging | Yes | Possible | Yes |
Fig. S7.

(A) The advantage of dCas9-Halo for multicolor and multiplexing CASFISH. dCas9-Halo can be labeled with various colored dyes and complexed with various sgRNA targeting different DNA sequences. (B) Concept of the use of single-color or combinatory-color coding to image multiple targets with CASFISH. As shown, a combination of four different colors can detect 15 unique targets.
Materials and Methods
dCas9 Constructs and Purification.
The S. pyogenes Cas9 gene containing the double nuclease mutation (D10A and H840A; dCas9) was cloned into PET302/N (Invitrogen) with an N-terminal hexahistidine affinity tag and a C-terminal Halo tag. A construct with an additional N-terminal aldehyde tag was generated for aldehyde-specific Cy5 labeling (13). All dCas9 fusion proteins were expressed and purified through a three-step FPLC purification protocol as described (SI Materials and Methods) (20).
dCas9 Fluorescent Labeling.
For Halo domain labeling, fluorescent Halo ligands (JF549 and JF646) were mixed in protein samples at ratio of 8:1 and reacted at room temperature for 30 min followed by incubation at 4 °C overnight. The dCas9-Halo with an aldehyde tag was fluorescently labeled with Cy5 hydrazide (GE Healthcare) as described (13). The excessive unreacted fluorescent Halo ligand or Cy5 hydrazide was removed using 40-K molecular weight cut off (MWCO) Zeba spin desalting columns (Thermo Scientific). Protein was eluted in storage buffer containing 50 mM Hepes (pH 7.5), 150 mM KCl, 1 mM Tris(2-carboxyethyl)phosphine (TCEP), and 10% (vol/vol) glycerol, snap frozen in liquid nitrogen, and stored at −80 °C. Protein concentration and labeling efficiency were calculated from absorption spectrum and extinction coefficients according to Beer’s laws.
sgRNA Synthesis.
The DY547-labeled sgMajSat was generated by splint ligation of two fragments: 36 synthetic nucleotides 5′ of sgMajSat with DY547 (GE Dharmacon), and 77 nucleotides 3′ of sgMajSat transcribed and purified with T7. The unlabeled sgRNAs were synthesized in vitro by T7 RNA polymerase (MEGAshortscript T7 Kit; Life Technologies) using DNA templates with the following sequence, 5′-TAATACGACTCACTATAGGN17–28GTTTAAGAGCTATGCTGGAAACAGCATAGCAAGTTTAAATAAGGCTAGTCCGTTATCAACTTGAAAAAGTGGCACCGAGTCGGTGC-3′. The template contains a T7 promoter-binding sequence (underlined), the sgRNA target (GGN17–28) (bold), and the sgRNA backbone as reported (6). The T7 template DNA was synthesized by either gBlock (Integrated DNA Technologies) or PCR reactions. Produced sgRNAs were purified by MEGAclear Transcription Clean-Up Kit (Life Technologies), and the quality was verified by 10% denaturing PAGE. Related sequences are listed in Tables S2–S4.
Table S2.
Synthesis of DY547-labeled sgMajSat by splint ligation
| 5′-sgMajSat | DY547-CCAUAUUCCACGUCCUACAGGUUUAAGAGCUAUGCU |
| 3′-sgMajSat | GGAAACAGCAUAGCAAGUUUAAAUAAGGCUAGUCCGUUAUCAACUUGAAAAAGUGGCACCGAGUCGGUGCUUUUUUU |
| sgMajSat-bridge | AAACTTGCTATGCTGTTTCCAGCATAGCTCTTAAACCTGT |
Table S4.
T7 transcription template synthesized by PCR
| Sequence name | Sequence |
| Design of the forward primers TAATACGACTCACTATAGGN17–28GTTTAAGAGCTATGCTGG | |
| sgRNA backbone | TAATACGACTCACTATAGGGTTTAAGAGCTATGCTGG |
| sgMUC4-I1 | TAATACGACTCACTATAgGAGGTGACACCGTGGGCTGGGGGTTTAAGAGCTATGCTGG |
| sgMUC4-E2 | TAATACGACTCACTATAgGAAGTGTCGACAGGAAGAGTTTAAGAGCTATGCTGG |
| sgMUC1-E2 | TAATACGACTCACTATAgGAAGGTATGGGTGTGGAAGGTATGTTTAAGAGCTATGCTGG |
| sgMUC4-tiling forward primers | |
| sgMUC4_01 | TAATACGACTCACTATAgGAAGAGTGGAGGCCGTGCGCGGGTTTAAGAGCTATGCTGG |
| sgMUC4_02 | TAATACGACTCACTATAgGACCTCAGGTGATCTCCTGCCTGTTTAAGAGCTATGCTGG |
| sgMUC4_03 | TAATACGACTCACTATAgGTATATTTAGTAGAGACGGTTTAAGAGCTATGCTGG |
| sgMUC4_04 | TAATACGACTCACTATAgGAGTAGCTGGAATTACAGGTGGTTTAAGAGCTATGCTGG |
| sgMUC4_05 | TAATACGACTCACTATAgGCTCACTGCAACCTCCACCTCCCGTTTAAGAGCTATGCTGG |
| sgMUC4_06 | TAATACGACTCACTATAgGACAGAGTCTCGCTCTCTCTCCCGTTTAAGAGCTATGCTGG |
| sgMUC4_07 | TAATACGACTCACTATAgGAAGAGGAGAAAAGTGGGGAAGGTTTAAGAGCTATGCTGG |
| sgMUC4_08 | TAATACGACTCACTATAgGAACAGAGGGCCAGAGAGCAGCCGTTTAAGAGCTATGCTGG |
| sgMUC4_09 | TAATACGACTCACTATAgGTCTTTCTCTCTGCGAGTAAGCCTGTTTAAGAGCTATGCTGG |
| sgMUC4_10 | TAATACGACTCACTATAgGTACACCCTTGTGTACAGAGCTGTTTAAGAGCTATGCTGG |
| sgMUC4_11 | TAATACGACTCACTATAgGAAAACTCATGTAAAGCTGCAGTTTAAGAGCTATGCTGG |
| sgMUC4_12 | TAATACGACTCACTATAgGCAAGCAAGGGAAGCGACAAGGGTTTAAGAGCTATGCTGG |
| sgMUC4_13 | TAATACGACTCACTATAGGAGGCGGCCAGGGCGCAGAGTTTAAGAGCTATGCTGG |
| sgMUC4_14 | TAATACGACTCACTATAgGCTTTTAAACCCGAGCTCAGGTTTAAGAGCTATGCTGG |
| sgMUC4_15 | TAATACGACTCACTATAgGTAGCCCCGGCATTGGCCTTGTTTAAGAGCTATGCTGG |
| sgMUC4_16 | TAATACGACTCACTATAgGCCTGTGGGAGATGTTCCCTCGTTTAAGAGCTATGCTGG |
| sgMUC4_17 | TAATACGACTCACTATAgGTCCTGAAGCCAGAGGGACAGCCGTTTAAGAGCTATGCTGG |
| sgMUC4_18 | TAATACGACTCACTATAgGAGTCTTTGGGGGAGAGTCTGTTTAAGAGCTATGCTGG |
| sgMUC4_19 | TAATACGACTCACTATAgGCTCCTGCCCTGCCTCTCAGCGTTTAAGAGCTATGCTGG |
| sgMUC4_20 | TAATACGACTCACTATAgGCATATTTGAGGAGCTTCCTGTTTAAGAGCTATGCTGG |
| sgMUC4_21 | TAATACGACTCACTATAGGCTGCAAGAGAAGCCATGCGTTTAAGAGCTATGCTGG |
| sgMUC4_22 | TAATACGACTCACTATAgGATGTTTCAGGACTAGGCTGAGTTTAAGAGCTATGCTGG |
| sgMUC4_23 | TAATACGACTCACTATAgGCTGGAGGGTGGGGAGGTGTAGTTTAAGAGCTATGCTGG |
| sgMUC4_24 | TAATACGACTCACTATAGGTGGGATGAGCACTGGAGCGTTTAAGAGCTATGCTGG |
| sgMUC4_25 | TAATACGACTCACTATAgGCCCTGCAGATGTGGTTGAGTTTAAGAGCTATGCTGG |
| sgMUC4_26 | TAATACGACTCACTATAgGAGGCTGGGGCTTGGGGCGCCGTTTAAGAGCTATGCTGG |
| sgMUC4_27 | TAATACGACTCACTATAgGTCTTTGCCGTGAACTGTTCGTTTAAGAGCTATGCTGG |
| sgMUC4_28 | TAATACGACTCACTATAgGACCGGGGCCCTGGGGAGACACGTTTAAGAGCTATGCTGG |
| sgMUC4_29 | TAATACGACTCACTATAgGCTGGACACTCAGCTCCATGGTTTAAGAGCTATGCTGG |
| sgMUC4_30 | TAATACGACTCACTATAgGAGCGCAGAGGGGCAAGACCTGTTTAAGAGCTATGCTGG |
| sgMUC4_31 | TAATACGACTCACTATAgGAGAAGGAGTGAAGGACTGTGTTTAAGAGCTATGCTGG |
| sgMUC4_32 | TAATACGACTCACTATAgGCTCCACGACATGCCTAGCTTCTTCGTTTAAGAGCTATGCTGG |
| sgMUC4_33 | TAATACGACTCACTATAgGAGCTGGGCCAGGAGAGGAGAGTTTAAGAGCTATGCTGG |
| sgMUC4_34 | TAATACGACTCACTATAgGACCGGGCATGACCAGGGCCTGTTTAAGAGCTATGCTGG |
| sgMUC4_35 | TAATACGACTCACTATAGGGCAGCCCCCACCCCCACAGTTTAAGAGCTATGCTGG |
| sgMUC4_36 | TAATACGACTCACTATAgGTTCCTTTTGGCTCCCTGAAGGTTTAAGAGCTATGCTGG |
| sgMUC4_37 | TAATACGACTCACTATAGGGTCTGTTTGCACACTTGCGTTTAAGAGCTATGCTGG |
| sgMUC4_38 | TAATACGACTCACTATAgGCCCAGGCCAGAGGAAAAACACAGTTTAAGAGCTATGCTGG |
| sgMUC4_39 | TAATACGACTCACTATAgGTTTCCTTAAGGAACAGCCCGTTTAAGAGCTATGCTGG |
| sgMUC4_40 | TAATACGACTCACTATAgGCAGACAGAGGTGGGCTAGACAGTTTAAGAGCTATGCTGG |
| sgMUC4_41 | TAATACGACTCACTATAgGCCCCAGGCAGGAATGACTCAGAGTTTAAGAGCTATGCTGG |
| sgMUC4_42 | TAATACGACTCACTATAgGACCCAGTTGCCTTTCCCTGGTTTAAGAGCTATGCTGG |
| sgMUC4_43 | TAATACGACTCACTATAgGACCCCAGGGAGGTGACAGGCGTTTAAGAGCTATGCTGG |
| sgMUC4_44 | TAATACGACTCACTATAgGCCACAGCGCACTCCACGGGGAAGTTTAAGAGCTATGCTGG |
| sgMUC4_45 | TAATACGACTCACTATAgGTCCCAGACTGACAGATAGACCGTTTAAGAGCTATGCTGG |
| sgMUC4_46 | TAATACGACTCACTATAgGAGGGGTCTGTGGAGAGTTTGTTTAAGAGCTATGCTGG |
| sgMUC4_47 | TAATACGACTCACTATAgGTCCAGCATCAGCGACGCCCTGTTTAAGAGCTATGCTGG |
| sgMUC4_48 | TAATACGACTCACTATAgGCCTAAGACTCCAGAGCCAAAGTTTAAGAGCTATGCTGG |
| sgMUC4_49 | TAATACGACTCACTATAgGCTACTACGTAGGGTTGTCATGGTTTAAGAGCTATGCTGG |
| sgMUC4_50 | TAATACGACTCACTATAgGTAAAGTAGAAAAGGCATAAAGTTTAAGAGCTATGCTGG |
| sgMUC4_51 | TAATACGACTCACTATAgGCACTTTTGGAGGCCCAGGCGTTTAAGAGCTATGCTGG |
| sgMUC4_52 | TAATACGACTCACTATAgGTGGAGACAGGGTTGGCCAAGCGTTTAAGAGCTATGCTGG |
| sgMUC4_53 | TAATACGACTCACTATAgGCTCCCTGCAACCTCTGCCTCCCGTTTAAGAGCTATGCTGG |
| sgMUC4_54 | TAATACGACTCACTATAgGCCTCTTTCTCAAACACGTCTTTAGTTTAAGAGCTATGCTGG |
| sgMUC4_55 | TAATACGACTCACTATAgGAACCCGGAATGGCACTTGTGTGTTTAAGAGCTATGCTGG |
| sgMUC4_56 | TAATACGACTCACTATAGGTGGCTTTTTAGAGGCACGGTTTAAGAGCTATGCTGG |
| sgMUC4_57 | TAATACGACTCACTATAGGCTTGGTGTATTCAGAATGGTTTAAGAGCTATGCTGG |
| sgMUC4_58 | TAATACGACTCACTATAgGCACTGCCAGGCCAGCCTCTGCCGTTTAAGAGCTATGCTGG |
| sgMUC4_59 | TAATACGACTCACTATAgGCTAAGGACAAGAGGCAATGAGGTTTAAGAGCTATGCTGG |
| sgMUC4_60 | TAATACGACTCACTATAgGACTCAATTTCTCAGAACATGCTGGTTTAAGAGCTATGCTGG |
| sgMUC4_61 | TAATACGACTCACTATAgGACAGAGTTTCTCTCTGTCCCCCGTTTAAGAGCTATGCTGG |
| sgMUC4_62 | TAATACGACTCACTATAGGGGTTTCACCATGTTGGCCGTTTAAGAGCTATGCTGG |
| sgMUC4_63 | TAATACGACTCACTATAgGCTCGCCTCGGCTCCCAAAGTGCGTTTAAGAGCTATGCTGG |
| sgMUC4_64 | TAATACGACTCACTATAGGGCATTTGTGTTGCACGTGGTTTAAGAGCTATGCTGG |
| sgMUC4_65 | TAATACGACTCACTATAgGAGTGGAGCTGCGGGCAACCCGTTTAAGAGCTATGCTGG |
| sgMUC4_66 | TAATACGACTCACTATAgGTAGAGATGCCGCCCCGCCCGTTTAAGAGCTATGCTGG |
| sgMUC4_67 | TAATACGACTCACTATAgGTCCAGTGGCCAGTGGATTTTGGTTTAAGAGCTATGCTGG |
| sgMUC4_68 | TAATACGACTCACTATAgGAGGCAGCTGGGACTAGAACCCGTTTAAGAGCTATGCTGG |
| sgMUC4_69 | TAATACGACTCACTATAgGTCGGTGGGCTGGGCTGGTTGTTTAAGAGCTATGCTGG |
| sgMUC4_70 | TAATACGACTCACTATAgGAATGAATGGCTGTCTCAGCAGTTTAAGAGCTATGCTGG |
| sgMUC4_71 | TAATACGACTCACTATAgGAAACAGACGTGGCCCAGTCTCTGTTTAAGAGCTATGCTGG |
| sgMUC4_72 | TAATACGACTCACTATAgGCTGAGAGCTGCATTTCGAAGTTTAAGAGCTATGCTGG |
| sgMUC4_73 | TAATACGACTCACTATAgGACAAGTCAGGAAGGGCCCTGTGGTTTAAGAGCTATGCTGG |
PCR template: GCACCGACTCGGTGCCACTTTTTCAAGTTGATAACGGACTAGCCTTATTTAAACTTGCTATGCTGTTTCCAGCATAGCTCTTAAAC; reverse primer: GCACCGACTCGGTGCCACTT. Lowercase “g” denotes additional guanines that are not complementary to sgRNA targets.
Table S3.
Synthesis of DNA template for T7 transcription of sgRNA: T7 transcription template sequences synthesized by gBlock
| gBlock_sgMajSat | GGTGACACTATAGAACTCGAGCAGCTGGATCCTAATACGACTCACTATAGGCCATATTCCACGTACAGGTTTAAGAGCTATGCTGGAAACAGCATAGCAAGTTTAAATAAGGCTAGTCCGTTATCAACTTGAAAAAGTGGCACCGAGTCGGTGC |
| gBlock_sgTelomere | GGTGACACTATAGAACTCGAGCAGCTGGATCCTAATACGACTCACTATAGGGTTAGGGTTAGGGTTAGGGTTAGTTTAAGAGCTATGCTGGAAACAGCATAGCAAGTTTAAATAAGGCTAGTCCGTTATCAACTTGAAAAAGTGGCACCGAGTCGGTGC |
| gBlock_sgMinSat | GGTGACACTATAGAACTCGAGCAGCTGGATCCTAATACGACTCACTATAggATCTATTATGTTCTACAGTGGTTTAAGAGCTATGCTGGAAACAGCATAGCAAGTTTAAATAAGGCTAGTCCGTTATCAACTTGAAAAAGTGGCACCGAGTCGGTGC |
| gBlock_sgMBS | GGTGACACTATAGAACTCGAGCAGCTGGATCCTAATACGACTCACTATAGGTCGACTCTAGAAAACATGGTTTAAGAGCTATGCTGGAAACAGCATAGCAAGTTTAAATAAGGCTAGTCCGTTATCAACTTGAAAAAGTGGCACCGAGTCGGTGC |
Design of the T7 transcription template (TAATACGACTCACTATAGGN17–28GTTTAAGAGCTATGCTGGAAACAGCATAGCAAGTTTAAATAAGGCTAGTCCGTTATCAACTTGAAAAAGTGGCACCGAGTCGGTGC). Lowercase “g” denotes additional guanines that are not complementary to sgRNA targets.
Cell Culture and Brain Section Preparation.
MEFs and HeLa cells were cultured in DMEM without Phenol-red (Gibco) supplemented with 10% FBS and 1% penicillin/streptomycin. Cytogenetic analysis of MEF cells was performed by Cell Line Genetics. Cryostat sections were prepared from freshly frozen adult mouse brain with a slice thickness of ∼20 μM.
CASFISH.
Unless indicated, the standard CASFISH protocol is as follows: Cells cultured on 35-mm MatTek dishes or tissue sections were fixed at −20 °C for 20 min in a prechilled solution of methanol and acetic acid at a 1:1 ratio. Samples were washed three times (5 min each washing) with PBS with gentle shaking, followed by incubation for 15 min at 37 °C in blocking/reaction buffer [20 mM Hepes (pH 7.5), 100 mM KCl, 5 mM MgCl2, freshly added 1 mM DTT, 5% (vol/vol) glycerol, 1% BSA, and 0.1% TWEEN-20]. To assemble CASFISH probes, fluorescently labeled dCas9 protein (5–25 nM) was mixed with labeled or unlabeled sgRNA at molar ratio of 1:1 or 1:4, respectively, in blocking/reaction buffer and was incubated at room temperature for 10 min and stored on ice before the next step. Five nM of fluorescent dCas9 protein was used for CASFISH against MUC4 repetitive DNA elements. For all other CASFISH experiments, 25 nM dCas9 protein was used. The assembled dCas9/sgRNA was applied on preblocked cells and incubated for 5–30 min at 37 °C. The reaction was terminated by the removal of the dCas9/sgRNA solution and washing three times with blocking/reaction buffer. CASFISH samples of sgMUC4-tiling were washed further in buffer containing 20 mM Hepes (pH 7.5), 300 mM NaCl, 3 M urea, and 1.1% (vol/vol) Nonidet P-40. The short CASFISH protocol was modified to the following procedures: Cells were fixed for 5 min at −20 °C, rinsed three times with PBS, subjected to the preincubated (5 min) dCas9 and sgRNA mixture for 5 min at 37 °C, and again rinsed three times with PBS. All samples were stained with 0.5 μg/mL DAPI for 5 min before imaging.
EMSA Assay.
dCas9 protein and sgRNA were incubated together at room temperature for 10 min to examine the binary complex and subsequently were incubated with target DNA at 37 °C for 15 min to examine the tertiary complex. For the competition assay, an additional binary or tertiary complex reaction was performed after the addition of the competitor molecules. Resulting reaction mixtures were subjected to electrophoresis of 1% agarose gel in 1× Tris/borate/EDTA buffer containing 5 mM MgCl2 and were imaged with GE Typhoon Trio+ Imagers.
Microscopy and Image Analysis.
All CASFISH samples were imaged on an inverted microscope (Nikon Eclipse Ti) equipped with a 100× oil-immersion objective (Nikon CFI Plan Apo VC 100× Oil, NA 1.4) and an EM CCD (Andor iXon Ultra 897). DAPI, JF549, or JF646 labeling was imaged using a white light excitation system (SOLA light engine; Lumencor) in conjunction with the proper filter cubes sets (DAPI-1160B-NTE-Zero, LF561/LP-A-NTE, or Cy5-3040C-NTE-Zero, respectively; Semrock). JF549 or JF646 labeling also was imaged using laser excitation [561 nm (Cobolt Jive) or 637 nm (Vortran Stradus), respectively] in conjunction with a multiband dichroic (Di01-R405/488/561/635; Semrock). Proper emission filters for JF549 or JF6464 ( FF01-593/40 or FF01-676/37; Semrock) were placed in front of the camera. Z-stacks were collected at step size of 0.2 μm for 30–40 slices to image the entire nucleus. Images were processed using ImageJ (21).
SI Materials and Methods
dCas9 FPLC.
All dCas9 fusion proteins were expressed and purified through a three-step FPLC purification protocol, as described (20), with the following modifications. Briefly, the protein was expressed in E. coli BL21 (DE3) (Agilent Technologies) and was grown in LB medium at 16 °C overnight following induction with 1 mM isopropyl β-d-1-thiogalactopyranoside (IPTG). Cells were lysed in 50 mM sodium phosphate (pH 7.0) and 300 mM NaCl. Clarified lysate was applied to a 1-mL HisTALON (Clontech) affinity column. The bound protein was eluted in 50 mM sodium phosphate (pH 7.0) and 300 mM NaCl by increasing the imidazole concentration to 150 mM and was exchanged into buffer [50 mM Hepes (pH 7.5), 100 mM KCl, 1 mM TCEP] by a 50,000-MWCO centrifugal filter (Millipore Amicon). The protein was purified further with cation ion exchange chromatography (HiTrap SP HP; GE Healthcare) and was eluted with a linear gradient of buffers containing 0.1–1.0 M KCl. The eluted protein was purified further by gel filtration chromatography on a Superdex 200 16/60 column (GE Healthcare) in buffer containing 50 mM Hepes (pH 7.5), 150 mM KCl, and 1 mM TCEP. Protein was stored at −80 °C with additional 20% glycerol.
Live-Cell Imaging of Pericentromeres.
MEFs were transfected with mammalian expression plasmids containing dCas9-Halo and sgMajSat. At 48 h posttransfection, cells were incubated with 300 nM of JF549-Halo ligands for 15 min at 37 °C in a cell incubator. Cells subsequently were washed twice with warm PBS, incubated with fresh and warm medium for another 30 min, washed twice with warm PBS, and changed to fresh medium before imaging.
Immunofluorescence Staining.
The cells were blocked in 1% BSA/10% normal goat serum/0.3 M glycine in 0.1% PBS-Tween 20 for 1 h and then were incubated with Alexa 488-conjugated anti-HP1α antibody (ab185018; Abcam) at a working dilution of 1:50 overnight at 4 °C. The cells were washed with PBS and stained with DAPI before imaging. Alexa 488 labeling was imaged using a white light excitation system (SOLA light engine; Lumencor) in conjunction with the proper filter cube sets (CFP-A-Basic-NTE; Semrock).
Acknowledgments
We thank L. Lavis for generously providing Janelia Fluor-conjugated Halo ligands; L. Xie for providing the PET302/N-dCas9-Halo construct; Z. Zhang and G. Henry for experimental discussions; B. Mehl for assistance with microscopy; W. Hu and L. Witkowsky for assistance with protein purification; A. Hu and R. Gong for preparing mouse brain cryostat sections; and J. Doudna for helpful discussions. Funding was provided by the Howard Hughes Medical Institute. W.D. received support from the Helen Hay Whitney Foundation.
Footnotes
The authors declare no conflict of interest.
This article contains supporting information online at www.pnas.org/lookup/suppl/doi:10.1073/pnas.1515692112/-/DCSupplemental.
References
- 1.Hübner MR, Eckersley-Maslin MA, Spector DL. Chromatin organization and transcriptional regulation. Curr Opin Genet Dev. 2013;23(2):89–95. doi: 10.1016/j.gde.2012.11.006. [DOI] [PMC free article] [PubMed] [Google Scholar]
- 2.Levsky JM, Singer RH. Fluorescence in situ hybridization: Past, present and future. J Cell Sci. 2003;116(Pt 14):2833–2838. doi: 10.1242/jcs.00633. [DOI] [PubMed] [Google Scholar]
- 3.Beliveau BJ, et al. Versatile design and synthesis platform for visualizing genomes with Oligopaint FISH probes. Proc Natl Acad Sci USA. 2012;109(52):21301–21306. doi: 10.1073/pnas.1213818110. [DOI] [PMC free article] [PubMed] [Google Scholar]
- 4.Sternberg SH, Doudna JA. Expanding the Biologist’s Toolkit with CRISPR-Cas9. Mol Cell. 2015;58(4):568–574. doi: 10.1016/j.molcel.2015.02.032. [DOI] [PubMed] [Google Scholar]
- 5.Mali P, Esvelt KM, Church GM. Cas9 as a versatile tool for engineering biology. Nat Methods. 2013;10(10):957–963. doi: 10.1038/nmeth.2649. [DOI] [PMC free article] [PubMed] [Google Scholar]
- 6.Chen B, et al. Dynamic imaging of genomic loci in living human cells by an optimized CRISPR/Cas system. Cell. 2013;155(7):1479–1491. doi: 10.1016/j.cell.2013.12.001. [DOI] [PMC free article] [PubMed] [Google Scholar]
- 7.Tanenbaum ME, Gilbert LA, Qi LS, Weissman JS, Vale RD. A protein-tagging system for signal amplification in gene expression and fluorescence imaging. Cell. 2014;159(3):635–646. doi: 10.1016/j.cell.2014.09.039. [DOI] [PMC free article] [PubMed] [Google Scholar]
- 8.Ma H, et al. Multicolor CRISPR labeling of chromosomal loci in human cells. Proc Natl Acad Sci USA. 2015;112(10):3002–3007. doi: 10.1073/pnas.1420024112. [DOI] [PMC free article] [PubMed] [Google Scholar]
- 9.Sternberg SH, Redding S, Jinek M, Greene EC, Doudna JA. 2014. DNA interrogation by the CRISPR RNA-guided endonuclease Cas9. Nature. [DOI] [PMC free article] [PubMed]
- 10.Encell LP, et al. Development of a dehalogenase-based protein fusion tag capable of rapid, selective and covalent attachment to customizable ligands. Curr Chem Genomics. 2012;6:55–71. doi: 10.2174/1875397301206010055. [DOI] [PMC free article] [PubMed] [Google Scholar]
- 11.Grimm JB, et al. A general method to improve fluorophores for live-cell and single-molecule microscopy. Nat Methods. 2015;12(3):244–250, 3, 250. doi: 10.1038/nmeth.3256. [DOI] [PMC free article] [PubMed] [Google Scholar]
- 12.Ziegler-Birling CEL, Miyanari Y, Torres-Padilla M-E. Live visualization of chromatin dynamics with fluorescent TALEs. Nat Struct Mol Biol. 2013;20:1321–1324. doi: 10.1038/nsmb.2680. [DOI] [PubMed] [Google Scholar]
- 13.Shi X, et al. Quantitative fluorescence labeling of aldehyde-tagged proteins for single-molecule imaging. Nat Methods. 2012;9(5):499–503. doi: 10.1038/nmeth.1954. [DOI] [PMC free article] [PubMed] [Google Scholar]
- 14.Zijlmans JM, et al. Telomeres in the mouse have large inter-chromosomal variations in the number of T2AG3 repeats. Proc Natl Acad Sci USA. 1997;94(14):7423–7428. doi: 10.1073/pnas.94.14.7423. [DOI] [PMC free article] [PubMed] [Google Scholar]
- 15.O'Connell MR, et al. 2014. Programmable RNA recognition and cleavage by CRISPR/Cas9. Nature.
- 16.Beliveau BJ, et al. Single-molecule super-resolution imaging of chromosomes and in situ haplotype visualization using Oligopaint FISH probes. Nat Commun. 2015;6:7147. doi: 10.1038/ncomms8147. [DOI] [PMC free article] [PubMed] [Google Scholar]
- 17.Chen KH, Boettiger AN, Moffitt JR, Wang S, Zhuang X. RNA imaging. Spatially resolved, highly multiplexed RNA profiling in single cells. Science. 2015;348(6233):aaa6090. doi: 10.1126/science.aaa6090. [DOI] [PMC free article] [PubMed] [Google Scholar]
- 18.Hsu PD, et al. DNA targeting specificity of RNA-guided Cas9 nucleases. Nat Biotechnol. 2013;31(9):827–832. doi: 10.1038/nbt.2647. [DOI] [PMC free article] [PubMed] [Google Scholar]
- 19.Esvelt KM, et al. Orthogonal Cas9 proteins for RNA-guided gene regulation and editing. Nat Methods. 2013;10(11):1116–1121. doi: 10.1038/nmeth.2681. [DOI] [PMC free article] [PubMed] [Google Scholar]
- 20.Jinek M, et al. A programmable dual-RNA-guided DNA endonuclease in adaptive bacterial immunity. Science. 2012;337(6096):816–821. doi: 10.1126/science.1225829. [DOI] [PMC free article] [PubMed] [Google Scholar]
- 21.Schneider CA, Rasband WS, Eliceiri KW. NIH Image to ImageJ: 25 years of image analysis. Nat Methods. 2012;9(7):671–675. doi: 10.1038/nmeth.2089. [DOI] [PMC free article] [PubMed] [Google Scholar]
- 22.Janicki SM, et al. From silencing to gene expression: Real-time analysis in single cells. Cell. 2004;116(5):683–698. doi: 10.1016/s0092-8674(04)00171-0. [DOI] [PMC free article] [PubMed] [Google Scholar]