

Significance
β-Amyloid (Aβ) fibrils are formed from Aβ peptide and are a hallmark feature of Alzheimer’s disease (AD). Despite their involvement in AD, much remains unclear about the formation of these aggregates and their structures at the molecular level. We have obtained a 3D image of a fibril formed from the Aβ(1–42) peptide isoform using electron cryomicroscopy and built a partial atomic model based on these data. We show that the core of the fibril is formed by two peptide C termini, explaining why aggregation inhibitors are most potent when targeting the C terminus. Our model explains how addition of C-terminal amino acids may stabilize peptide interaction and how fibril stability is affected by mutations leading to familial AD.
Keywords: protein aggregation, protein folding, cross-β, Frealix
Abstract
Alzheimer’s disease (AD) is a fatal neurodegenerative disorder in humans and the main cause of dementia in aging societies. The disease is characterized by the aberrant formation of β-amyloid (Aβ) peptide oligomers and fibrils. These structures may damage the brain and give rise to cerebral amyloid angiopathy, neuronal dysfunction, and cellular toxicity. Although the connection between AD and Aβ fibrillation is extensively documented, much is still unknown about the formation of these Aβ aggregates and their structures at the molecular level. Here, we combined electron cryomicroscopy, 3D reconstruction, and integrative structural modeling methods to determine the molecular architecture of a fibril formed by Aβ(1–42), a particularly pathogenic variant of Aβ peptide. Our model reveals that the individual layers of the Aβ fibril are formed by peptide dimers with face-to-face packing. The two peptides forming the dimer possess identical tilde-shaped conformations and interact with each other by packing of their hydrophobic C-terminal β-strands. The peptide C termini are located close to the main fibril axis, where they produce a hydrophobic core and are surrounded by the structurally more flexible and charged segments of the peptide N termini. The observed molecular architecture is compatible with the general chemical properties of Aβ peptide and provides a structural basis for various biological observations that illuminate the molecular underpinnings of AD. Moreover, the structure provides direct evidence for a steric zipper within a fibril formed by full-length Aβ peptide.
Amyloid fibrils are the terminal assembly states of the β-amyloid (Aβ) fibrillogenic pathway. They are responsible for the neuronal damage in cerebral amyloid angiopathy and form the core of Alzheimer’s disease (AD)-specific amyloid plaques (1, 2). These plaques can locally accumulate toxic Aβ oligomers and may be surrounded by halos of altered neuronal activity (2). Our understanding of Aβ fibril structures is limited because it is difficult to explain biochemical and biological properties of Aβ and its aggregates from current fibril models. First, why does the AD-specific extension of the Aβ C terminus from Aβ(1–40) to Aβ(1–42) yield a peptide variant that is more favorable for the aggregated state and, thus, more pathogenic (3)? Second, why do fibrils formed from these two peptides exhibit a limited capacity to form mixed fibrils in vitro (4)? Third, why do the charged residues Glu22 and Asp23 disturb the fibril state such that their genetic mutation accelerates fibril formation in vitro and leads to early onset familial AD in patients (5)? Lastly, why are fibrillation inhibitors particularly effective if they target the Aβ C terminus (6, 7), and how is oligomeric assembly of toxic intermediates reflected by the structure of the fibril (1, 3)?
To address these questions, we determined the structure of an Aβ(1–42) fibril morphology by electron cryomicroscopy (cryo-EM). Cryo-EM is an established technique for visualizing the 3D structure of macromolecular assemblies at near-atomic resolution (8). The technique does not require crystals and is therefore particularly well suited for the study of polymorphic amyloid structures in solution. Cryo-EM has been applied to fibrils formed from SH3 domains (9), transthyretin fragments (10), β2-microglobulin (11), and Alzheimer’s Aβ peptide (12–14). Furthermore, recent cryo-EM reconstructions have identified a common protofilament substructure in Aβ(1–40) and Aβ(1–42) fibrils in which the cross-β repeats were formed by peptide dimers (12, 15).
Results
Cryo-EM Reconstruction of the Aβ(1–42) Fibril.
We performed a 3D reconstruction of an Aβ(1–42) fibril based on cryo-EM images of 29 single fibrils. Fibrils were obtained by incubation of synthetic peptide in pH 7.4 buffered solution (12). X-ray diffraction (XRD), infrared spectroscopy, Congo red green birefringence, and thioflavin T binding previously demonstrated the amyloid-like properties of these filaments, their cross-β sheet architecture, and their parallel β-strand orientation (12). The fibril images were processed using Frealix (16), recently developed helical reconstruction software, yielding a 3D structure that displays subnanometer resolution in cross-sections perpendicular to the fibril axis. The reconstruction does not resolve the characteristic 4.7-Å cross-β repeat and, therefore, appears smooth along the fibril axis. The structure shows a single, twofold symmetrical protofilament fibril with a left-handed helical supertwist with 110-nm crossover distance (Table S1). Twofold symmetry of the fibril was established previously (12) and is also visible in a reconstruction calculated without imposed symmetry (Fig. S1). This apparent symmetry around the fibril axis does not rule out related symmetries that include a staggered arrangement of the peptides, such as a coaxial 21-screw, which are indistinguishable from a nonstaggered twofold symmetry at the present resolution.
Table S1.
Image processing statistics
| Pixel size on the specimen, Å | 1.2 |
| Resolution at FRC = 0.143, Å | 7 |
| Total length of nonoverlapping segments, nm | 29,290 |
| No. of fibrils | 29 |
| No. of subunits (repeat units) | 62,320 |
| Segment size during refinement, nm | 2.2–6.4* |
| Average twist per subunit, ° | −0.769 |
| Axial symmetry | Twofold |
| Average crossover distance, nm | 110 |
| Assumed repeat distance, Å | 4.7 |
| Fibril width, nm | 10 |
*Bigger segments for straight fibrils and smaller segments for bent fibrils, as detailed in Rohou and Grigorieff (16).
Fig. S1.
Twofold symmetrical and asymmetrical reconstruction. Comparison of the cross-sectional density of Aβ(1–42) reconstruction with (A) and without (B) imposing twofold symmetry.
The fibril cross-section can be divided into three structural domains (Fig. 1). The central (C) domain is close to the main axis of the fibril, whereas two peripheral (P) domains are located at outer radial positions. The C domain consists of two tilde-shaped density leaflets with one narrow and one wide arch. The wide arch extends into the density of the adjacent P domain and wraps around the narrow arch of the juxtaposed leaflet. The leaflets are separated by ∼1 nm (Fig. 1), which corresponds to the 0.97-nm XRD spacing (12) and implies that the leaflets constitute the fibril cross-β sheet structure. The reconstruction has an overall resolution of about 7 Å, based on the 0.143 Fourier ring correlation (FRC) criterion (Fig. S2). The portion of the leaflet that is closest to the fibril axis exhibits better-defined density features than other areas of the map, particularly those belonging to the P domains. The density at the fibril core has an estimated resolution of 5 Å (Fig. S2) and displays a zigzag pattern that fits the structure of a hexapeptide in pleated β-sheet geometry (Fig. 1E) or of a parallel steric zipper packed face-to-face (Fig. S3). The resolution of the P domains is significantly lower, presumably because of structural disorder (Fig. S2).
Fig. 1.

Features of the reconstructed density map. (A and B) Negative-stain EM (A) and cryo-EM (B) images of the analyzed Aβ(1–42) fibril morphology. (C and D) Side view (C) and cross-section (D) of the reconstruction (rendered at 5 Å). The coloring (blue and red) reflects the presence of two leaflets and two P domains. (E) Cross-sectional view with the zipper-like density superimposed with two six-residue poly-l-Ala β-strands. The lines show the possible peptide trace in the C domain (continuous) and P domain (dashed). The solid lines and six-residue β-strands delineate the ∼7.5-nm section of the peptide forming the β-sheet leaflets at the fibril core. A–C are on the same scale.
Fig. S2.

FRC curves calculated for the reconstructed Aβ(1–42) fibril. Different curves were calculated to assess the overall resolution and the resolution of features at different radii from the fibril center. To calculate the resolution for a particular radial interval, the map was masked with a soft-edged mask to remove density outside that interval. The curve calculated for the unmasked reconstruction indicates a resolution of ∼7 Å at FRC = 0.143 (green). At the fibril core (0 ≤ radius ≤ 6 Å), this resolution is about 5 Å (red). At larger radii (16 Å ≤ radius ≤ 25 Å, purple), the resolution drops to about 7-Å resolution and drops further to about 9 Å at the periphery (25 Å ≤ radius ≤ 45 Å, blue).
Fig. S3.

Core region density of Aβ(1–42) superimposed with a steric zipper structure. C domain of the Aβ(1–42) density superimposed with a steric zipper predicted for Aβ(1–42). Out of all Aβ-derived steric zippers that have been published within the zipper database (services.mbi.ucla.edu/zipperdb) or listed within the Protein Data Bank (19, 20), this is the one that best fits our fibril density within the zipper-like segment.
C-Terminal Cross-β Structure at the Fibril Core.
Whereas the leaflets outline the general path of the peptide within the C domain, the peptide path is less clear in the P domains. To determine the directionality of the peptide path within the density, we imaged fibrils decorated with fragments antigen binding (Fab) from 2H4 antibody; 2H4 recognizes an N-terminal epitope centered on residues Phe4-Arg5-His6 (Fig. S4A), and the Fab fragment of 2H4 achieves a high degree of decoration of Aβ(1–42) fibrils, as demonstrated by negative-stain EM (Fig. 2 A and B). Cryo-EM imaging and 3D reconstruction of 2H4 Fab-decorated fibrils (Fig. 2 D and F) reveal Fab-derived density that protrudes from the fibril P domains (Fig. 2 C–F). Therefore, the peptide N-terminal segments form the fibril P domains, leaving the C-terminal segments to form the β-sheet structure within the C domain. The Fab-derived density is split into at least two main regions (Fig. 2G), suggesting that there are multiple N-terminal conformations of Aβ peptide that are recognized by 2H4 Fab. Different N-terminal conformations may be attributable, in part, to the high occupancy of Fabs along the fibrils, forcing the Fabs and bound peptides into conformations that avoid steric clashes between neighboring binding sites along the fibril. The conformational range seen in the Fab-decorated fibril may therefore exaggerate the range present in undecorated fibrils.
Fig. S4.

Epitope mapping of the Aβ-binding antibody 2H4. (A) The spot peptide binding assay of all different Aβ(1–42) sequences bound on a membrane incubated with N-terminal antibody 2H4. Spots 1–30 comprise all possible 13-mer fragments of Aβ(1–42) starting at the N terminus, spots 31–63 comprise all 10-mer fragments, spots 64–98 comprise all 8-mer fragments, and spots 99–135 comprise all 6-mer fragments. Spots highlighted with red frames show antibody binding to a corresponding peptide sequence. The recognized binding sequence for the antibody found in all bound fragments is FRH (framed). (B and C) Comparison of cross-sectional density of 2H4 Fab-decorated Aβ(1–42) fibrils with (B) and without (C) imposed twofold symmetry filtered to 15 Å.
Fig. 2.

Antibody Fab-based identification of the Aβ(1–42) N terminus. (A and B) Negative-stain EM images of Aβ(1–42) fibrils (A) and of fibrils decorated with 2H4 Fab (B). (C–F) Cryo-EM–based reconstructions of Aβ(1–42) fibrils (C and E) and of 2H4-Fab-decorated fibrils (D and F), shown in side views (C and D) or cross-sections (E and F) rendered at 15 Å. (G) Superimposition of the cross-section of a 2H4-Fab–decorated fibril (yellow) with the cross-section of the undecorated fibril (magenta) and ribbon diagrams of four Aβ-binding Fab fragments [Fab WO2 (17)]. Blue lines indicate the path of the peptide in the density with multiple possible conformations at the peptide N terminus to produce multiple binding sites. A–D are on the same scale.
The cross-sectional length of one leaflet within the C domain (∼7.5 nm; Fig. 1E) can accommodate between 23 and 26 amino acid residues in an extended β-sheet conformation (about 3.25 Å/residue). This value agrees with the number of residues in β-sheet conformation determined by hydrogen exchange and NMR measurements of oxidized Aβ(1–42) fibrils (18). The central role of the peptide C terminus for fibril assembly and stability is also demonstrated by peptide interference studies. Negative-stain EM (Fig. S5) demonstrates that full-length Aβ(1–42) forms fibrils within 2 d, if no peptide fragments were added to the solution or in the presence of fragments derived either from the N terminus or from the middle of the peptide. In contrast, addition of a peptide fragment derived from the Aβ(1–42) C terminus (residues 31–36) inhibits fibrillation under these conditions, and fibrillar aggregates are no longer detectable (Fig. S5). Thus, our localization of the peptide C termini at the dimer interface corresponds to the high sensitivity of the Aβ C terminus to fibrillation inhibitors (6, 7).
Fig. S5.

Peptide interference with fibril assembly. (A) Amino acid sequences of Aβ(1–42) and derived peptide fragments. (B) Negative-stain EM images showing the effect of different peptide fragments on Aβ(1–42) fibril formation with ratios of Aβ(1–42) peptide to fragments 1:1 and 1:10. C-terminal fragment Aβ(31–36) shows clear inhibition of fibril formation at a 1:10 ratio.
Molecular Model of the Fibril Core.
We performed restraint-driven molecular modeling to interpret the C domain density. We initiated the modeling procedure by building four Cα traces that fit the well-resolved zipper-like density within the fibril C domain and then extended the model toward the N and C termini. The amino acid residues extending toward the C terminus were placed in the well-resolved C domain density. However, the 11- or 12-aa residues extending toward the N terminus were placed in the P domain density, where the peptide could not be traced accurately (Fig. 3A). We included these residues in the modeling procedure to prevent model distortions during flexible fitting that would otherwise move other residues into this density. We varied the length and the path of the model through the narrow C-terminal arch and adjusted the N-terminal extension to give a total length of the Cα trace of 26-aa residues (Fig. S6A). The Cα traces were used as templates to build segments of Aβ(1–42) into the density (Fig. S6B).
Fig. 3.

Structural model of the Aβ(1–42) fibril. (A) Density superimposed with the family of models producing the best fit to our data. Models that did not account for clear density features or that produced highly unfavorable contacts were excluded from the list of possible models (Fig. S6 and Table S2). (B) Aβ(1–42) sequence and schematic of the packing of two Aβ(1–42) peptides with the zipper-like region framed. Positively charged amino acids are shown in blue and negatively charged ones in red. (C) Side view of the fibril density (transparent) superimposed with a backbone model of the fibril core (26 residues). Color scheme from blue to red denotes the N- to C-terminal orientation of the chain. (D) Fibril cross-section with dashed lines indicating the possible peptide path in the P domain. (E) Fibril slice corresponding to a stack of seven dimers. (F and G) Distribution of charged and uncharged amino acid residues in a space-filled model displaying all 42 residues. Yellow, uncharged residue; purple, charged residue. (F) Top view. (G) Side view. All models in this figure assume a nonstaggered assembly.
Fig. S6.

Peptide dimer models superimposed with the experimental density. (A) Four starting Cα traces (red, blue, orange, and cyan) were created (each 26 residues long), all following the central ordered density but with different paths and lengths at the C terminus. (B) These traces were used as templates to create models with different peptide fragment registers (15–40, 16–41, and 17–42). Only refined nonstaggered models are shown. Models shown in Fig. 3A are Red 17–42, Blue 16–41, and Orange 15–40.
We investigated 12 twofold symmetric (nonstaggered) as well as 12 coaxial 21-screw symmetric (staggered) models of the cross-β sheets by varying the sequence register within the four original Cα traces (Table S2). Starting with these 24 initial models, we excluded models that (i) placed a glycine at a position where we see clear side chain density protruding into the solvent, (ii) placed side chains into the very center of the fibril that features a prominent low-density region, or (iii) created highly unfavorable contacts by placing the side chain of lysine 28 into a hydrophobic pocket formed by the dimer. Three staggered and three nonstaggered models remained. All six models placed the same sequence segment (residues 31–36) into the zipper-like segment (Fig. 3A). Models were also scored according to common stereochemical and steric criteria, as well as correlation with the density map (Table S2). Because of the limited resolution, particularly in the direction of the fibril axis, differences in the correlation coefficients for different models could not be used to distinguish staggered and nonstaggered models.
Table S2.
Model values for Ramachandran plot, MolProbity, Cβ deviations, and cross correlation
| Model name | Ramachandran | MolProbity score | Cβ deviations, % | Cross correlation score | |
| Favored, % | Outliers, % | ||||
| Red 17–42 | 91.3 (88.77) | 0.0 (0.72) | 1.41 (1.43) | 0.4 (0.79) | 0.87 (0.86) |
| Red 16–41 | 82.61 (82.97) | 0.72 (2.17) | 3.16 (2.77) | 1.98 (1.19) | 0.87 (0.86) |
| Red 15–40 | 91.3 (82.97) | 0.0 (2.54) | 1.98 (2.18) | 0.00 (0.00) | 0.88 (0.88) |
| Blue 17–42 | 94.2 (90.58) | 0.0 (0.36) | 1.46 (1.3) | 0.79 (1.59) | 0.84 (0.84) |
| Blue 16–41 | 73.19 (75.0) | 2.17 (2.17) | 1.58 (1.66) | 0.00 (0.79) | 0.82 (0.82) |
| Blue 15–40 | 86.23 (88.41) | 4.35 (1.09) | 2.54 (1.84) | 5.95 (5.16) | 0.88 (0.88) |
| Orange 17–42 | 76.81 (77.17) | 8.33 (7.25) | 2.36 (1.97) | 1.19 (0.79) | 0.84 (0.84) |
| Orange 16–41 | 74.64 (73.91) | 2.54 (1.81) | 1.97 (2.3) | 1.19 (1.98) | 0.85 (0.85) |
| Orange 15–40 | 78.26 (73.19) | 8.70 (4.71) | 2.22 (2.3) | 0.79 (5.56) | 0.84 (0.84) |
| Cyan 17–42 | 83.70 (84.06) | 0.72 (0.36) | 2.52 (2.29) | 1.19 (2.38) | 0.84 (0.84) |
| Cyan 16–41 | 80.43 (78.26) | 5.8 (5.8) | 2.04 (2.00) | 1.19 (1.19) | 0.86 (0.86) |
| Cyan 15–40 | 89.86 (89.13) | 0.36 (0.0) | 1.73 (1.29) | 5.16 (0.00) | 0.84 (0.84) |
Scores for minimized cluster representatives (scores for staggered models are in parentheses). MolProbity score combines clashscore, rotamer outliers, and Ramachandran evaluations (36). Rotamer outliers indicate how far side chain rotamers are from a “protein-like” configuration. Clashscore is defined as the number of unfavorable all-atom steric overlaps ≥0.4 Å per 1,000 atoms (40). Ramachandran favored/outliers indicate how far the dihedral angles ψ and Φ of the model residues are from a protein-like configuration. Cβ deviations indicate net distortion of bond angles around Cα. Cross-correlation quantifies the fit of a model with the density map. Models shown in Fig. 3A are Red 17–42, Blue 16–41, and Orange 15–40.
We also analyzed the Aβ-derived steric zippers available within the Protein Data Bank (www.rcsb.org) and the ZipperDB database (services.mbi.ucla.edu/zipperdb/intro) for the fit of the zippers to our density (19, 20). Among these 34 zipper structures, only one fitted the density of the zipper-like region (Fig. S3). Remarkably, this zipper comprises precisely the same hexapeptide sequence predicted by our modeling to occupy the core zipper-like region. Because the zipper structure was not used as a constraint in the modeling procedure, this finding provides independent justification for our structural assignment.
Our models account for most of the density ascribed to the peptide backbone in the leaflet region (Fig. 1E) but leave many of the density features pointing into the solvent unexplained. These features appear to be too large to correspond solely to amino acid side chains. It is likely that the high-ordering characteristic of the cross-β structure formed by the main chain does not fully extend to the side chains, which may assume different conformations along the fibril. Additionally, we showed in an earlier study (12) that additional peptide likely binds to the solvent-exposed sides of the fibrils under the fibril growth conditions we used, generating extra mass and density. The conformational disorder of the side chains, together with additional density from bound peptide, can be expected to alter the density in the region of the protruding features in our map and may account for some of the discrepancy between our model and the density.
We extended our 26-C-terminal-residue model toward the peptide N terminus to generate a fibril model for the full-length Aβ(1–42) peptide (Fig. S7A). Because of the weaker density in the P domains of the fibril, the path of the peptide N terminus is less certain than that of the C terminus, but our model is consistent with a number of experimental observations. Two-dimensional projections of the N-terminally extended model agree well with the reconstructed density map as well as with the original cryo-EM data (Fig. S7B). The twofold symmetry of the fibril is consistent with face-to-face packing (as opposed to a face-to-back assembly) of the peptide, as shown in our model. Packing of the dimer occurs along the longest uncharged β-sheet face of Aβ(1–42) peptide that extends over the odd-numbered residues from position 25–41 (Fig. 3B). This segment is flanked by the peptide C terminus and the charged residues Glu22 and Asp23. Its center is formed by the zipper-like region. Zipper-like structural elements were originally observed in microcrystals of smaller peptide fragments and hypothesized to form the structural spines of amyloid fibrils (20). Our electron density map confirms this conjecture and directly demonstrates zipper-like packing in the context of a fibril formed from full-length peptide.
Fig. S7.

Comparison of 2D projections. (A) Fully refined Red (17–42) Aβ model from Fig. S6 with manually extended N terminus to account for as much of the reconstructed density as possible and allow direct comparison of projections calculated from the model and reconstruction with the raw images. Manual building was performed using UCSF Chimera’s Structure Editing tool, followed by Adjust Torsion (32). (B) Different projection views of the density derived from the Aβ(1–42) model in A, low-pass–filtered to 5 Å (top row); projections of the reconstruction, filtered to 5 Å (middle row); and raw cryo-EM images, low-pass–filtered to 5 Å (bottom row). Projections were calculated using SPIDER (39).
Our model is also compatible with Aβ’s amphiphilic properties and wedge-shaped structure (Fig. 3B). The N-terminal half of Aβ(1–42) comprises nine charged residues and has an average amino acid mass of 137.8 Da. The C-terminal half contains three charged residues and has an average amino acid mass of 112.4 Da. Therefore, the more hydrophobic fibril core containing the C termini is surrounded by bulkier and more ionizable N-terminal residues at more peripheral positions, helping to separate these residues from each other within the twisted fibril (Fig. 3 D and E). The tilde-shaped folding of the C termini helps further to reduce the solvent-exposed hydrophobic surface area, and the narrow arch agrees with data identifying such a conformation at residues 36 and 37 of Aβ(1–42) (21).
Discussion
As detailed in Molecular Model of the Fibril Core, our cryo-EM–derived model is consistent with the general chemical characteristics of Aβ and known structural, biochemical, and biophysical properties of Aβ fibrils as listed in Table S3. Multiple NMR-derived models have been suggested in recent years. Our cryo-EM–derived model differs from several earlier models that assumed a U-shaped peptide conformation in the fibril (18, 22) but is in agreement with recent NMR evidence showing that the conformation of the peptide in Aβ fibrils may adopt a dimeric structure (23, 24). These inconsistencies may be the result of different protocols used to prepare the fibrils, which are known to form different protocol-dependent morphologies. Our model can also be reconciled with key biological observations on the role of Aβ in neurodegeneration:
-
i)
The location of the peptide C termini at the dimer interface and within the fibril cross-β structure is consistent with the high sensitivity of the Aβ C terminus to fibrillation inhibitors (6, 7).
-
ii)
The weak density of the N termini in our map and the multiple 2H4 Fab-binding sites conform to the known structural heterogeneity of the peptide N termini, as suggested by an accelerated hydrogen exchange, proteolytic degradation, and the N terminus' high susceptibility to antibody binding (7, 18, 25, 26).
-
iii)
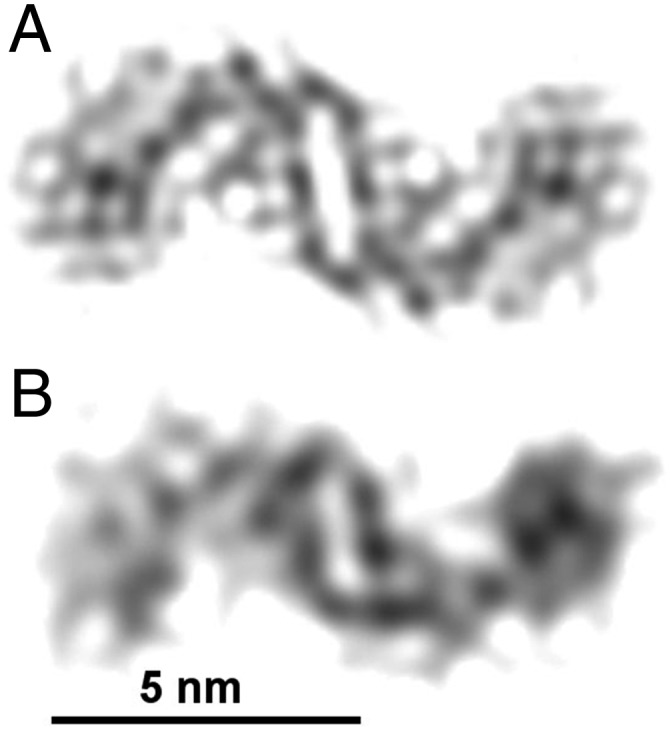
Comparison of our current data with a previously published reconstruction of an Aβ(1–40) fibril (Fig. 4) shows that the dimer interface is notably kinked and longer in the Aβ(1–42) fibril (7.3 nm) compared with Aβ(1–40) (5.3 nm; Fig. 4). That is, the Aβ(1–42) fibril exhibits increased peptide–peptide interactions across the dimer interface compared with the Aβ(1–40) fibril, which is in agreement with the higher aggregation propensity of Aβ(1–42) (3).
-
iv)
The difference in dimer packing interfaces in Aβ(1–40) and Aβ(1–42) fibrils agrees with the limited ability of the two peptide variants to form mixed fibrils in vitro (4).
-
v)
Our model predicts that the charged residues Glu22 and Asp23 prevent more favorable packing at the dimer interface (Fig. 3 A and B). These residues coincide with one of Aβ’s major mutagenic sites that lead to familial AD. Therefore, our model offers an explanation for why mutations that lead to removal of these charges can accelerate aggregation and provoke early onset familial AD (5).
-
vi)
Our observation of fibril substructures formed by Aβ(1–40) and Aβ(1–42) dimers implies that fibrils form via intermediates or nuclei that consist of 2n peptide molecules. This notion is consistent with several studies reporting an even number of peptide molecules involved in the formation of particularly toxic fibrillation intermediates (1, 3, 27).
Table S3.
Comparison of the model with Aβ fibrils properties
| Comparison | Reflected in the model |
| Chemical property of Aβ* | |
| Amphiphilic structure of Aβ: the N-terminal half of Aβ(1–42) is more charged than the C-terminal half. | The hydrophobic C termini form the fibril core, whereas the N termini are at outer radial positions and help isolate the hydrophobic core from the solvent. |
| Wedge shape of the peptide sequence: C-terminal residues are smaller than N-terminal residues. | The more bulky N-terminal residues occur at outer radial positions such that they become separated by the twist of the fibril. |
| The largest uncharged face of the peptide extends between the odd numbered residues 25–41. | The peptide face formed by the even numbered residues 25–41 constitutes the dimer interface of our model. |
| The Aβ C terminus is hydrophobic. | A bent conformation and packing of the dimer helps to bury hydrophobic surface area. |
| Aβ fibril properties† | |
| The β-strand structure occurs within the C-terminal 25 residues of oxidized Aβ(1–42) fibrils (18). | The length of the leaflet structure can accommodate between 23 and 26 C-terminal residues in β-sheet conformation. |
| Fibrils show cross-β spacings of ∼4.7 and 10 Å (12, 41). | The model implements the 4.7 Å spacing between layers of peptides, as well as the 10 Å spacing between the leaflets. |
| The N terminus is more sensitive to hydrogen exchange and proteolysis than the peptide C terminus (18, 25, 26). | The C terminus is buried within in the fibril core while the N terminus is solvent-exposed and disordered, generating weak density. |
| Aβ(1–42) adopts a kinked conformation at residues 36–37 (21). | The model contains an arch structure that includes residues 36–40. |
| NMR data indicates a peptide dimer in the fibril (23, 24). | A peptide dimer represents the fundamental structural unit of the fibril. |
| Steric zippers may be the basis of amyloid fibril structures (19, 20). | A zipper-like region occurs at the fibril center. |
| Residues 31–36 of Aβ are able to form a steric zipper (42, 43) | A zipper of residues 31–36 matches the zipper-like region of our fibril. |
| Biological data on A⇠| |
| Aβ(1–42) peptide is more amyloidogenic and prone to form fibrils than Aβ(1–40) (3, 44). | The interface of the Aβ(1–42) dimer is longer and enables more favorable interactions than in the Aβ(1–40) dimer. |
| Aβ(1–42) and Aβ(1–40) peptides present a limited capacity to form mixed fibrils (4). | The two peptides prefer different fibril conformations. |
| Removal of charged residues 22 and 23 by genetic mutation can accelerate aggregation and provokes early onset familial AD (5, 45–47). | Charged residues at this site disturb more favorable packing of the dimer. |
| The Aβ C terminus is highly susceptible to inhibitory strategies (6, 48). | The C terminus forms the fibril cross-β conformation. |
| Toxic fibrillation intermediates frequently consist of 2n peptide molecules (1, 3, 27, 49). | The fibrillar end products of assembly consists of peptide dimers. |
Comparison of the model with general chemical properties of Aβ.
Comparison of the model with published structural properties of Aβ fibrils.
Comparison of the model with published biological data on Aβ.
Fig. 4.

Peptide dimer conformations in Aβ(1–42) and Aβ(1–40) fibrils. Cross-sections of the single-protofilament Aβ(1–42) fibril density from the current study and of the two-protofilament Aβ(1–40) fibril (13), both rendered at 7-Å resolution. Cyan, blue, and yellow: symmetrical and asymmetrical peptide dimers. The red lines represent the dimer interfaces that extend over 7.3 nm in the Aβ(1–42) fibril and over 5.3 nm in the Aβ(1–40) protofilament.
The Aβ(1–42) dimer architecture presented here suggests that the general chemical properties driving the folding of globular proteins (hydrophobicity and charge distribution) also determine the general architecture of Aβ amyloid fibrils and, presumably, smaller oligomers. The structure explains how a difference in peptide length of only two amino acids can lead to different fibril morphologies and can readily be reconciled with a large number of chemical, structural, and biological characteristics of Aβ (Table S3).
Materials and Methods
Fibril Preparation.
Synthetic Aβ(1–42) peptide was obtained from BACHEM (12). Fibrils were formed at 1 mg/mL concentration by incubation in 50 mM Tris⋅HCl (pH 7.4), at room temperature for a minimum of 12 h.
EM.
Samples were prepared and processed as described elsewhere (12, 13). Fibrils were imaged under low-dose conditions (28 e−/Å2) on Kodak SO-163 film with a Tecnai F30 microscope at 300 kV, operated at 1.75 to 3 μm underfocus.
Image Processing.
The micrographs were digitized using a Zeiss SCAI flatbed scanner with a raster size of 7 μm, resulting in a pixel size of 1.2 Å. Fibrils were selected according to morphology, length, straightness, and crossover distance (28). The crossovers of 163 fibrils with 110 ± 7 nm crossover distance were marked using EMAN’s boxer program (29). In early processing, data were resampled to a pixel size of 4.8 Å to increase the speed of refinement. Later refinement was done at 1.2 Å per pixel. Three-dimensional reconstructions were computed and refined from the micrographs using Frealix (16). All studied fibrils appeared polar, and their polarity was determined to ensure correct alignment. The reconstructions of each of the 163 fibrils were inspected visually to select 29 fibrils with the most consistent morphologies and lowest alignment errors. The in-plane shifts and rotation parameters, as well as out-of-plane tilts and helical twist angles, were restrained during the alignment, as described elsewhere (16). The specimen out-of-plane tilt angle was measured using CTFTILT (30). For the reconstruction, we imposed helical symmetry with a rotation of −0.769° per repeat and twofold symmetry. This twofold symmetry assumption was based on previous analysis (12) and verified again with an asymmetric reconstruction (Fig. S1). Table S1 contains additional details on the image processing. We used as a starting model for refinement a previous reconstruction (12) at 15-Å resolution. A FRC curve (Fig. S2) was calculated by Frealix as described by Rohou and Grigorieff (16) to estimate the resolution of the reconstruction. To avoid overfitting, we only used frequencies with high estimated signal-to noise (FRC > 0.8) during refinement. The highest frequency used during the final rounds of refinement was 10 Å. Using a threshold of FRC = 0.143 (31), we measure an overall resolution of about 7 Å (Table S1). This resolution estimate is an average that includes the more disordered density at the fibril periphery (P domains) and the better-ordered density in the fibril core. We estimate the resolution in the fibril core to be about 5 Å because the characteristic zigzag pattern of a pleated β-sheet is not visible at lower resolution. A similar resolution was also estimated by calculating an FRC curve for the masked fibril core (Fig. S2). The Fab-decorated fibrils were processed in a similar fashion using 13 selected fibrils. The symmetry was also verified with an asymmetric reconstruction (Fig. S4 B and C).
Epitope Mapping.
A prepared cellulose membrane with 135 spots of all possible sequences in different size of the Aβ(1–42) peptide bound to the membrane was used. Spots 1–30 contained 13-aa-long peptides, spots 31–98 contained 10-aa-long peptides, and spots 99–135 contained 6-aa-long peptides of the Aβ(1–42) peptides. The sequences of same-length peptides changed 1 aa to the next spot until the all possible sequences of Aβ(1–42) were represented. The membrane was washed in Tris-buffered saline with Tween 20 (TBST) [50 mM Tris (pH 7.5); 150 mM NaCl; 0.2% Tween 20] and blocked for 10 min with TBST containing 3% (wt/vol) milk powder. The membrane was then incubated with 2H4 antibody (0.05 ng/mL) in TBST with 3% (wt/vol) milk powder for 2 h and washed three times afterward in TBST. The membrane was then incubated for 1 h with the secondary anti-mouse horseradish peroxidase-conjugated antibody (0.05 ng/mL) in TBST 3% (wt/vol) milk powder and washed three times. The spot with bound 2H4 antibody was visualized via the peroxidase of secondary antibody using chemiluminescence with an ECL system (enhanced chemiluminescence; Amersham Pharmacia).
Preparation and Binding of 2H4 Fab Fragments.
ImmunoPure Fab-Preparation-Kit (Pierce) was used for Fab fragment purification. The dissolved 2H4 antibody [beta amyloid (1–8) monoclonal antibody (SIGNET)] was incubated with an immobilized papain gel for 5 h in a water bath at 37 °C while shaking continuously. After separating the cleavage mixture from the papain beads, the Fc fragment remained on the Protein A affinity column, while the Fab fragment was collected in the eluate. The eluate was dialyzed against PBS buffer overnight and subsequently concentrated to 1 mg/mL. Fibrils were grown as described under Fibril Preparation. Fab binding was achieved by incubating fibrils with 2H4-Fab on ice for 1 h with 1:1 molar ratio of Aβ(1–42) protein:Fab fragment. Unbound Fab fragments were removed with a microconcentrator (cutoff: 100 kDa; Millipore), which included washing four times with 50 mM Tris⋅HCl (pH 7.4) and subsequent spinning at 1,500 × g in a tabletop microcentrifuge (Eppendorf) for 5 min.
Peptide Interference.
To assess the effect of three Aβ-derived peptide fragments (FRHDSGY, QKLVFF, and WIIGLMVK) on fibril formation, the Aβ(1–42) peptide was incubated in the absence or presence of different concentrations of inhibitor peptides. The inhibition was monitored by transmission electron microscopy. Solutions of 20 μM Aβ(1–42) in 50 mM sodium phosphate buffer (pH 7.4) containing one of the three peptide fragments at a time at a concentration of 20 and 200 μM were prepared. After incubation for 2 d at 37 °C, the samples were examined with negative-stain EM using a Zeiss 900 electron microscope at 80 kV.
Molecular Modeling.
We performed molecular modeling to test the plausibility of our fibril model consisting of peptide dimers that pair at their C termini. To initiate possible models, we used UCSF Chimera (32), protein visualization and analysis software, to manually build four different Cα traces that fit the leaflet density within the fibril C domain (Fig. S6). We built these traces based on our interpretation of the best-defined part of the leaflet density as a symmetrical dimer of six-residue β-strand peptides (Fig. 1E). Each six-residue peptide was then C-terminally extended to fit the narrow arch structure as indicated by the continuous line in Fig. 1E. We constructed four Cα traces (Fig. S6A, red, blue, cyan, and orange) to allow two principal ways to fit the Cα trace into the narrow arch (red and blue vs. orange and cyan) and to allowed the Cα traces to vary in their C-terminal length (red longer than blue; orange longer than cyan). The N terminus was extended in all four traces to generate models consisting of a total of 26 residues each.
In a second step, we considered three different peptide registers for each of the Cα traces, such that the Cα atoms correspond to either residues 15–40, 16–41, or 17–42 of the Aβ(1–42) sequence. Variation of the C-terminal residues allows for the possibility of weak or missing density at the peptide C terminus because of flexibility or disorder. We did not model longer fragments at this stage because of significant disorder and lack of clearly resolved features visible in the P domain; however, we ensured that all tested peptide registers left enough N-terminal peptide to account for the density within the P domain. Assigning three possible peptide registers to each of the four Cα traces generated a total of 12 possible arrangements. Finally, using Pulchra (33), we built full atomic models, each 26 residues long, of all 12 arrangements and constructed six-layer full-atom peptide stacks that conformed to the helical fibril symmetry assuming either a nonstaggered or a staggered arrangement.
We then used DireX (34), efficient geometry-based structural refinement software, to flexibly fit the six-layer peptide stacks into a 38-Å-thick segment of the reconstructed fibril density. The following restraints were applied: (i) all 12 copies of the peptide in the fibril segment exhibit similar conformations (35) by applying noncrystallographic symmetry restraints to keep the individual peptides in identical or similar conformation during the refinement of the fibril; (ii) the distances between Cα atoms of the same amino acid in neighboring peptide chains along the fibril axis are close to 4.7 Å (35) (by restraining the distances between Cα atoms of corresponding amino acids at neighboring peptide chains to 4.7 Å); (iii) the coordinates of the three Cα atoms that occur within the best-defined part of the density remain close to their starting locations (Fig. 1E) by restraining the position of these Cα atoms; and (iv) the refined structure should be stereochemically sound. To allow sufficient sampling of possible conformations, we generated 720 DireX fitting parameter settings with varying strengths of the restraints. For each set of parameters, we ran DireX refinement three times, each starting from a different random local perturbation of the initial fibril model. To reduce the influence of the weaker and less-resolved P domain density in the fitting process, we partially removed this density with a cylindrical mask (radius, 32 Å). A gradual falloff of the edge of the mask was modeled with a cosine function, and two different widths of the cosine function were tested. Varying the fitting parameters, the local perturbation of the initial fibril model, and the masking options resulted in 4,320 (720 × 3 × 2) refinement runs for each of the 12 initial fibril models. The resulting 4,320 models were clustered according to their all-atom root mean square deviation. We selected cluster representatives for each of the 12 arrangements based on MolProbity scores (36). Subsequently, we performed energy minimization for each cluster representative using GROMACS 4.6.3 (37) and AMBER03 (38) force field to generate the 12 final models displayed in Fig. S6B. For these twelve models, we calculated the MolProbity score and Ramachandran favored and outlier residues (Table S2). All of these models assume the peptide dimers to be present in one plane. Therefore, we tested the possibility of a staggered configuration of the cross-β leaflets by repeating the minimization step for all final models after displacing one leaflet relative to the other by 2.4 Å (half a cross-β repeat) along the fibril axis. For comparison with the nonstaggered configurations, the MolProbity scores were also calculated for the staggered configurations (Table S2).
Acknowledgments
We thank Dr. Miroslav Malesevic for help with peptide synthesis, Gunnar Schröder for help with DireX, and A. Caflisch and A. Vitalis for helpful discussions. N.G. acknowledges financial support from National Institutes of Health Grant 1 P01 GM-62580. This work was supported by German Research Foundation Grants FA456/12-1 and SFB610 NO1. K.L. was supported by the Gordon and Betty Moore Foundation through Grant GBMF 2550.03 to the Life Sciences Research Foundation and by the Weizmann Institute of Science–National Postdoctoral Award Program for Advancing Women in Science.
Footnotes
The authors declare no conflict of interest.
This article is a PNAS Direct Submission.
Data deposition: The Cryo-EM map has been deposited in the Electron Microscopy Data Bank (EMDB), www.ebi.ac.uk/pdbe/emdb/ (accession no. 3132). The atomic models referred to as Red 17–42, Blue 16–41, and Orange 15–40 in the text have been deposited in the Protein Data Bank, www.pdb.org (PDB ID code 5AEF).
This article contains supporting information online at www.pnas.org/lookup/suppl/doi:10.1073/pnas.1503455112/-/DCSupplemental.
References
- 1.Walsh DM, Selkoe DJ. A beta oligomers - A decade of discovery. J Neurochem. 2007;101(5):1172–1184. doi: 10.1111/j.1471-4159.2006.04426.x. [DOI] [PubMed] [Google Scholar]
- 2.Spires-Jones TL, Hyman BT. The intersection of amyloid beta and tau at synapses in Alzheimer’s disease. Neuron. 2014;82(4):756–771. doi: 10.1016/j.neuron.2014.05.004. [DOI] [PMC free article] [PubMed] [Google Scholar]
- 3.Haass C, Selkoe DJ. Soluble protein oligomers in neurodegeneration: Lessons from the Alzheimer’s amyloid beta-peptide. Nat Rev Mol Cell Biol. 2007;8(2):101–112. doi: 10.1038/nrm2101. [DOI] [PubMed] [Google Scholar]
- 4.Cukalevski R, et al. The Aβ40 and Aβ42 peptides self-assemble into separate homomolecular fibrils in binary reactions but cross-react during primary nucleation. Chem Sci. 2015;6(7):4215–4233. doi: 10.1039/c4sc02517b. [DOI] [PMC free article] [PubMed] [Google Scholar]
- 5.Finder VH, Glockshuber R. Amyloid-beta aggregation. Neurodegener Dis. 2007;4(1):13–27. doi: 10.1159/000100355. [DOI] [PubMed] [Google Scholar]
- 6.Fradinger EA, et al. C-terminal peptides coassemble into Abeta42 oligomers and protect neurons against Abeta42-induced neurotoxicity. Proc Natl Acad Sci USA. 2008;105(37):14175–14180. doi: 10.1073/pnas.0807163105. [DOI] [PMC free article] [PubMed] [Google Scholar]
- 7.Härd T, Lendel C. Inhibition of amyloid formation. J Mol Biol. 2012;421(4-5):441–465. doi: 10.1016/j.jmb.2011.12.062. [DOI] [PubMed] [Google Scholar]
- 8.Grigorieff N. Direct detection pays off for electron cryo-microscopy. eLife. 2013;2:e00573. doi: 10.7554/eLife.00573. [DOI] [PMC free article] [PubMed] [Google Scholar]
- 9.Jiménez JL, et al. Cryo-electron microscopy structure of an SH3 amyloid fibril and model of the molecular packing. EMBO J. 1999;18(4):815–821. doi: 10.1093/emboj/18.4.815. [DOI] [PMC free article] [PubMed] [Google Scholar]
- 10.Fitzpatrick AW, et al. Atomic structure and hierarchical assembly of a cross-β amyloid fibril. Proc Natl Acad Sci USA. 2013;110(14):5468–5473. doi: 10.1073/pnas.1219476110. [DOI] [PMC free article] [PubMed] [Google Scholar]
- 11.White HE, et al. Globular tetramers of beta(2)-microglobulin assemble into elaborate amyloid fibrils. J Mol Biol. 2009;389(1):48–57. doi: 10.1016/j.jmb.2009.03.066. [DOI] [PMC free article] [PubMed] [Google Scholar]
- 12.Schmidt M, et al. Comparison of Alzheimer Abeta(1-40) and Abeta(1-42) amyloid fibrils reveals similar protofilament structures. Proc Natl Acad Sci USA. 2009;106(47):19813–19818. doi: 10.1073/pnas.0905007106. [DOI] [PMC free article] [PubMed] [Google Scholar]
- 13.Sachse C, Fändrich M, Grigorieff N. Paired beta-sheet structure of an Abeta(1-40) amyloid fibril revealed by electron microscopy. Proc Natl Acad Sci USA. 2008;105(21):7462–7466. doi: 10.1073/pnas.0712290105. [DOI] [PMC free article] [PubMed] [Google Scholar]
- 14.Zhang R, et al. Interprotofilament interactions between Alzheimer’s Abeta1-42 peptides in amyloid fibrils revealed by cryoEM. Proc Natl Acad Sci USA. 2009;106(12):4653–4658. doi: 10.1073/pnas.0901085106. [DOI] [PMC free article] [PubMed] [Google Scholar]
- 15.Fändrich M, Schmidt M, Grigorieff N. Recent progress in understanding Alzheimer’s β-amyloid structures. Trends Biochem Sci. 2011;36(6):338–345. doi: 10.1016/j.tibs.2011.02.002. [DOI] [PMC free article] [PubMed] [Google Scholar]
- 16.Rohou A, Grigorieff N. Frealix: Model-based refinement of helical filament structures from electron micrographs. J Struct Biol. 2014;186(2):234–244. doi: 10.1016/j.jsb.2014.03.012. [DOI] [PMC free article] [PubMed] [Google Scholar]
- 17.Miles LA, et al. Amyloid-beta-anti-amyloid-beta complex structure reveals an extended conformation in the immunodominant B-cell epitope. J Mol Biol. 2008;377(1):181–192. doi: 10.1016/j.jmb.2007.12.036. [DOI] [PubMed] [Google Scholar]
- 18.Lührs T, et al. 3D structure of Alzheimer’s amyloid-beta(1-42) fibrils. Proc Natl Acad Sci USA. 2005;102(48):17342–17347. doi: 10.1073/pnas.0506723102. [DOI] [PMC free article] [PubMed] [Google Scholar]
- 19.Sawaya MR, et al. Atomic structures of amyloid cross-beta spines reveal varied steric zippers. Nature. 2007;447(7143):453–457. doi: 10.1038/nature05695. [DOI] [PubMed] [Google Scholar]
- 20.Colletier JP, et al. Molecular basis for amyloid-beta polymorphism. Proc Natl Acad Sci USA. 2011;108(41):16938–16943. doi: 10.1073/pnas.1112600108. [DOI] [PMC free article] [PubMed] [Google Scholar]
- 21.Roychaudhuri R, et al. C-terminal turn stability determines assembly differences between Aβ40 and Aβ42. J Mol Biol. 2013;425(2):292–308. doi: 10.1016/j.jmb.2012.11.006. [DOI] [PMC free article] [PubMed] [Google Scholar]
- 22.Tycko R. Solid-state NMR studies of amyloid fibril structure. Annu Rev Phys Chem. 2011;62:279–299. doi: 10.1146/annurev-physchem-032210-103539. [DOI] [PMC free article] [PubMed] [Google Scholar]
- 23.Lopez del Amo JM, et al. An asymmetric dimer as the basic subunit in Alzheimer’s disease amyloid β fibrils. Angew Chem Int Ed Engl. 2012;51(25):6136–6139. doi: 10.1002/anie.201200965. [DOI] [PubMed] [Google Scholar]
- 24.Schutz AK, et al. Atomic-resolution three-dimensional structure of amyloid β fibrils bearing the Osaka mutation. Angew Chem Int Ed Engl. 2015;54(1):331–335. doi: 10.1002/anie.201408598. [DOI] [PMC free article] [PubMed] [Google Scholar]
- 25.Kheterpal I, Williams A, Murphy C, Bledsoe B, Wetzel R. Structural features of the Abeta amyloid fibril elucidated by limited proteolysis. Biochemistry. 2001;40(39):11757–11767. doi: 10.1021/bi010805z. [DOI] [PubMed] [Google Scholar]
- 26.Török M, et al. Structural and dynamic features of Alzheimer’s Abeta peptide in amyloid fibrils studied by site-directed spin labeling. J Biol Chem. 2002;277(43):40810–40815. doi: 10.1074/jbc.M205659200. [DOI] [PubMed] [Google Scholar]
- 27.Garzon-Rodriguez W, Sepulveda-Becerra M, Milton S, Glabe CG. Soluble amyloid Abeta-(1-40) exists as a stable dimer at low concentrations. J Biol Chem. 1997;272(34):21037–21044. doi: 10.1074/jbc.272.34.21037. [DOI] [PubMed] [Google Scholar]
- 28.Sachse C, et al. High-resolution electron microscopy of helical specimens: A fresh look at tobacco mosaic virus. J Mol Biol. 2007;371(3):812–835. doi: 10.1016/j.jmb.2007.05.088. [DOI] [PMC free article] [PubMed] [Google Scholar]
- 29.Ludtke SJ, Baldwin PR, Chiu W. EMAN: Semiautomated software for high-resolution single-particle reconstructions. J Struct Biol. 1999;128(1):82–97. doi: 10.1006/jsbi.1999.4174. [DOI] [PubMed] [Google Scholar]
- 30.Mindell JA, Grigorieff N. Accurate determination of local defocus and specimen tilt in electron microscopy. J Struct Biol. 2003;142(3):334–347. doi: 10.1016/s1047-8477(03)00069-8. [DOI] [PubMed] [Google Scholar]
- 31.Rosenthal PB, Henderson R. Optimal determination of particle orientation, absolute hand, and contrast loss in single-particle electron cryomicroscopy. J Mol Biol. 2003;333(4):721–745. doi: 10.1016/j.jmb.2003.07.013. [DOI] [PubMed] [Google Scholar]
- 32.Pettersen EF, et al. UCSF Chimera--A visualization system for exploratory research and analysis. J Comput Chem. 2004;25(13):1605–1612. doi: 10.1002/jcc.20084. [DOI] [PubMed] [Google Scholar]
- 33.Rotkiewicz P, Skolnick J. Fast procedure for reconstruction of full-atom protein models from reduced representations. J Comput Chem. 2008;29(9):1460–1465. doi: 10.1002/jcc.20906. [DOI] [PMC free article] [PubMed] [Google Scholar]
- 34.Schröder GF, Brunger AT, Levitt M. Combining efficient conformational sampling with a deformable elastic network model facilitates structure refinement at low resolution. Structure. 2007;15(12):1630–1641. doi: 10.1016/j.str.2007.09.021. [DOI] [PMC free article] [PubMed] [Google Scholar]
- 35.Bekker H, Berendsen HJC, Vangunsteren WF. Force and virial of torsional-angle-dependent potentials. J Comput Chem. 1995;16(5):527–533. [Google Scholar]
- 36.Chen VB, et al. MolProbity: All-atom structure validation for macromolecular crystallography. Acta Crystallogr D Biol Crystallogr. 2010;66(Pt 1):12–21. doi: 10.1107/S0907444909042073. [DOI] [PMC free article] [PubMed] [Google Scholar]
- 37.Berendsen HJC, Vanderspoel D, Vandrunen R. GROMACS: A message-passing parallel molecular dynamics implementation. Comput Phys Commun. 1995;91(1-3):43–56. [Google Scholar]
- 38.Duan Y, et al. A point-charge force field for molecular mechanics simulations of proteins based on condensed-phase quantum mechanical calculations. J Comput Chem. 2003;24(16):1999–2012. doi: 10.1002/jcc.10349. [DOI] [PubMed] [Google Scholar]
- 39.Frank J, et al. SPIDER and WEB: Processing and visualization of images in 3D electron microscopy and related fields. J Struct Biol. 1996;116(1):190–199. doi: 10.1006/jsbi.1996.0030. [DOI] [PubMed] [Google Scholar]
- 40.Word JM, Lovell SC, Richardson JS, Richardson DC. Asparagine and glutamine: Using hydrogen atom contacts in the choice of side-chain amide orientation. J Mol Biol. 1999;285(4):1735–1747. doi: 10.1006/jmbi.1998.2401. [DOI] [PubMed] [Google Scholar]
- 41.Jahn TR, et al. The common architecture of cross-beta amyloid. J Mol Biol. 2010;395(4):717–727. doi: 10.1016/j.jmb.2009.09.039. [DOI] [PubMed] [Google Scholar]
- 42. ZipperDB. Available at services.mbi.ucla.edu/zipperdb/intro. Accessed November 5th, 2013.
- 43.Goldschmidt L, Teng PK, Riek R, Eisenberg D. Identifying the amylome, proteins capable of forming amyloid-like fibrils. Proc Natl Acad Sci USA. 2010;107(8):3487–3492. doi: 10.1073/pnas.0915166107. [DOI] [PMC free article] [PubMed] [Google Scholar]
- 44.Harper JD, Lansbury PT., Jr Models of amyloid seeding in Alzheimer’s disease and scrapie: Mechanistic truths and physiological consequences of the time-dependent solubility of amyloid proteins. Annu Rev Biochem. 1997;66:385–407. doi: 10.1146/annurev.biochem.66.1.385. [DOI] [PubMed] [Google Scholar]
- 45.Kirkitadze MD, Condron MM, Teplow DB. Identification and characterization of key kinetic intermediates in amyloid beta-protein fibrillogenesis. J Mol Biol. 2001;312(5):1103–1119. doi: 10.1006/jmbi.2001.4970. [DOI] [PubMed] [Google Scholar]
- 46.Nilsberth C, et al. The ‘Arctic’ APP mutation (E693G) causes Alzheimer’s disease by enhanced Abeta protofibril formation. Nat Neurosci. 2001;4(9):887–893. doi: 10.1038/nn0901-887. [DOI] [PubMed] [Google Scholar]
- 47.Murakami K, et al. Neurotoxicity and physicochemical properties of Abeta mutant peptides from cerebral amyloid angiopathy: Implication for the pathogenesis of cerebral amyloid angiopathy and Alzheimer’s disease. J Biol Chem. 2003;278(46):46179–46187. doi: 10.1074/jbc.M301874200. [DOI] [PubMed] [Google Scholar]
- 48.Perchiacca JM, Ladiwala AR, Bhattacharya M, Tessier PM. Structure-based design of conformation- and sequence-specific antibodies against amyloid β. Proc Natl Acad Sci USA. 2012;109(1):84–89. doi: 10.1073/pnas.1111232108. [DOI] [PMC free article] [PubMed] [Google Scholar]
- 49.Shankar GM, et al. Amyloid-beta protein dimers isolated directly from Alzheimer’s brains impair synaptic plasticity and memory. Nat Med. 2008;14(8):837–842. doi: 10.1038/nm1782. [DOI] [PMC free article] [PubMed] [Google Scholar]