

Significance
Heterosis, the better performance of hybrids over their parents, holds great economic and biological significance. Different theories have been proposed, but specific examples with detailed dissection are limited. If close linkage of alleles with opposite effects exists, the superiority of hybrids over inbreds is observed and may appear as overdominance at a single locus. We present a case of pseudo-overdominance generated by repulsion linkage between two quantitative trait loci in sorghum plant height. A combination of approaches were used: linkage mapping under a defined genetic background, genome-wide association study with a diversity panel, computer simulation, and designed crosses with selected genetic stocks. Our findings provide insights into heterosis and a tool box for plant breeders to develop ideal cultivars.
Keywords: heterosis, repulsion linkage, pseudo-overdominance, plant height, genome-wide association studies
Abstract
Heterosis is a main contributor to yield increase in many crop species. Different mechanisms have been proposed for heterosis: dominance, overdominance, epistasis, epigenetics, and protein metabolite changes. However, only limited examples of molecular dissection and validation of these mechanisms are available. Here, we present an example of discovery and validation of heterosis generated by a combination of repulsion linkage and dominance. Using a recombinant inbred line population, a separate quantitative trait locus (QTL) for plant height (qHT7.1) was identified near the genomic region harboring the known auxin transporter Dw3 gene. With two loci having repulsion linkage between two inbreds, heterosis in the hybrid can appear as a single locus with an overdominance mode of inheritance (i.e., pseudo-overdominance). Individually, alleles conferring taller plant height exhibited complete dominance over alleles conferring shorter height. Detailed analyses of different height components demonstrated that qHT7.1 affects both the upper and lower parts of the plant, whereas Dw3 affects only the part below the flag leaf. Computer simulations show that repulsion linkage could influence QTL detection and estimation of effect in segregating populations. Guided by findings in linkage mapping, a genome-wide association study of plant height with a sorghum diversity panel pinpointed genomic regions underlying the trait variation, including Dw1, Dw2, Dw3, Dw4, and qHT7.1. Multilocus mixed model analysis confirmed the advantage of complex trait dissection using an integrated approach. Besides identifying a specific genetic example of heterosis, our research indicated that integrated molecular dissection of complex traits in different population types can enable plant breeders to fine tune the breeding process for crop production.
Heterosis, the better performance of a hybrid than either of its parents, can be traced back to Charles Darwin and has been of great interest to biologists. Hybrids derived from diverse inbred lines generally show higher growth rate and yield and better resistance to biotic and abiotic stresses (1). Approximately 15% of the yield increase in corn, starting in the early 1930s, comes from the introduction of hybrid corn (2). Hybrid rice has a 20–30% yield advantage over inbred rice cultivars and contributes significantly to food security (3).
Four hypotheses have been proposed for heterosis: dominance, overdominance, pseudo-overdominance, and epistasis. Advances in genomics shed new light on other theories for heterosis, including protein metabolism and epigenetic changes in hybrids (4–6). The dominance hypothesis assumes the better performance of F1 results from accumulation of more dominant alleles in the F1 genome than in either of its parents. These dominant alleles can mask the deleterious effects of recessive alleles. Conversely, inbreeding depression, the reduced fitness of progeny from crossing between related individuals, is caused predominately by exposing deleterious recessive alleles (7). The overdominance hypothesis argues heterozygous genotypes are better than either of the two homozygous genotype parents. Two specific examples were found in sickle-cell anemia (8) and tomato (9), where the advantage of heterozygous genotype at a single locus was demonstrated. The pseudo-overdominance hypothesis was first proposed in 1917 as a possible explanation for heterosis (10). It assumes that many factors control a specific trait and that it is unlikely that one individual could have all the favorable alleles in its genome. If alleles with opposite effects at multiple loci are linked in repulsion phase in two parental inbreds, overdominance may be mistaken for a single locus unless detailed dissection is carried out in progenies. The epistasis hypothesis states that heterosis is caused by de novo interactions between different loci.
Research evidence from multiple crops supported all four hypotheses: dominance (11, 12), overdominance (9, 13, 14), pseudo-overdominance (15, 16), and epistasis (17–22). These results suggest that the genetic basis for heterosis can be trait and species dependent and may be explained by not a single unified theory but multiple theories together.
Plant height generally shows significant heterosis, making it an ideal trait to study and illustrate heterosis (6). Sorghum plant height shows 6–72% high-parent heterosis (23–28). In maize, high-parent heterosis of plant height can reach 32–120% (13, 29, 30). The high-parent heterosis of plant height can reach 10–20% in elite rice hybrids (12, 31, 32) and 22% in wheat hybrids (33).
In sorghum, previous research has identified four major loci controlling plant height, Dw1–Dw4 (34). These four dwarfing loci were found to be unlinked and were phenotypically selected during conversion of sorghum into temperate-region production with machine harvesting. At each locus, the tall type allele shows complete dominance over the other allele. Among the four dwarfing loci, only Dw3 has been molecularly characterized (Sb07g023730), encoding a P-glycoprotein auxin transporter (35). Dw1 was mapped to chromosome 9 at ∼57 Mb (36), and Dw2 was mapped to chromosome 6 at ∼42 Mb (37, 38).
In this study, we present an example of heterosis as a result of repulsion linkage for sorghum plant height through genetic mapping and designed cross (Fig. 1 A and B). We started by identifying an additional plant height quantitative trait locus (QTL) in a recombinant inbred line (RIL) population located 3 Mb away from the known Dw3 gene on chromosome 7 (qHT7.1). A genome-wide association study (GWAS) of plant height using the sorghum association panel (39) further confirmed the discovery. Computer simulation was conducted to evaluate the influence of repulsion linkage on QTL detection in an F2 population. The gene action at each QTL and heterosis were demonstrated by observing F1 hybrids generated from crossing selected RILs with different combinations of QTL alleles. Finally, a close examination of allelic combinations of plant height QTL in diverse accessions revealed the potential of breeding with designed approaches.
Fig. 1.

Plant height measurements and crossing design. (A) Total plant height, height at the base of the panicle, height at the flag leaf, and preflag leaf height were measured directly (solid arrows). The flag leaf-to-apex interval, flag leaf-to-base of panicle interval, preflag leaf-to-flag leaf interval, and preflag leaf-to-base of panicle interval were calculated (dotted arrows). qHT7.1 affects all eight plant height components, whereas the effect of Dw3 is detected for six components. (B) Crossing design for hybrid development. Eight inbreds were selected by their genotypes at qHT7.1 (AA or aa), Dw3 (BB or bb), and Dw1 (CC or cc) to make the crosses. The four on the left have the dw1dw1 background, and the four on the right have the Dw1Dw1 background. Two specific crosses (black lines) are expected to generate F1s showing heterosis in plant height. For all other crosses (gray lines), the F1 is expected to have a height similar to that of the second inbred parent indicated by the arrow.
Results
Linkage Mapping of Plant Height.
An RIL population was developed from Tx430 and P898012. Plant height in this population was consistent across locations and years (Fig. S1), with the entry mean-based heritability of 0.96. P898012 is ∼25 cm taller than Tx430, but plant height of RILs varied widely (74 ∼236 cm), following a normal distribution (Fig. S2).
Fig. S1.

Distributions of plant height across five environments [Puerto Rico 2011 (PR11), Puerto Rico 2012 (PR12), Kansas 2011 (KS11), Kansas 2012 (KS12), and Iowa 2013 (IA13)] and the distribution of BLUP values based on the five environments (Combined). The red line is the plant height of Tx430, and the blue line is the plant height of P898012.
Fig. S2.

Histograms of plant height BLUP values in five environments and plant height BLUP values by combing all five environments.
The genotyping-by-sequencing (GBS) procedure generated 8,960 SNP markers that are segregating in this population. A set of 1,756 selected markers was used to construct the linkage map. The total map length is 1,916 cM spanning 1,452 unique bins, leading to a mean marker bin density of 1.3 cM (Fig. S3 and Table S1).
Fig. S3.

Linkage map built with 1,756 SNP markers. The positions of the three plant height QTL are indicated by the blue bars.
Table S1.
Total number of markers, number of bins (by merging makers mapped to the same position), and total length of each chromosome
| Chromosome | No. of markers | No. of bins | Length, cM |
| 1 | 226 | 210 | 254.6 |
| 2 | 228 | 188 | 188.6 |
| 3 | 239 | 193 | 255.1 |
| 4 | 174 | 165 | 199.1 |
| 5 | 129 | 105 | 185.3 |
| 6 | 194 | 147 | 150.5 |
| 7 | 101 | 93 | 170.6 |
| 8 | 109 | 77 | 130.6 |
| 9 | 163 | 133 | 164.9 |
| 10 | 193 | 141 | 217.1 |
| Total | 1,756 | 1,452 | 1,916.4 |
Composite interval mapping with the genetic map defined by 1,756 SNPs detected three QTL on chromosomes 7 and 9, and single-marker scan with physical mapping of all 8,960 SNP markers supported these findings (Fig. S4). Two QTL on chromosome 7 are ∼29 cM or 3 Mb apart and have opposite effects (Fig. 2 A and B and Table 1). The first QTL, located at ∼91 cM, was designated qHT7.1, and the second QTL located at ∼120 cM was mapped to the position of the known Dw3 gene (35). The chromosome 9 QTL corresponds to the Dw1 locus (36, 37). Next, we confirmed that the second QTL on chromosome 7 in the current study is Dw3, a P-glycoprotein responsible for polar transport of auxin in the stalk (35). The Tx430 allele has an 882-bp insertion in the fifth exon (Fig. S5), resulting in a nonfunctional protein.
Fig. S4.


Mapping results for eight components of plant height. For each trait, the upper two panels are results from composite interval mapping, and the lower two panels are results from a single-marker scan. (Left) Results across 10 chromosomes. (Right) Results for chromosome 7. a, additive effect; LOD, logarithm of the odds.
Fig. 2.

Linkage mapping of plant height. (A–C, Left) Diagrams defining Results from composite interval mapping for total plant height (A), Flag leaf height (B), and Flag leaf-to-apex interval (C). (Center and Right) Results from composite interval mapping. (Center, Upper) The logarithm of the odds (LOD) score profile with the permutation threshold indicated by the horizontal line. (Center, Lower) The additive effect (a) with the Tx430 allele as the reference. (Right, Upper) The LOD score profile for enlarged chromosome 7 region. (Right, Lower) The additive effect for enlarged chromosome 7 region.
Table 1.
Three QTL identified through linkage mapping for three plant height traits
| Trait | qHT7.1, Chr7: ∼91 cM | Dw3, Chr7: ∼120 cM | Dw1, Chr9: ∼146 cM |
| Total plant height | 25.1 (34.7%) | −22.2 (27.1%) | −20.4 (30.2%) |
| Flag leaf height | 24.1 (28.8%) | −26.1 (31.5%) | −20.0 (24.9%) |
| Flag leaf-to-apex interval | 6.3 (45.4%) | Not significant | −3.8 (16.8%) |
The additive effect of each QTL is shown in centimeters for the Tx430 allele. Numbers in parentheses are the phenotypic variation explained by each QTL.
Fig. S5.

Gel image of the two Dw3 alleles. L, 1 Kb Plus DNA Ladder (Life Technologies). Lanes 1–4, PCR fragments from Tx430, P898012, RIL88 (shortest entry), and RIL197 (tallest entry), respectively. The fragments from Tx430 and RIL88 are 882 bp longer than the fragments from P898012 and RIL197.
Mapping of Plant Height Components.
Both QTL on chromosome 7 affect four direct measurements: total plant height, base of panicle height, flag leaf height, and preflag leaf height. Both QTL affect the interval between preflag leaf and flag leaf. However, the Dw3 gene does not affect variation in the upper parts of the stem, namely the interval between flag leaf and the base of the panicle (peduncle length) or the interval between flag leaf and the top of the panicle (Fig. 2C and Fig. S4); it has a small effect on the interval between preflag leaf and base of the panicle (Fig. S4). qHT7.1 has the largest phenotypic contribution to six of the eight plant height components and has the second largest phenotypic contribution to the remaining two traits (Table 1 and Fig. S4).
GWAS of Plant Height Across a Diversity Panel.
Following the finding of two linked QTL with opposite effects on chromosome 7, we further explored the possibility of detecting this locus, qHT7.1, in the sorghum association panel (39), a much broader genetic background. The first genome scan with the linear mixed model detected the two known plant height QTL (Dw1 on chromosome 9 and Dw2 on chromosome 6) and another candidate QTL for Dw4 on chromosome 4 (Fig. 3A). At this point, neither Dw3 nor qHT7.1 was significant. However, after Dw1 and Dw2 were incorporated as covariates in the second genome scan, both Dw3 and qHT7.1 were significantly associated with plant height. The association signal for Dw3 is located at 58,390,034 bp on chromosome 7 (P = 1.2 × 10⁻⁹), and the most significant signal for qHT7.1 is located at 55,229,509 bp (P = 4.8 × 10⁻⁸) (Fig. 3B). These two SNPs are right within the corresponding QTL peak regions of the linkage mapping, and they also are near the most significant SNPs found in the single-marker scan (Fig. S4). Based on a search of the literature, this QTL had not been detected in previous association mapping studies (36, 37, 40, 41), possibly because of the need for targeted analysis.
Fig. 3.

Genome-wide association mapping of plant height. (A) Initial genome scan. (B) Second genome scan with a model including Dw1 and Dw2 as covariates. (C) Genome scan using the MLMM. (Left) Genome-wide results. (Right) Enlarged chromosome 7 region. The horizontal line in each subsection is the Bonferroni-corrected significance threshold. The positions of Dw1, Dw2, Dw3, qHT7.1, and the possible position for Dw4 are indicated. The red points in C are the significant SNPs (entering the final model as covariates) identified by MLMM.
Encouraged by these findings, we conducted the third genome scan with the multilocus mixed model (MLMM) method (42), which sequentially adds significant QTL as covariates in the model before testing all other SNPs. This third scan identified the same SNP at 55,229,509 bp as the fourth most significant marker, following Dw1 on chromosome 9, Dw2 on chromosome 6, and Dw3 on chromosome 7 (Fig. 3C and Table 2). Although 80% of the accessions in this diverse panel have the allele with the positive effect at the qHT7.1 locus, 57% of accessions have the haplotypes with opposite effects at the qHT7.1 and Dw3 loci (Table S2).
Table 2.
Significant SNPs (covariates) detected by the MLMM in GWAS
| SNP | Locus | Effect | MAF | P value |
| S9_57236778 | Dw1 | −0.44 | 0.36 | 5.9 × 10⁻²⁴ |
| S6_42744899 | Dw2 | 0.36 | 0.36 | 3.4 × 10⁻¹⁷ |
| S7_58390034 | Dw3 | −0.29 | 0.43 | 7.8 × 10⁻¹⁵ |
| S7_55229509 | qHT7.1 | 0.43 | 0.20 | 2.9 × 10⁻¹³ |
| S6_5702897 | — | −0.86 | 0.01 | 3.7 × 10⁻¹⁰ |
| S4_66720692 | Dw4 ? | −0.31 | 0.15 | 5.7 × 10⁻⁹ |
| S6_40343762 | — | −0.46 | 0.04 | 7.5 × 10⁻⁸ |
| S10_43486183 | — | 0.71 | 0.01 | 1.1 × 10⁻⁷ |
Effect estimates are for the Tx430 allele and are in SD units because the data used for association mapping were standardized. Chromosome number and SNP position are given after “S” in the first column. MAF, minor allele frequency.
Table S2.
Haplotype frequencies of the two loci on chromosome 7 in this study
| S7_55229509, qHT7.1 | S7_58390034, Dw3 | Count | Frequency, % |
| C (−) | G (−) | 30 | 9.80 |
| C (−) | T (+) | 31 | 10.13 |
| G (+) | G (−) | 145 | 47.39 |
| G (+) | T (+) | 100 | 32.68 |
The plus and minus signs in the parentheses are the direction of allelic effect in the sorghum diversity panel. Of the 307 accessions used in GWAS, SC1429 is heterozygous at S7_58390034 and is not counted for haplotypes.
Gene Actions of Each Plant Height QTL and Heterosis.
Because only homozygous inbreds were involved in linkage mapping and GWAS, the dominance effect of each QTL cannot be estimated. To examine dominance effects and heterosis, we decided to make hybrid crosses between inbreds. This crossing scheme can confirm our expectation that heterosis in plant height should be observed in hybrids derived from a pair of inbreds in which the two QTL on chromosome 7 are in repulsion linkage (Fig. 1B). In one cross involving repulsion linkage between qHT7.1 and Dw3 under the dw1dw1 background (aaBB cc × AAbb cc), the F1 hybrid was 44 cm taller than the tall parent, equivalent to 35% high-parent heterosis (Fig. 4A and Table S3). In another cross involving repulsion linkage between qHT7.1 and Dw3 under the Dw1Dw1 background (aaBB CC × AAbb CC), the F1 hybrid was 30 cm taller than the tall parent, equivalent to 19% high-parent heterosis (Fig. 4B and Table S3). Other plant height components, except for the flag leaf-to-apex interval, showed 18–50% high-parent heterosis. The flag leaf-to-apex interval of both hybrids is similar to that of the tall parents, as expected, because only qHT7.1 was detected for the upper part of the plant (Fig. 2), and the tall parents are homozygous dominant at qHT7.1. Together, these findings provide evidence that the observed heterosis is caused by the repulsion linkage on chromosome 7 rather than other uncharacterized loci. With crosses involving different alleles of qHT7.1 under different backgrounds, the tall allele shows complete dominance over the short allele (Fig. 4 C and D and Table S4). Similarly, Dw1 and Dw3 showed nearly complete dominance on plant height (Table S4), agreeing with previous research (34).
Fig. 4.

Plant height of parental lines and corresponding F1 hybrids. (A and B) Heterosis caused by repulsion linkage of qHT7.1 and Dw3, under different backgrounds of Dw1. (C and D) The tall allele of qHT7.1 shows complete dominance over the short allele of qHT7.1 under different backgrounds of Dw3 and Dw1. In each picture, the seed parent is on the left, and the pollen parent is on the right.
Table S3.
Phenotype of the crosses used to verify the pseudo-overdominance effect generated by repulsion linkage between qHT7.1 (A/a) and Dw3 (B/b) in plant height (Cross 1 and Cross 2) and the compounded effect generated by coupling linkage between qHT7.1 (A/a) and Dw3 (B/b) in plant height (Cross 3 and Cross 4)
| Trait | Cross 1 | Cross 2 | ||||||
| RIL56 | F1 | Tx430 | P898012 | F1 | RIL237 | |||
| aaBB cc | AaBb cc | AAbb cc | HPH | aaBB CC | AaBb CC | AAbb CC | HPH | |
| Total plant height | 121 | 169 | 125 | 0.35 | 150 | 191 | 161 | 0.19 |
| Base of panicle height | 98 | 146 | 97 | 0.49 | 130 | 170 | 138 | 0.23 |
| Flag leaf height | 95 | 131 | 87 | 0.38 | 116 | 144 | 116 | 0.24 |
| Preflag leaf height | 70 | 97 | 63 | 0.39 | 89 | 106 | 88 | 0.19 |
| Flag leaf-to-apex interval | 26 | 38 | 39 | −0.03 | 34 | 47 | 45 | 0.04 |
| Preflag leaf-to-flag leaf interval | 25 | 35 | 24 | 0.40 | 28 | 38 | 28 | 0.36 |
| Flag leaf-to-base of panicle interval | 3 | 15 | 10 | 0.50 | 14 | 26 | 22 | 0.18 |
| Preflag leaf-to-base of panicle interval | 28 | 49 | 34 | 0.44 | 41 | 64 | 50 | 0.28 |
| Cross 3 | Cross 4 | |||||||
| RIL167 | F1 | RIL79 | RIL232 | F1 | RIL103 | |||
| AABB cc | AaBb cc | aabb cc | aabb CC | AaBb CC | AABB CC | |||
| Total plant height | 190 | 202 | 75 | 0.06 | 115 | 209 | 224 | −0.07 |
| Base of panicle height | 169 | 183 | 49 | 0.08 | 93 | 185 | 201 | −0.08 |
| Flag leaf height | 156 | 175 | 59 | 0.12 | 90 | 165 | 188 | −0.12 |
| Preflag leaf height | 123 | 143 | 40 | 0.16 | 56 | 128 | 155 | −0.17 |
| Flag leaf-to-apex interval | 34 | 27 | 16 | −0.21 | 25 | 44 | 36 | 0.22 |
| Preflag leaf-to-flag leaf interval | 33 | 32 | 20 | −0.03 | 34 | 37 | 33 | 0.09 |
| Flag leaf-to-base of panicle interval | 13 | 9 | −11 | −0.31 | 3 | 20 | 13 | 0.54 |
| Preflag leaf-to-base of panicle interval | 46 | 40 | 9 | −0.13 | 37 | 57 | 46 | 0.24 |
Within each cross, the inbred on left was used as the seed parent and the inbred on right was used as pollen parent. C/c for Dw1. HPH, high-parent heterosis. All measurements are in centimeters. In each cross, the bold letters represent the loci of interest.
Table S4.
Phenotype of the additional crosses used to estimate the gene action of qHT7.1 (Crosses 5–8), Dw1 (Crosses 9–12), and Dw3 (Crosses 13–16)
| Trait | Cross 5 | Cross 6 | ||||
| RIL56 | F1 | RIL167 | RIL232 | F1 | RIL237 | |
| aaBB cc | AaBB cc | AABB cc | aabb CC | Aabb CC | AAbb CC | |
| Total plant height | 125 | 200 | 198 | 120 | 156 | 160 |
| Base of panicle height | 102 | 177 | 176 | 98 | 128 | 137 |
| Flag leaf height | 104 | 160 | 163 | 90 | 114 | 115 |
| Preflag leaf height | 74 | 126 | 130 | 62 | 80 | 84 |
| Flag leaf-to-apex interval | 21 | 40 | 35 | 31 | 42 | 46 |
| Preflag leaf-to-flag leaf interval | 30 | 34 | 33 | 28 | 34 | 31 |
| Flag leaf-to-base of panicle interval | −2 | 17 | 13 | 9 | 14 | 23 |
| Preflag leaf-to-base of panicle interval | 28 | 51 | 46 | 37 | 48 | 54 |
| Cross 7 | Cross 8 | |||||
| Tx430 | F1 | RIL79 | RIL103 | F1 | P898012 | |
| AAbb cc | Aabb cc | aabb cc | AABB CC | AaBB CC | aaBB CC | |
| Total plant height | 128 | 130 | 71 | 215 | 215 | 140 |
| Base of panicle height | 98 | 101 | 51 | 190 | 190 | 125 |
| Flag leaf height | 89 | 89 | 57 | 176 | 174 | 108 |
| Preflag leaf height | 66 | 64 | 41 | 135 | 135 | 78 |
| Flag leaf-to-apex interval | 39 | 41 | 15 | 40 | 41 | 32 |
| Preflag leaf-to-flag leaf interval | 23 | 25 | 16 | 41 | 39 | 30 |
| Flag leaf-to-base of panicle interval | 9 | 12 | −6 | 15 | 16 | 17 |
| Preflag leaf-to-base of panicle interval | 32 | 37 | 10 | 55 | 55 | 47 |
| Cross 9 | Cross 10 | |||||
| RIL56 | F1 | P898012 | Tx430 | F1 | RIL237 | |
| aaBB cc | aaBB Cc | aaBB CC | AAbb cc | AAbb Cc | AAbb CC | |
| Total plant height | 122 | 151 | 142 | 121 | 156 | 161 |
| Base of panicle height | 100 | 133 | 127 | 93 | 134 | 141 |
| Flag leaf height | 100 | 113 | 106 | 82 | 110 | 113 |
| Preflag leaf height | 77 | 84 | 77 | 58 | 76 | 87 |
| Flag leaf-to-apex interval | 23 | 38 | 36 | 39 | 47 | 48 |
| Preflag leaf-to-flag leaf interval | 23 | 29 | 29 | 25 | 34 | 26 |
| Flag leaf-to-base of panicle interval | 0 | 20 | 21 | 11 | 24 | 28 |
| Preflag leaf-to-base of panicle interval | 23 | 49 | 50 | 36 | 58 | 54 |
| Cross 11 | Cross 12 | |||||
| RIL232 | F1 | RIL79 | RIL103 | F1 | RIL167 | |
| aabb CC | aabb Cc | aabb cc | AABB CC | AABB Cc | AABB cc | |
| Total plant height | 123 | 114 | 65 | 205 | 218 | 192 |
| Base of panicle height | 99 | 89 | 44 | 183 | 195 | 172 |
| Flag leaf height | 90 | 78 | 53 | 168 | 177 | 159 |
| Preflag leaf height | 61 | 53 | 38 | 131 | 138 | 128 |
| Flag leaf-to-apex interval | 33 | 36 | 13 | 37 | 41 | 33 |
| Preflag leaf-to-flag leaf interval | 29 | 26 | 15 | 38 | 39 | 31 |
| Flag leaf-to-base of panicle interval | 9 | 11 | −9 | 15 | 19 | 13 |
| Preflag leaf-to-base of panicle interval | 38 | 37 | 7 | 53 | 57 | 44 |
| Cross 13 | Cross 14 | |||||
| Tx430 | F1 | RIL167 | RIL232 | F1 | P898012 | |
| AAbb cc | AABb cc | AABB cc | aabb CC | aaBb CC | aaBB CC | |
| Total plant height | 119 | 185 | 184 | 127 | 147 | 139 |
| Base of panicle height | 91 | 164 | 163 | 102 | 127 | 123 |
| Flag leaf height | 83 | 153 | 152 | 93 | 116 | 103 |
| Preflag leaf height | 61 | 124 | 116 | 64 | 84 | 73 |
| Flag leaf-to-apex interval | 37 | 32 | 33 | 34 | 32 | 36 |
| Preflag leaf-to-flag leaf interval | 22 | 29 | 36 | 29 | 32 | 31 |
Simulation Appraisal of the Challenges in Dissecting QTL with Repulsion Linkage.
To understand the influence of repulsion linkage on mapping power and effect estimation, we conducted a series of simulations with an F2 population. We intended to answer two questions: (i) Can the two QTL be clearly separated instead of detecting one QTL spanning the whole region? (ii) What would the ratio of dominant to additive effect (d/a) of the detected QTL be? The default value of d/a was one because complete dominance was simulated at each locus. Results showed that heritability and distance between two linked QTL are most important, followed by distance between markers and population size. When genetic variance increased (i.e., heritability increased from 0.1 to 0.3), the probability of separating the two QTL increased from 22% to 54% (Fig. 5 A and D). The power to separate the two QTL also increased by changing the population size from 200 to 500 (Fig. S6). The estimated d/a was higher when only one QTL was detected than when two separate QTL were detected, particularly when the distance between two QTL was less than 20 cM (Fig. 5 B, C, E, and F). The simulation results showed that the lowest estimate of d/a was 1.06 if the distance between two QTL was less than 50 cM: The dominant effect was overestimated and the additive effect was underestimated because of repulsion linkage of the two QTL (pseudo-overdominance). Increasing the distance between the two QTL increased the probability of separating the two QTL and led to more accurate estimates of d/a. Increasing marker density, that is, reducing the distance between markers, also led to better estimates of d/a but had no significant effect on the ability to separate the two QTL.
Fig. 5.

Effect of repulsion linkage on QTL detection in a simulated F2 population with 200 individuals. (A–C) Heritability of 0.1. (D–F) Heritability of 0.3. (B and E) The d/a ratios when one QTL was detected. (C and F) The d/a ratios when two QTL were detected. For all d/a ratios, each point is the median value from 5,000 runs, and missing points indicate that those scenarios were not observed.
Fig. S6.
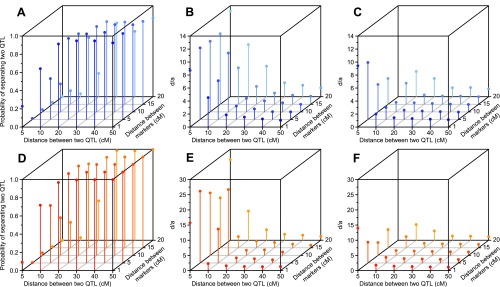
Effect of repulsion linkage on QTL detection in a simulated F2 population with 500 individuals. (A–C) Heritability of 0.1. (D–F) Heritability of 0.3. (B and E) The d/a ratios when one QTL was detected. (C and F) The d/a ratios when two QTL were detected. Each point is the median value from 5,000 runs, and missing points indicate that those scenarios were not observed.
Allelic Combinations for Designed Breeding Schemes.
To explore the breeding implications of our findings further, we classified the 307 sorghum accessions used in the GWAS into 15 groups based on the genotypes at Dw1, Dw2, Dw3, and qHT7.1, the four most significant loci (Fig. 6). Interestingly, one particular genotype (homozygous dominant at Dw2 and Dw3 and homozygous recessive at Dw1 and qHT7.1) does not exist in the sorghum association panel. Of the 307 accessions, 240 (78%) have either two or three recessive loci. A dominant allele of qHT7.1 consistently increased plant height in different backgrounds of three other loci (Fig. 6, Bottom Row), as indicated by the higher median plant height in the even-numbered groups than in the odd-numbered groups. Variation within each group is expected because of effects at other loci. A hybrid generated by crossing two parents from different groups will show heterosis if the hybrid has more loci with dominant alleles in its genome than either of its parents, as in the current study (Fig. 4 A and B). Therefore specific crosses can be made to exploit heterosis from dominance complementation. On the other hand, the expected plant height of different hybrids can be obtained so that only certain crosses are made to meet certain production restrictions on height parameters.
Fig. 6.

Standardized plant height for the 16 genotype combinations in the sorghum association panel ordered by their genotypes at Dw1, Dw2, Dw3, and qHT7.1. The width of each box in the boxplot is proportional to the square root of the number of accessions in each group. Orange rectangles represent homozygous dominant genotypes, and blue rectangles represent homozygous recessive genotypes. No accessions were found in the seventh genotype combination.
Discussion
Research into heterosis using both classical and modern genetics shows that different mechanisms are favored for different traits in different species, so finding a single unified theory to explain heterosis may be too challenging (4, 6, 43, 44). However, the dominance hypothesis has support from studies in maize and rice (11, 12, 19, 45–47). Many QTL detected for maize heterosis are located near the centromere. The low recombination frequency around the centromere may conserve repulsion linkage, possibly explaining the observed overdominance (13). The estimate of dominance effect decreased as intercrossing of maize populations advanced, indirectly supporting the pseudo-overdominance hypothesis (48, 49). Recent findings of excessive residual heterozygosity around maize pericentromeric regions also were speculated to be evidence of the dominance hypothesis for heterosis (50).
In an earlier study of heterosis of maize yield, one QTL showing the overdominance effect in the initial analysis was later separated into two QTL 19 cM apart with dominant effects but in repulsion phase, resulting in pseudo-overdominance (15, 16). In our study, the two QTL are located on the long arm of chromosome 7, away from the centromere region. Although they are only 3 Mb apart, there is adequate recombination (29 cM) that allowed us to detect both loci. Having the repulsion linkage captured in two mapping parents facilitated the discovery of this example of heterosis in plant height generated by pseudo-overdominance.
Computer simulation is a powerful tool to test hypotheses when real testing conditions are not readily available (51). It allowed us to evaluate the influences of repulsion linkage on genetic mapping and effect estimation. Our simulation results showed that if two QTL in repulsion linkage are close to one another (<10 cM), they may not be separated, and the overdominance effect could be observed. Clearly, it would be desirable to identify other cases of pseudo-overdominance in which two loci have much closer genetic distance than we found in the current case. Additional case studies at the individual loci level for other quantitative traits, including biomass and grain yield, would generate empirical evidence and feedback for the theoretical research.
Direct comparison of results and leverage of information in linkage mapping, the GWAS, and designed crosses were possible in our study because of the large number of SNPs with known genome positions. The three QTL (Dw1, Dw3, and qHT7.1) detected in linkage mapping have approximately equal effect sizes. In the GWAS with diverse accessions, the Dw1 gene was the most significant QTL because it has both the largest effect size and also a relatively high minor allele frequency. The QTL at ∼120 cM on chromosome 7, which corresponds to the cloned Dw3 gene, was detected by both linkage mapping and association mapping in many previous studies (36, 37, 52). Only one linkage-mapping study suggested two QTL in this chromosome region (53).
Examining results across genome scans with different methods enriches our understanding of trait genetic architecture. In a GWAS, Dw3 and qHT7.1 can be detected only after Dw1 and Dw2 are included in the linear mixed model. This result agrees with general expectation that specifying major loci in the GWAS model can improve power of detecting other loci. Likewise, the MLMM method, which sequentially adds detected loci to the scanning models (42), supported the findings in Dw3 and qHT7.1 and identified additional loci. Interestingly, both Dw3 and qHT7.1 were detected with the appropriate models. The low linkage disequilibrium between these two loci may be caused by haplotype frequencies captured in breeding materials through intentional selection based on phenotypes (Table S2).
Because Dw3 is responsible for auxin transport in the stem from top to bottom, the lower part of the plant is expected to be influenced more than the upper part of the plant. The upper part will have enough auxin for elongation regardless of the existence of the auxin transporter as long as the auxin production system is functional. qHT7.1, on the other hand, affects all height component traits in this study (both direct measurements and indirect calculations), meaning that this QTL may be involved in a different pathway regulating plant height. The gibberellic acid (GA) and brassinosteroid (BR) pathways are key players regulating plant height in many species (54, 55). We speculate the gene underlying qHT7.1 may be involved in these pathways.
Previous studies have showed that the four major genes controlling plant height in sorghum, Dw1–Dw4, are not linked, and the tall phenotype shows complete dominance (34). The crossing design illustrated in Fig. 1B allowed us to evaluate the gene action under mostly defined genetic backgrounds. For each cross, the two inbred lines were selected based on their similarity at other positions in the genome to minimize background effects on the target QTL. Although this approach cannot eliminate residual background effects completely, the hybrid crosses made based on these three major loci allowed us to examine the heterosis and dominance effects from these target QTL.
The gene region harboring Dw3 and qHT7.1 is an introgression region from the sorghum conversion program, together with the Ma1 and Dw2 gene region on chromosome 6 and the Dw1 gene region on chromosome 9 (56). However, selection was conducted based on phenotypic observations. Genetic analysis and our specific research indicate that we have a large space for further optimizing plant height in sorghum. Repulsion linkage is also the reason for linkage drag in plant breeding. It poses a challenge for introgression of desirable chromosome segments into another background (16, 57). Dissecting the chromosome region into different QTL can help identify the desirable allelic combination in breeding populations. Fine tuning plant height can lead to sorghum hybrids that are high biomass and high lodging-resistant at the same time. Our findings of the QTL qHT7.1, its haplotype with Dw3, and heterosis and gene action demonstration provide additional tools for breeders to manipulate plant height.
Materials and Methods
Mapping Population and Experimental Design.
The 250 RILs used in this study are derived by single-seed descent from a cross between Tx430 and P898012. Tx430 is a grain sorghum inbred commonly used as pollinator in hybrid production. The other parent, P898012, is a grain sorghum inbred with good drought-tolerance traits (58). The field experiments were carried out in five environments (location-year combinations): Guayanilla, Puerto Rico (2011 and 2012); Manhattan, KS (2011 and 2012); and Ames, IA (2013). The population was planted in a randomized complete block (RCB) design with two replications in each environment.
Phenotypic Measurement.
Total plant height was measured as the distance between ground and the top of the panicle. In the summer 2013 growing season, three other measurements (base of panicle height, flag leaf height, and preflag leaf height) were collected on the RIL population as complementary information of total plant height (Fig. 1A). By treating genotype as a random effect, best linear unbiased prediction (BLUP) values and variance components were obtained with PROC MIXED in SAS 9.3 software (SAS Institute). The entry mean-based heritability was calculated from variance components estimates.
Genotyping and Marker Screening.
Genomic DNA was extracted from each RIL using the standard cetyltrimethylammonium bromide (CTAB) method (59). The concentrations of the DNA samples were quantified using Quant-iT PicoGreen dsDNA Assay Kit (Invitrogen). The GBS procedure was carried out according to a standard protocol (60) and identified 10,380 initial SNPs segregating within the RIL population. A set of 8,960 SNPs was used for genetic mapping after SNPs with genotyping errors or misalignments were removed.
Linkage Map Construction and Genetic Mapping.
To take full advantage of the high-density markers, we first conducted a single-marker scan using 8,960 SNPs with their physical positions in the genome. The analysis was conducted in R (R Development Core Team). By setting a missing data threshold of 10%, we selected 1,756 SNPs to build the genetic map using program MSTMap (61). Composite interval mapping using 1,756 SNPs was carried out in Windows QTL Cartographer 2.5 (62).
GWAS with Diverse Accessions.
Association mapping was conducted with the sorghum association panel (39). The phenotypic data were the published plant height measurements (36). Based on the overlap of the 378 accessions with the published GBS data (37), a set of 307 accessions with 265K SNP markers was used for the GWAS. Missing data in the 265K SNPs were imputed with Beagle 4.0 (63). The analysis was carried out in the Genomic Association and Prediction Integrated Tool (64). The first three principle components were used as covariates for population structure in the compressed mixed linear models (65). After the initial analysis, a second genome scan was carried out with a mixed model that included the most significant SNPs under Dw1 and Dw2 as additional covariates. A third genome scan was also carried out using the multilocus mixed model (42), which selects the most significant SNP from the stepwise regression to enter into the model sequentially as a covariate.
Computer Simulations.
To assess the influence of repulsion linkage on genetic mapping in the F2 population, a computer simulation experiment was conducted (51). Four factors were considered: heritability, distance between markers, distance between two QTL, and population size. Heritability (the genetic contribution of two QTL to phenotypic variance) was set at 0.1 or 0.3, distance between markers was set at 1, 5, 10, 15, or 20 cM, the distance between two QTL was set at 5, 10, 20, 30, 40, or 50 cM, and population size was set at 200 or 500 individuals. The two linked QTL were assumed to have equal effect sizes, and gene action at each locus was complete dominance. With 120 different combinations of the four factors, each combination was repeated 5,000 times. Genotypic and phenotypic data were generated by the UNIX version of the QTL cartographer software v1.17. The composite interval mapping method was used for linkage mapping. Three summary statistics were calculated: the proportion of simulation runs with two linked QTL detected separately, the d/a ratio when only one QTL was detected, and the d/a ratio when two QTL were detected. The median values were presented for the d/a ratios.
Hybrid Development.
To verify the hypothesis that heterosis of sorghum plant height can be explained by repulsion linkage, crosses were made during summer 2014 at Ames, IA (Fig. 1B). Eight RILs were selected based on their genotypes at the three QTL detected in this study (qHT7.1, Dw3, and Dw1). For each cross, the two inbred lines were selected based on their genotype at the target plant height QTL and their similarity at other positions in the genome to minimize background effects. In addition, two inbreds were chosen to have similar flowering times to facilitate the crossing. The first two sets of six crosses focused on the two QTL on chromosome 7 with the QTL on chromosome 9 fixed as homozygous dominant or homozygous recessive. The remaining four crosses were made to examine the effect of the chromosome 9 QTL. The hybrids together with their parents were grown at Santa Isabel, Puerto Rico in 2014.
Acknowledgments
This work was supported by Binational Agricultural Research and Development Program IS-4256-12, by Agriculture and Food Research Initiative Competitive Grant 2011-03587 from the US Department of Agriculture National Institute of Food and Agriculture, by the Kansas State University Center for Sorghum Improvement, and by the Iowa State University Raymond F. Baker Center for Plant Breeding.
Footnotes
The authors declare no conflict of interest.
This article is a PNAS Direct Submission.
This article contains supporting information online at www.pnas.org/lookup/suppl/doi:10.1073/pnas.1509229112/-/DCSupplemental.
References
- 1.Lippman ZB, Zamir D. Heterosis: Revisiting the magic. Trends Genet. 2007;23(2):60–66. doi: 10.1016/j.tig.2006.12.006. [DOI] [PubMed] [Google Scholar]
- 2.Duvick DN. Biotechnology in the 1930s: The development of hybrid maize. Nat Rev Genet. 2001;2(1):69–74. doi: 10.1038/35047587. [DOI] [PubMed] [Google Scholar]
- 3.Lin SC, Yuan LP. 1980. Hybrid rice breeding in China. Innovative approaches to rice breeding. Selected Papers from the 1979 International Rice Research Conference (International Rice Research Institute, Manila, Philippines) pp 35–51.
- 4.Chen ZJ. Genomic and epigenetic insights into the molecular bases of heterosis. Nat Rev Genet. 2013;14(7):471–482. doi: 10.1038/nrg3503. [DOI] [PubMed] [Google Scholar]
- 5.Goff SA. A unifying theory for general multigenic heterosis: Energy efficiency, protein metabolism, and implications for molecular breeding. New Phytol. 2011;189(4):923–937. doi: 10.1111/j.1469-8137.2010.03574.x. [DOI] [PubMed] [Google Scholar]
- 6.Schnable PS, Springer NM. Progress toward understanding heterosis in crop plants. Annu Rev Plant Biol. 2013;64:71–88. doi: 10.1146/annurev-arplant-042110-103827. [DOI] [PubMed] [Google Scholar]
- 7.Charlesworth D, Willis JH. The genetics of inbreeding depression. Nat Rev Genet. 2009;10(11):783–796. doi: 10.1038/nrg2664. [DOI] [PubMed] [Google Scholar]
- 8.Allison AC. Genetic control of resistance to human malaria. Curr Opin Immunol. 2009;21(5):499–505. doi: 10.1016/j.coi.2009.04.001. [DOI] [PubMed] [Google Scholar]
- 9.Krieger U, Lippman ZB, Zamir D. The flowering gene SINGLE FLOWER TRUSS drives heterosis for yield in tomato. Nat Genet. 2010;42(5):459–463. doi: 10.1038/ng.550. [DOI] [PubMed] [Google Scholar]
- 10.Jones DF. Dominance of Linked Factors as a Means of Accounting for Heterosis. Genetics. 1917;2(5):466–479. doi: 10.1093/genetics/2.5.466. [DOI] [PMC free article] [PubMed] [Google Scholar]
- 11.Garcia AA, Wang S, Melchinger AE, Zeng Z-B. Quantitative trait loci mapping and the genetic basis of heterosis in maize and rice. Genetics. 2008;180(3):1707–1724. doi: 10.1534/genetics.107.082867. [DOI] [PMC free article] [PubMed] [Google Scholar]
- 12.Xiao J, Li J, Yuan L, Tanksley SD. Dominance is the major genetic basis of heterosis in rice as revealed by QTL analysis using molecular markers. Genetics. 1995;140(2):745–754. doi: 10.1093/genetics/140.2.745. [DOI] [PMC free article] [PubMed] [Google Scholar]
- 13.Larièpe A, et al. The genetic basis of heterosis: Multiparental quantitative trait loci mapping reveals contrasted levels of apparent overdominance among traits of agronomical interest in maize (Zea mays L.) Genetics. 2012;190(2):795–811. doi: 10.1534/genetics.111.133447. [DOI] [PMC free article] [PubMed] [Google Scholar]
- 14.Zhou G, et al. Genetic composition of yield heterosis in an elite rice hybrid. Proc Natl Acad Sci USA. 2012;109(39):15847–15852. doi: 10.1073/pnas.1214141109. [DOI] [PMC free article] [PubMed] [Google Scholar]
- 15.Stuber CW, Lincoln SE, Wolff DW, Helentjaris T, Lander ES. Identification of genetic factors contributing to heterosis in a hybrid from two elite maize inbred lines using molecular markers. Genetics. 1992;132(3):823–839. doi: 10.1093/genetics/132.3.823. [DOI] [PMC free article] [PubMed] [Google Scholar]
- 16.Graham GI, Wolff DW, Stuber CW. Characterization of a yield quantitative trait locus on chromosome five of maize by fine mapping. Crop Sci. 1997;37(5):1601–1610. [Google Scholar]
- 17.Li ZK, et al. Overdominant epistatic loci are the primary genetic basis of inbreeding depression and heterosis in rice. I. Biomass and grain yield. Genetics. 2001;158(4):1737–1753. doi: 10.1093/genetics/158.4.1737. [DOI] [PMC free article] [PubMed] [Google Scholar]
- 18.Yu SB, et al. Importance of epistasis as the genetic basis of heterosis in an elite rice hybrid. Proc Natl Acad Sci USA. 1997;94(17):9226–9231. doi: 10.1073/pnas.94.17.9226. [DOI] [PMC free article] [PubMed] [Google Scholar]
- 19.Tang J, et al. Dissection of the genetic basis of heterosis in an elite maize hybrid by QTL mapping in an immortalized F2 population. Theor Appl Genet. 2010;120(2):333–340. doi: 10.1007/s00122-009-1213-0. [DOI] [PubMed] [Google Scholar]
- 20.Melchinger AE, et al. Genetic basis of heterosis for growth-related traits in Arabidopsis investigated by testcross progenies of near-isogenic lines reveals a significant role of epistasis. Genetics. 2007;177(3):1827–1837. doi: 10.1534/genetics.107.080564. [DOI] [PMC free article] [PubMed] [Google Scholar]
- 21.Hua J, et al. Single-locus heterotic effects and dominance by dominance interactions can adequately explain the genetic basis of heterosis in an elite rice hybrid. Proc Natl Acad Sci USA. 2003;100(5):2574–2579. doi: 10.1073/pnas.0437907100. [DOI] [PMC free article] [PubMed] [Google Scholar]
- 22.Kusterer B, et al. Heterosis for biomass-related traits in Arabidopsis investigated by quantitative trait loci analysis of the triple testcross design with recombinant inbred lines. Genetics. 2007;177(3):1839–1850. doi: 10.1534/genetics.107.077628. [DOI] [PMC free article] [PubMed] [Google Scholar]
- 23.Liang GH, Dayton AD, Reddy CR. Heterosis, inbreeding depression, and heritability estimates in a systematic series of grain-sorghum genotypes. Crop Sci. 1972;12(4):409–411. [Google Scholar]
- 24.Pfeiffer TW, Bitzer MJ, Toy JJ, Pedersen JF. Heterosis in sweet sorghum and selection of a new sweet sorghum hybrid for use in syrup production in Appalachia. Crop Sci. 2010;50(5):1788–1794. [Google Scholar]
- 25.Ben-Israel I, Kilian B, Nida H, Fridman E. Heterotic trait locus (HTL) mapping identifies intra-locus interactions that underlie reproductive hybrid vigor in Sorghum bicolor. PLoS One. 2012;7(6):e38993. doi: 10.1371/journal.pone.0038993. [DOI] [PMC free article] [PubMed] [Google Scholar]
- 26.Packer DJ, Rooney WL. High-parent heterosis for biomass yield in photoperiod-sensitive sorghum hybrids. Field Crops Res. 2014;167:153–158. [Google Scholar]
- 27.Quinby JR. Manifestations of hybrid vigor in sorghum. Crop Sci. 1963;3(4):288–291. [Google Scholar]
- 28.Sinha SK, Khanna R. Physiological, biochemical, and genetic basis of heterosis. Adv Agron. 1975;27:123–174. [Google Scholar]
- 29.Uzarowska A, et al. Comparative expression profiling in meristems of inbred-hybrid triplets of maize based on morphological investigations of heterosis for plant height. Plant Mol Biol. 2007;63(1):21–34. doi: 10.1007/s11103-006-9069-z. [DOI] [PubMed] [Google Scholar]
- 30.Flint-Garcia SA, Buckler ES, Tiffin P, Ersoz E, Springer NM. Heterosis is prevalent for multiple traits in diverse maize germplasm. PLoS One. 2009;4(10):e7433. doi: 10.1371/journal.pone.0007433. [DOI] [PMC free article] [PubMed] [Google Scholar]
- 31.Shen G, Zhan W, Chen H, Xing Y. Dominance and epistasis are the main contributors to heterosis for plant height in rice. Plant Sci. 2014;215-216:11–18. doi: 10.1016/j.plantsci.2013.10.004. [DOI] [PubMed] [Google Scholar]
- 32.Xiao J, Li J, Yuan L, McCouch SR, Tanksley SD. Genetic diversity and its relationship to hybrid performance and heterosis in rice as revealed by PCR-based markers. Theor Appl Genet. 1996;92(6):637–643. doi: 10.1007/BF00226083. [DOI] [PubMed] [Google Scholar]
- 33.Zhang Y, Ni Z, Yao Y, Nie X, Sun Q. Gibberellins and heterosis of plant height in wheat (Triticum aestivum L.) BMC Genet. 2007;8:40. doi: 10.1186/1471-2156-8-40. [DOI] [PMC free article] [PubMed] [Google Scholar]
- 34.Quinby JR, Karper RE. inheritance of height in sorghum. Agron J. 1954;46(5):211–216. [Google Scholar]
- 35.Multani DS, et al. Loss of an MDR transporter in compact stalks of maize br2 and sorghum dw3 mutants. Science. 2003;302(5642):81–84. doi: 10.1126/science.1086072. [DOI] [PubMed] [Google Scholar]
- 36.Brown PJ, Rooney WL, Franks C, Kresovich S. Efficient mapping of plant height quantitative trait loci in a sorghum association population with introgressed dwarfing genes. Genetics. 2008;180(1):629–637. doi: 10.1534/genetics.108.092239. [DOI] [PMC free article] [PubMed] [Google Scholar]
- 37.Morris GP, et al. Population genomic and genome-wide association studies of agroclimatic traits in sorghum. Proc Natl Acad Sci USA. 2013;110(2):453–458. doi: 10.1073/pnas.1215985110. [DOI] [PMC free article] [PubMed] [Google Scholar]
- 38.Klein RR, et al. 2008. The effect of tropical sorghum conversion and inbred development on genome diversity as revealed by high-resolution genotyping. Crop Sci (Supplement 1):S-12–S-26.
- 39.Casa AM, et al. Community resources and strategies for association mapping in sorghum. Crop Sci. 2008;48(1):30–40. [Google Scholar]
- 40.Murray SC, Rooney WL, Hamblin MT, Mitchell SE, Kresovich S. Sweet sorghum genetic diversity and association mapping for brix and height. Plant Genome. 2009;2(1):48–62. [Google Scholar]
- 41.Upadhyaya HD, Wang Y-H, Gowda CLL, Sharma S. Association mapping of maturity and plant height using SNP markers with the sorghum mini core collection. Theor Appl Genet. 2013;126(8):2003–2015. doi: 10.1007/s00122-013-2113-x. [DOI] [PubMed] [Google Scholar]
- 42.Segura V, et al. An efficient multi-locus mixed-model approach for genome-wide association studies in structured populations. Nat Genet. 2012;44(7):825–830. doi: 10.1038/ng.2314. [DOI] [PMC free article] [PubMed] [Google Scholar]
- 43.Birchler JA, Yao H, Chudalayandi S, Vaiman D, Veitia RA. Heterosis. Plant Cell. 2010;22(7):2105–2112. doi: 10.1105/tpc.110.076133. [DOI] [PMC free article] [PubMed] [Google Scholar]
- 44.Kaeppler S. Heterosis: Many genes, many mechanisms - end the search for an undiscovered unifying theory. ISRN Botany. 2012;2012:682824. [Google Scholar]
- 45.Li L, et al. Dominance, overdominance and epistasis condition the heterosis in two heterotic rice hybrids. Genetics. 2008;180(3):1725–1742. doi: 10.1534/genetics.108.091942. [DOI] [PMC free article] [PubMed] [Google Scholar]
- 46.Russell WA, Eberhart SA, Vega UA. Recurrent selection for specific combining ability for yield in 2 maize populations. Crop Sci. 1973;13(2):257–261. [Google Scholar]
- 47.Huang X, et al. Genomic analysis of hybrid rice varieties reveals numerous superior alleles that contribute to heterosis. Nat Commun. 2015;6:6258. doi: 10.1038/ncomms7258. [DOI] [PMC free article] [PubMed] [Google Scholar]
- 48.Gardner CO, Lonnquist JH. Linkage and the degree of dominance of genes controlling quantitative characters in maize. Agron J. 1959;51(9):524–528. [Google Scholar]
- 49.Moll RH, Lindsey MF, Robinson HF. Estimates of genetic variances and level of dominance in maize. Genetics. 1964;49(3):411–423. doi: 10.1093/genetics/49.3.411. [DOI] [PMC free article] [PubMed] [Google Scholar]
- 50.McMullen MD, et al. Genetic properties of the maize nested association mapping population. Science. 2009;325(5941):737–740. doi: 10.1126/science.1174320. [DOI] [PubMed] [Google Scholar]
- 51.Li X, Zhu C, Wang J, Yu J. Computer simulation in plant breeding. Adv Agron. 2012;116:219–264. [Google Scholar]
- 52.Higgins RH, Thurber CS, Assaranurak I, Brown PJ. 2014. Multiparental mapping of plant height and flowering time QTL in partially isogenic sorghum families. G3-Genes Genomes Genetics 4(9):1593–1602. [DOI] [PMC free article] [PubMed]
- 53.Srinivas G, et al. Identification of quantitative trait loci for agronomically important traits and their association with genic-microsatellite markers in sorghum. Theor Appl Genet. 2009;118(8):1439–1454. doi: 10.1007/s00122-009-0993-6. [DOI] [PubMed] [Google Scholar]
- 54.Salas Fernandez MG, Becraft PW, Yin Y, Lübberstedt T. From dwarves to giants? Plant height manipulation for biomass yield. Trends Plant Sci. 2009;14(8):454–461. doi: 10.1016/j.tplants.2009.06.005. [DOI] [PubMed] [Google Scholar]
- 55.Davies PJ. 2004. Plant Hormones: Biosynthesis, Signal Transduction, Action! (Springer, Dordrecht) Ed. 3.
- 56.Thurber CS, Ma JM, Higgins RH, Brown PJ. Retrospective genomic analysis of sorghum adaptation to temperate-zone grain production. Genome Biol. 2013;14(6):R68. doi: 10.1186/gb-2013-14-6-r68. [DOI] [PMC free article] [PubMed] [Google Scholar]
- 57.Zamir D. Improving plant breeding with exotic genetic libraries. Nat Rev Genet. 2001;2(12):983–989. doi: 10.1038/35103590. [DOI] [PubMed] [Google Scholar]
- 58.Yu J, Hamblin M, Tuinstra M. In: Association Genetics Strategies and Resources. Genomics of the Saccharinae, Plant Genetics and Genomics: Crops and Models. Paterson AH, editor. Vol 11. Springer; New York: 2013. pp. 187–203. [Google Scholar]
- 59.Doyle JJ. 1987. A rapid DNA isolation procedure for small quantities of fresh leaf tissue. Phytochem Bull 19:11–15.
- 60.Elshire RJ, et al. A robust, simple genotyping-by-sequencing (GBS) approach for high diversity species. PLoS One. 2011;6(5):e19379. doi: 10.1371/journal.pone.0019379. [DOI] [PMC free article] [PubMed] [Google Scholar]
- 61.Wu Y, Bhat PR, Close TJ, Lonardi S. Efficient and accurate construction of genetic linkage maps from the minimum spanning tree of a graph. PLoS Genet. 2008;4(10):e1000212. doi: 10.1371/journal.pgen.1000212. [DOI] [PMC free article] [PubMed] [Google Scholar]
- 62.Wang S, Basten CJ, Zeng Z-B. Windows QTL Cartographer 2.5. Department of Statistics, North Carolina State University; Raleigh, NC: 2012. [Google Scholar]
- 63.Browning SR, Browning BL. Rapid and accurate haplotype phasing and missing-data inference for whole-genome association studies by use of localized haplotype clustering. Am J Hum Genet. 2007;81(5):1084–1097. doi: 10.1086/521987. [DOI] [PMC free article] [PubMed] [Google Scholar]
- 64.Lipka AE, et al. GAPIT: Genome association and prediction integrated tool. Bioinformatics. 2012;28(18):2397–2399. doi: 10.1093/bioinformatics/bts444. [DOI] [PubMed] [Google Scholar]
- 65.Zhang Z, et al. Mixed linear model approach adapted for genome-wide association studies. Nat Genet. 2010;42(4):355–360. doi: 10.1038/ng.546. [DOI] [PMC free article] [PubMed] [Google Scholar]