Significance
Knowing the direction and pace of evolutionary change is critical to understanding what selective forces shaped our ancestors. Unfortunately, the human fossil record is sparse, and little is known about the earliest members of our lineage. This unresolved ancestor complicates reconstructions of what behavioral shifts drove major speciation events. Using 3D shape measurements of the shoulder, we tested competing evolutionary models of the last common ancestor against the fossil record. We found that a sustained shift in scapular shape occurred during hominin evolution from an African ape-like ancestor to a modern human-like form, first present in our genus, Homo. These data suggest a long, gradual shift out of the trees and increased reliance on tools as our ancestors became more terrestrial.
Keywords: geometric morphometrics, developmental simulation, phylomorphospace, scapula, rotator cuff
Abstract
Reconstructing the behavioral shifts that drove hominin evolution requires knowledge of the timing, magnitude, and direction of anatomical changes over the past ∼6–7 million years. These reconstructions depend on assumptions regarding the morphotype of the Homo–Pan last common ancestor (LCA). However, there is little consensus for the LCA, with proposed models ranging from African ape to orangutan or generalized Miocene ape-like. The ancestral state of the shoulder is of particular interest because it is functionally associated with important behavioral shifts in hominins, such as reduced arboreality, high-speed throwing, and tool use. However, previous morphometric analyses of both living and fossil taxa have yielded contradictory results. Here, we generated a 3D morphospace of ape and human scapular shape to plot evolutionary trajectories, predict ancestral morphologies, and directly test alternative evolutionary hypotheses using the hominin fossil evidence. We show that the most parsimonious model for the evolution of hominin shoulder shape starts with an African ape-like ancestral state. We propose that the shoulder evolved gradually along a single morphocline, achieving modern human-like configuration and function within the genus Homo. These data are consistent with a slow, progressive loss of arboreality and increased tool use throughout human evolution.
The human shoulder exhibits a unique combination of traits for a primate, a fact that has complicated previous attempts to reconstruct both its functional and evolutionary history. Notably, humans are most closely related to knuckle-walking/suspensory chimpanzees and bonobos (Pan or panins) (1, 2), yet morphometric analyses suggest that our shoulders are most similar in shape to that of the highly arboreal, quadrumanous orangutan (Pongo) (3–5). The hominin fossil record is similarly complicated. Scapular remains attributed to Australopithecus afarensis are described as similar to Gorilla (6–8) whereas the more recent Australopithecus sediba (MH2) displays morphometric affinities to both African apes (gorillas, chimpanzees, and bonobos) and Pongo (9). This mix of character states raises the question of whether modern human morphology reflects evolution from a more derived African ape morphology or retention of primitive traits from an earlier ape ancestor.
A critical piece of evidence for solving this puzzle is the morphotype of the hominin–panin last common ancestor (LCA) (∼6–7 Mya). Although the fossil record near the hypothesized divergence time with Pan is the most direct means of addressing what the anatomy of the LCA shoulder was like, both hominin and African ape fossils from this time period are rare, fragmentary, and poorly understood (10, 11). Despite these difficulties, competing hypotheses about the LCA make explicit and mutually exclusive predictions of the direction, magnitude, and ordering of character transformations that we should observe in the fossil record. Moreover, the likelihood of these alternative hypotheses can be directly tested using the better characterized later hominin fossil record. Specifically, given alternative ancestral conditions, one can model the associated evolutionary trajectories and intermediate states connecting them to the descendant populations and test how well these predictions fit the available fossil evidence.
Two hypotheses of the LCA postcranial morphotype have been proposed, both requiring different selection pressures and levels of homoplasy. In the first scenario, a number of anatomical and locomotor traits shared among closely related African apes are thought to be homologous (12–14) and represent the ancestral state of the LCA from which early hominins evolved [an “African ape” (AA) model] (15). In particular, panins are thought to be phenotypically conservative and thus a useful, if imperfect, proxy for the anatomy and positional behavior of our shared LCA (1) (Fig. 1A). In the second scenario, the mosaicism that characterizes the known fossil ape record (e.g., refs. 16–19) supports the argument that many living ape similarities are not homologies (20); thus the ancestral morphotype for both apes and humans [i.e., the “Miocene ape ancestor” (MAA)] would reflect a more primitive, generalized postcranial morphotype and positional behavior [an “ape convergence” (AC) model]. For example, some have argued from differences in African ape wrist morphology that knuckle walking behaviors evolved in parallel (21, 22), in which case the LCA must be more primitive. Thorpe et al. (23, 24) used similar reasoning to assert that hominins did not evolve from a knuckle-walking LCA, but rather one that practiced the hand-assisted, arboreal bipedality observed in living orangutans (Fig. 1B). Lovejoy et al. (25) noted that many features of the early hominin Ardipithecus ramidus do not resemble African apes and argued that this difference was evidence of a cautious, above-branch, arboreal LCA, more similar to early quadrupedal Miocene apes like Proconsul than the orthograde and suspensory crown taxa (26) (Fig. 1C).
Fig. 1.
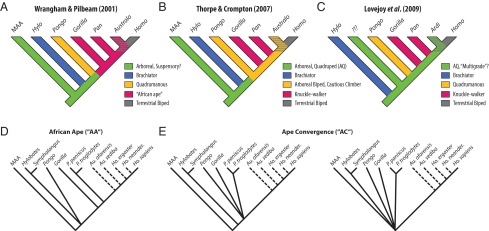
Alternative models of the hominin–panin last common ancestor (LCA). The branching pattern of living apes as inferred from genomic data is agreed upon; however, reconstruction of ancestral nodes differs among researchers. (A) In the African ape (AA) model, hominins derive from a knuckle-walking African ape-like LCA, typically conceived of as chimpanzee-like. (B and C) Ape convergence (AC) models hypothesize that the LCA is either a more generalized great ape or an unknown primitive ancestral Miocene ape. AQ, arboreal quadrupedalism. (D and E) Phylogenetic trees used to model these differences, with evolution from a common morphotype represented by a polytomy. Hominin phylogeny based on ref. 58.
To test these alternative evolutionary models of the Homo–Pan LCA, we used Procrustes-based geometric morphometrics methods to summarize the major sources of 3D variation and covariation in the shape of one structural component of the shoulder, the scapula. When combined with a phylogenetic hypothesis (Fig. 1D), the resulting “phylomorphospace” provides explicit predictions about the evolutionary trajectories connecting hypothesized ancestral and descendant populations, associated character state transformations, and proposed ancestral conditions (27), which we tested against the hominin fossil record. Our results demonstrate that many seemingly contradictory results from previous analyses are both predictable outcomes of how scapula morphospace is occupied and consistent with our understanding of how scapular shape is linked to function. Moreover, they suggest explicit alternative development hypotheses that provide a basis for future attempts to validate phylogenetic models in human evolution.
Results
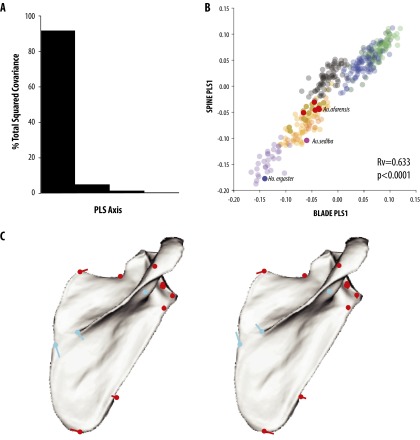
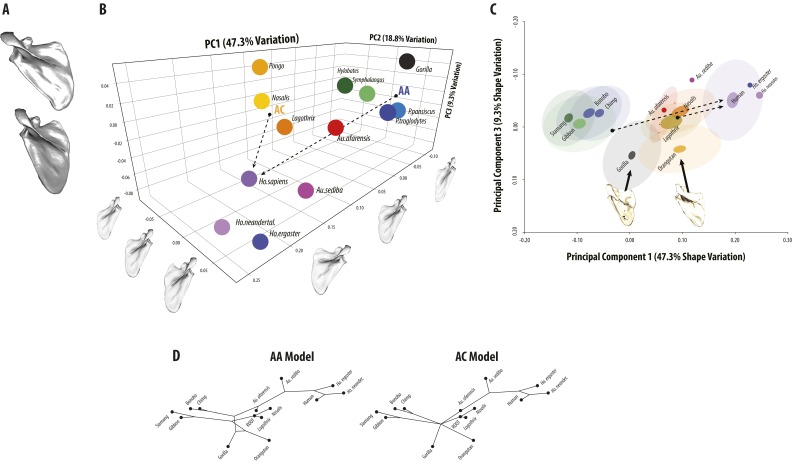
We first performed a principal components analysis (PCA) of scapula shape and found that the majority of hominoid variation (∼75%) is partitioned along three axes that discriminate taxa, have biological/functional relevance, and are meaningful above random error (Fig. 2 A–D and Fig. S1). The first axis (PC1) is associated with the angle of the scapular spine and glenoid relative to the vertebral border of the blade, which is near perpendicular in MAA proxies and Pongo but has a more cranial orientation in African apes and hylobatids. More perpendicular spines tend to be longer and the blade wider, accounting for almost all of their covariation (Fig. S2). The second axis (PC2) distinguishes the superiorly projecting vertebral and superior borders and relatively large supraspinous fossa in African apes from a superior border parallel to the spine and a smaller supraspinous in the MAA proxies, Pongo, and hylobatids. As in previous analyses (3, 4), Homo does not significantly overlap with any primate but instead resides in a unique position that combines primitive “quadrupedal” characteristics like a long, robust scapular spine that is perpendicular to the vertebral border (similar to Nasalis, Lagothrix, and Pongo, but further lateralized) with a blade shape more typical of African apes. The third axis primarily distinguishes Gorilla and Pongo from all other taxa and is associated with a scapular blade that is medio-laterally wider than accounted for by PC1 alone (Fig. S3).
Fig. 2.
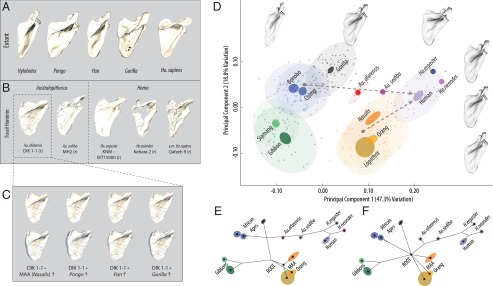
Comparative and evolutionary scapula shape morphospace. (A and B) Representative hominoid scapulae and fossil hominins, shown scaled to identical vertebral border length. (C) Developmental simulations of DIK 1-1 (A. afarensis) using growth vectors from alternate proposed LCA morphotypes. (Top) Simulations. (Bottom) Simulations with DIK 1-1 scapula overlay (transparent blue), scaled to the same size to highlight shape differences. (D) PC1 and -2 morphospace with mean specimen warped along each axis to show associated shape changes. PC1 describes orientation of the spine relative to the blade whereas PC2 describes differences in the borders of the supraspinous fossa. Dashed arrows show the direct evolutionary vector from hypothetical ancestral states (AA, African ape mean; AC, MAA mean) to modern humans. Points, individual specimens; dark ellipses, 90% confidence interval (CI) of the mean; light ellipses, 90% CI of the sample; red points, DIK 1-1 developmental simulations. (E and F) Phylogenetic reconstruction for the AA (tree length = 0.085, P < 0.0001) and AC (tree length = 0.100, P < 0.0001) models illustrates alternative predictions for branching patterns and ancestral states within the morphospace.
Fig. S1.
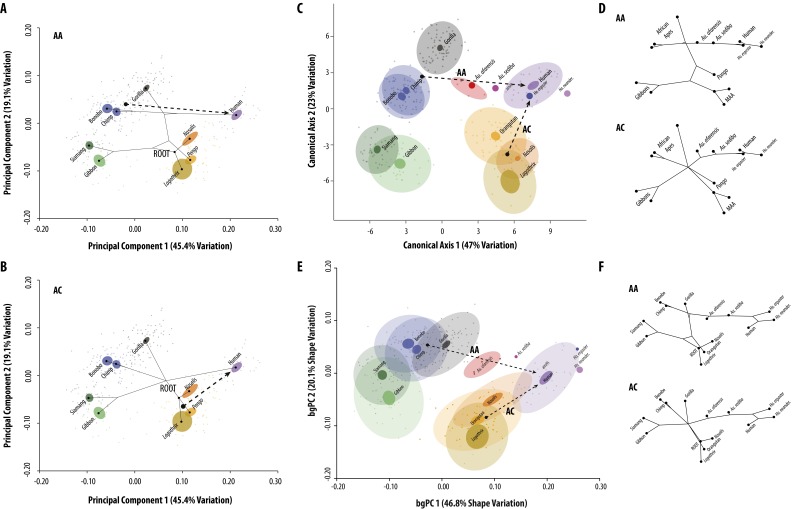
Extended shape analyses. (A and B) Principal components analysis (PCA) using only the extant species. Phylogenetic reconstructions are shown as branching patterns, with ancestral nodes at branch joints. Dashed lines show the most direct evolutionary path between hypothesized ancestral and descendant states. AA, African ape model; AC, ape convergence model. (C) Canonical variates analysis (CVA) showing the first two axes. Distribution of species and associated shape vectors are similar to those identified in the PCA (Fig. 2) but show greater separation due to the methodology. (D) Phylogenetic reconstructions within the CVA morphospace using a method of squared-change parsimony on the CV1 and -2 axes while using alternative tree hypotheses (Fig. 1 D and E). Results show that a simple morphocline separates Pan and Homo in CV1 for the AA model, and a two-step process in CV1 and -2 for the AC model. (E) Results of the between-group principal components analysis (bgPCA) are largely identical to the PCA and CVA although there is reduced discrimination of African apes, suggesting that Pan and Gorilla may be even more similar when sample size effects are taken into account. (F) The phylogenetic reconstruction within the bgPCA morphospace is also concordant with other ordination results. Color coding is the same as in Fig. 2D. Red dots represent different developmental simulations of DIK 1-1 (A. afarensis).
Fig. S2.
Partial least squares (PLS) results. (A) Distribution of covariation between blade and spine shows that the majority of shape variation is associated with the first axis. (B) Plot of PLS1 axes for blade and spine variation shows a highly significant association of shape variation covariation (Rv = 0.633, P < 0.0001). (C) Associated PLS shape vector direction and magnitudes for positive (+0.10) and negative (−0.15) shown on the mean configuration (red, blade landmarks; blue, spine landmarks).
Fig. S3.
Extended PCA results. (A) Visualization of PC3 shape changes from positive (Top) to negative (Bottom). Gorilla and Pongo differ from all other taxa in having moderately wider scapula beyond those identified in PC1. (B) Three-dimensional scatterplot of PC1, PC2, and PC3. Dashed lines show approximate direct evolutionary vectors connecting hypothesized ancestral and descendant species for the AA and AC models. (C) Two-dimensional scatterplot of PC1 vs. PC3 with examples of Gorilla and Pongo shown. (D) Reconstructed phylogenetic trees from the PC1 and PC3 morphospace from Fig. 2. Note that the PC3 axis is reversed in A and B relative to the trees shown in C and D.
We next reconstructed the predicted ancestral states by mapping the trees for each alternative phylogenetic scenario in the comparative morphospace (Fig. 2 E and F and Fig. S1 A and B). Both the AA and AC trees locate the basal hominoid node, reflecting the common ancestral morphotype of apes, in a region consistent with hypothesized MAA proxies (Nasalis and Lagothrix) and similar to Pongo. Only close sister taxa overlap in the first two axes of this morphospace, confirming that hominoids do not share a common “suspensory” shoulder morphology (20, 28). However, these trees otherwise differ in the magnitude and location of homoplasy required.
In the AA model, a direct path from Pan to Homo predicts changes in the apportionment of the fossae and associated blade width as orientation of the spine became more perpendicular relative to the vertebral border and the glenoid more inferiorly positioned (Fig. S1A and Movie S1). Interestingly, this vector passes through a “Gorilla”-like morphospace and the inferred African ape LCA along PC1. This arrangement predicts that ancestral hominins shared the common African ape blade shape and spine angle with Gorilla but lacked the further expansion of the vertebral border and supraspinous found in this large African ape. The phylomorphospace reconstruction is largely concordant with this vector, predicting that the common ancestor of African apes and humans was similar to Pan in blade shape, but with a less angulated spine and wider blade as in Gorilla. This tree therefore requires one instance of homoplasy to explain similarities between Pan and gibbons in glenoid/spine angulation whereas Gorilla exhibits an independent expansion of the supraspinous from a generalized African ape morphotype. In this scenario, both Pongo and hylobatids retain the primitive blade shape in which the superior border more closely parallels the spine, with the gibbons independently evolving a more cranial spine and glenoid position with associated narrowing of the blade.
In contrast, the evolutionary vector reconstructed from either an MAA proxy or a Pongo-like LCA to humans predicts that hominins would be convergent on African apes in blade shape whereas the more inferior orientation of the spine and glenoid is derived from a similar condition in the MAA (Fig. S1B and Movie S2). The phylomorphospace analysis reconstructs a different path in which the basal hominoid node is intermediate in both blade shape and spine angulation relative to all extant apes. In this case, the AC model requires three independent episodes of convergence between humans, panins, and Gorilla in blade shape and two independent events to explain convergence between Pongo and hylobatids, as well as the previously mentioned convergence in spine angulation predicted by the AA model for panins and hylobatids.
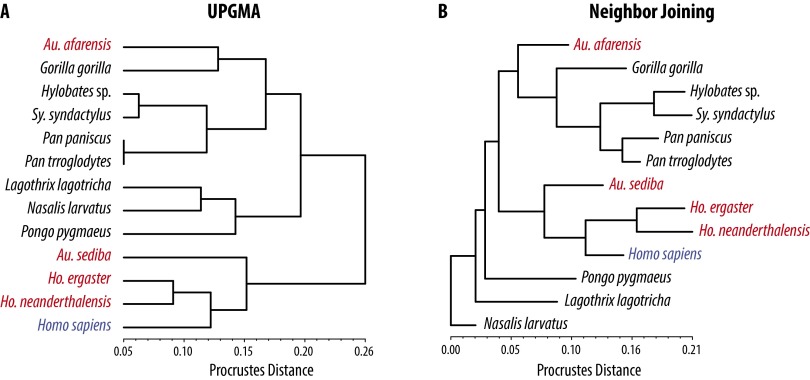
Consistent with the AA model, we found that, when fossil taxa were included in the analysis (Fig. 2B), australopithecines are intermediate between panins and Homo whereas all hominins are arranged in a roughly temporal/phylogenetic gradient from older and more primitive species (A. afarensis) to younger (A. sediba) and/or more derived species (Homo ergaster, Homo neanderthalensis) (Fig. S4). Developmental simulations under a range of hypothetical ontogenetic vectors on average “grow” the juvenile A. afarensis in the direction of a more African ape-like blade shape along PC2 (Fig. 2 C–E). These data suggest that some of the resemblance of the A. afarensis juvenile to Pongo and MAA blade shape is attributable to the fact that, in all anthropoids, younger individuals tend to be wider and have less developed fossae (29), consistent with PC2. As measured by Procrustes distance, A. afarensis simulations are most similar in shape to Gorilla and Nasalis (Table S1 and Fig. S5), the former of which is consistent with previous analyses (6, 8). However, the evolutionary vector from Pan to australopithecines and humans passes “underneath” and not “through” the space occupied by Gorilla in the second and third axes of the PCA and canonical variates analysis (CVA). This simple, linear trajectory is consistent with evolution from either a more Pan-like LCA or a generalized African ape, both consistent with the AA model. Both H. ergaster and H. neanderthalensis are located in a “hyper”-human location in morphospace, which is due to both a spine angle that is lateralized (PC1), and the cranial orientation of the vertebral border above the suprascapular notch (PC2). This difference may reflect natural variability because both H. ergaster and H. neanderthalensis are located within the 90% frequency ellipses of the modern human sample (Fig. S2D). Alternatively, modern humans have subsequently experienced changes in supraspinous size and spine angulation due to selection, random drift, or a combination of both.
Fig. S4.
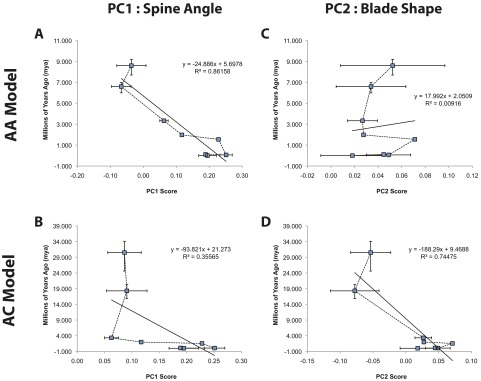
PC scores versus time. (A–D) Regressions of PC1 shape scores on both estimated divergence time (ancestral nodes) and geologic age (fossils) illustrate alternative predictions for the timing and strength of selection in the hominin lineage on spine and glenoid orientation.
Table S1.
Procrustes distances between species pairs below the diagonal and P values (10,000 permutations) above the diagonal
| Species | A. afa | A. sed | G. gor | H. erg | H. nea | H. sap | Hy. sp. | L. lag | N. lar | P. pan | P. tro | P. pyg | S. syn |
| A. afarensis | — | 0.141 | *** | 0.039 | 0.037 | *** | *** | 0.000 | *** | *** | *** | *** | *** |
| A. sediba | 0.132 | — | 0.014 | n/a | 0.333 | 0.164 | 0.023 | 0.019 | 0.050 | 0.016 | 0.017 | 0.018 | 0.003 |
| G. gorilla | 0.128 | 0.206 | — | 0.012 | 0.000 | *** | *** | *** | *** | *** | *** | *** | *** |
| H. ergaster | 0.199 | 0.153 | 0.275 | — | n/a | 0.176 | 0.014 | 0.080 | 0.026 | 0.011 | 0.010 | 0.021 | 0.008 |
| H. neander. | 0.215 | 0.175 | 0.286 | 0.089 | — | 0.025 | 0.001 | 0.002 | 0.001 | 0.001 | 0.001 | 0.001 | 0.000 |
| H. sapiens | 0.159 | 0.130 | 0.229 | 0.132 | 0.111 | — | *** | *** | *** | *** | *** | *** | *** |
| Hy. sp. | 0.200 | 0.265 | 0.190 | 0.374 | 0.382 | 0.311 | — | *** | *** | *** | *** | *** | *** |
| L. lagotricha | 0.155 | 0.197 | 0.213 | 0.263 | 0.268 | 0.204 | 0.197 | — | *** | *** | *** | *** | *** |
| N. larvatus | 0.121 | 0.134 | 0.181 | 0.206 | 0.216 | 0.162 | 0.216 | 0.113 | — | *** | *** | *** | *** |
| P. paniscus | 0.170 | 0.223 | 0.133 | 0.330 | 0.346 | 0.284 | 0.130 | 0.233 | 0.198 | — | *** | *** | *** |
| P. troglodytes | 0.152 | 0.208 | 0.118 | 0.314 | 0.326 | 0.260 | 0.124 | 0.214 | 0.188 | 0.046 | — | *** | *** |
| P. pygmaeus | 0.163 | 0.195 | 0.188 | 0.260 | 0.246 | 0.179 | 0.208 | 0.150 | 0.136 | 0.221 | 0.200 | — | *** |
| S. syndactylus | 0.207 | 0.267 | 0.186 | 0.379 | 0.388 | 0.321 | 0.059 | 0.232 | 0.239 | 0.112 | 0.106 | 0.228 | — |
A. afarensis (A. afa), Australopithecus afarensis; A. sediba (A. sed), Australopithecus sediba; G. gorilla (G. gor), Gorilla gorilla; H. ergaster (H. erg), Homo ergaster; H. neander. (H. nea), Homo neanderthalensis; H. sapiens (H. sap), Homo sapiens; Hy. sp., Hylobates sp.; L. lagotricha (L. lag), Lagothrix lagotricha; N. larvatus (N. lar), Nasalis larvatus; P. paniscus (P. pan), Pan paniscus; P. troglodytes (P. tro), Pan troglodytes; P. Pygmaeus (P. pyg), Pongo pygmaeus; S. Syndactylus (S. syn), Symphalangus syndactylus. ***P ≤ 0.001.
Fig. S5.
Procrustes distance trees. (A) Tree generated using the unweighted pair group method with arithmetic mean (UPGMA) method. (B) Tree generated using the neighbor joining (NJ) method. In both cases, A. afarensis is associated with Gorilla whereas either H. ergaster or H. neanderthalensis is associated with H. sapiens. Procrustes distances and significance values are found in Table S1.
Discussion
By calculating evolutionary vectors through scapula shape morphospace and testing these models against a better characterized fossil record, we found that the course of hominin shoulder evolution is consistent with the AA model predictions. Specifically, fossil hominins occupy a region of scapula morphospace that is intermediate between African apes and modern humans and are arranged in a temporal gradient consistent with their inferred phylogenetic position (Fig. S4 A–D). These data strongly support a model in which the modern human shoulder evolved from an African ape-like LCA via long-term, directional selection on a single but integrated trait: a longer and more lateralized configuration of the spine and glenoid mapped onto a shared African ape blade shape (Fig. 3). This result implies that previously noted similarities of the human shoulder to quadrupedal apes and Pongo are convergent. This interpretation is not only more parsimonious than evolution from a generalized, quadrupedal LCA morphotype, but is also consistent with functional explanations for the evolution of this suite of traits in the hominin lineage and our current understanding of scapular morphogenesis and development.
Fig. 3.
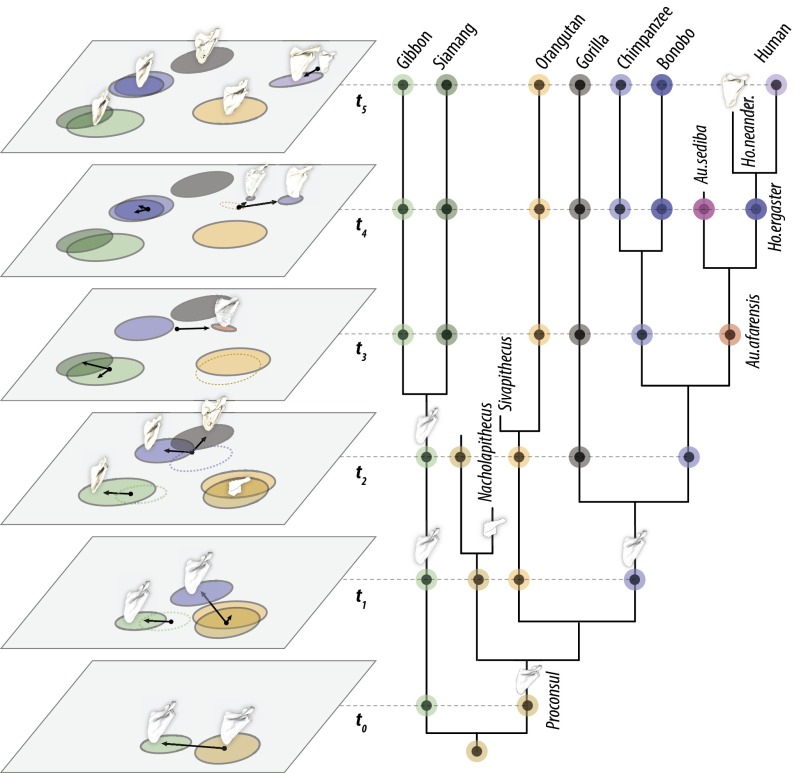
Model of shoulder shape evolution. Scapula morphospace is reconstructed at individual time horizons (tn) for the phylogeny shown. The ancestral hominoid condition is reconstructed to be similar in shape and configuration to Pongo (t0). Pongo shares with Lagothrix a penchant for slow, cautious movements through high forest canopy, including frequent bouts of pronograde suspensory locomotion (59–61). This similarity suggests that derived “suspensory” postcranial characteristics of Pongo shared with other apes are partially convergent, consistent with evidence from Sivapithecus (16). In this model, hylobatids evolved a more cranially oriented spine and glenoid from this morphotype, which is predicted to fall in the intermediate space (t1–2). African apes evolved a unique blade shape with cranial spine (t1), subsequently diversifying into Pan and Gorilla lineages (t2). Hominins retained the ancestral African ape blade shape, but the angle of the spine relative to the vertebral border gradually shifted (t3–4), consistent with realignment of the shoulder musculature due to selection associated with more lateralized activities and/or reduced reliance on overhead activities (e.g., climbing).
These conclusions assume that reconstructed morphospaces accurately capture potential variation and that ancestral states can be reasonably estimated by phylogenetic reconstruction within them. In the former, the concordance of our results with previous analyses (e.g., ref. 29) suggests that the major contributors to primate scapula shape are contained within a few integrated variables, and therefore fossil primates are unlikely to deviate markedly from this pattern. In the latter, there is no a priori reason to believe that species evolve along the most direct path between states. But in either case, these assumptions are testable, particularly because homoplasy would be reflected by species occupying a similar morphospace that their common ancestor did not. In this regard, both the AA and AC models infer that homoplasy has occurred in the living ape shoulder but differ in when and where convergence occurred.
The most evolutionarily labile trait in the scapula is the angle of the spine and glenoid relative to the vertebral border, with Pan and hylobatids at one extreme and humans at the other. In both trees, the reconstruction of ancestral states suggests that spine angulation is a highly evolvable trait prone to convergence. The arrangement of hominins in a temporal sequence along this axis further corroborates that spine angle can evolve in a continuous manner independently of other scapular anatomy, consistent with what is known of spine development (see below). In contrast, blade shape better reflects phylogenetic relationships because humans are similar to African apes, which together differ from the inferred primitive pattern found in hylobatids, Pongo, and the MAA proxies. The AA model reconstructs a single event to evolve African ape blade morphology whereas the AC model predicts an intermediate ancestor to all apes that subsequently radiated into the living hominoid lineages. In the case of African apes and humans, if there is no functional association with the supraspinous shape, it is not obvious what selective forces drove this convergence. The supraspinous morphology of African apes, and particularly Gorilla, is thought to be a compromise that enables stabilization of the shoulder joint against shear forces generated during quadrupedal knuckle walking while retaining the dorsal position that enhances climbing (30). If this functional interpretation were correct, then any argument for homoplasy among African apes and hominins in this trait would imply that all three independently evolved knuckle walking.
Although the AA model is more parsimonious than the AC model, ancestral state reconstruction of the African ape node does not overlap either extant species. This result leaves open the question of whether australopiths are similar to Gorilla because they approximate the ancestral African ape morphotype or whether they “reevolved” this generalized condition from a more Pan-like shoulder. Although the ancestral state reconstruction supports a generalized African ape ancestor, there are reasons to prefer a more Pan-like condition. Notably, many morphological differences between Pan and Gorilla are associated with body size (13, 31, 32), and early hominin body size is comparable with the chimpanzee (33). Body size is also strongly linked to social structure; thus, any reconstruction invoking a Gorilla-like body size would also have additional implications beyond the skeletal phenotype (e.g., multimale, multifemale in Pan troglodytes vs. a single male, multifemale group in Gorilla) (15). Regardless, if the LCA was more Pan-like, then early hominins reevolved a Gorilla-like spine/glenoid angle, but if more Gorilla-like, then the more cranial angle in Pan is a later evolutionary event convergent on some hylobatids, perhaps due to increased arborealism relative to the ancestral African ape. Absent fossil representatives of either Pan or Gorilla lineages, it is not possible to discriminate these alternatives.
The correspondence of the current hominin fossil record to both the AA evolutionary vector and the phylomorphospace, as well as the magnitude of the phenotypic shift and the relatively short timeframe over which it occurred, are all strong circumstantial evidence that these changes were predominantly driven by sustained directional selection and not genetic drift. This inference is consistent with its functional association because the angle of the spine is directly tied to the predominant direction of forelimb actions (e.g., overhead vs. lateralized). In particular, selection on the relative positions of the blade and spine is associated with the cranio-caudal orientation of the glenoid (Fig. 3). This gradual shift in spine and glenoid angle affects the fiber orientation of the pectoral and scapular muscles, altering the position of the upper limb where force production is optimized (34). The reduced, caudally shifted angle in Homo is consistent with both a decreased reliance on use of the upper limb for overhead actions, such as climbing, and the increased use of lateralized behaviors, such as tool use and throwing. The slow, sustained pace over which these changes took place suggests that, whereas they conferred a selective advantage for lateralized actions in the hominin lineage, they may have been balanced by a tradeoff with other factors, such as continued use in arboreal contexts. The early appearance of a moderate caudal shift in spine and glenoid, dating to Australopithecus, is consistent with new evidence suggesting that tool use extends well past the origins of Homo (35–37). Interestingly, the later A. sediba has a more human-like shoulder compared with earlier A. afarensis, suggesting that the ancestor of A. sediba and Homo shared the more derived configuration. That said, it is not until the emergence of later Homo that a modern scapular configuration was largely in place (38, 39). This final shift toward a fully lateralized spine and glenoid was likely costly to climbing efficiency and/or arm hanging (40), while also increasing shear stress at the shoulder and elevating the risk of rotator cuff injury (41, 42). Given the fitness value of efficient climbing for accessing food and avoiding predators, we speculate that the selective forces driving this shift must also have been significant.
Both models posit a series of changes to both the position of the spine and the shape of the blade in multiple lineages. Later postnatal growth has a relatively limited and similar effect on blade shape across lineages whereas spine angle does not change with age (29). These facts suggest that genetic regulation of the early positioning of muscles, spine, and acromion are critical to establishing species differences rather than later growth or functional remodeling. Identifying the genetic and molecular mechanisms that control variation in scapular morphogenesis may provide a novel approach to directly test among alternative evolutionary models. For example, each model makes predictions about the timing and history of selection on cis-regulatory elements that control developmental traits (e.g., the spine in Fig. S4A). If variation in either regulatory or downstream sequence is the proximate target of selection, then timing the signature of selection could serve as a direct test of these hypotheses. In the AA model, one would predict there would be evidence for concerted evolutionary sequence change (and/or key functional base pair changes) within regulatory regions for genes that only influence the interaction of spine and blade. In contrast, the AC model would predict sequence evolution in regulatory regions for genes influencing blade and spine, and such changes should be step-wise chronologically. In either case, changes should date to particularly informative periods as supported by the fossil record. Identification of the cis-regulatory architecture that underlies the specific traits in question will be highly informative for understanding their variation potential, testing competing evolutionary scenarios, and ultimately providing the opportunity to perform “experimental” paleontology, by altering sequence data in model species (43).
Materials and Methods
Data.
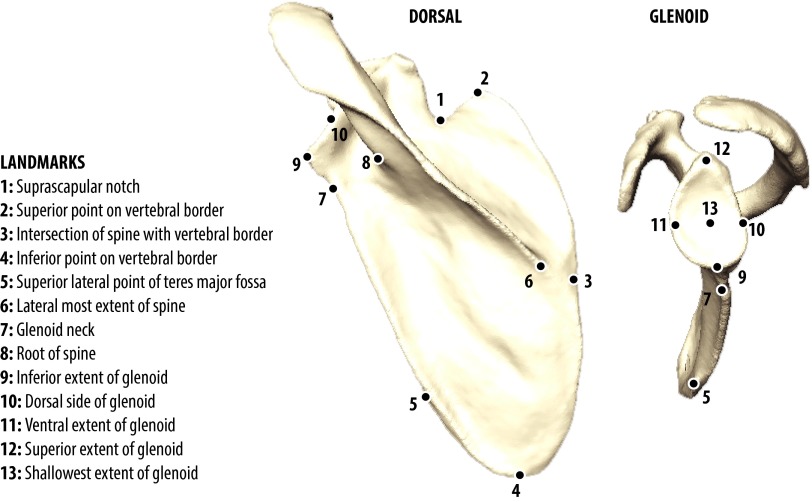
We collected 3D landmark data from scapulae of museum specimens from the following extant hominoid species: Homo sapiens (modern humans, n = 31), Pan troglodytes (chimpanzee, n = 56), Pan paniscus (bonobo, n = 36), Gorilla gorilla (lowland gorilla, n = 72), Pongo pygmaeus (Bornean orangutan, n = 48), Symphalangus syndactylus (siamang, n = 41), and Hylobates sp. (gibbon, n = 35). Use of anonymized human data was approved by the University of California, San Francisco Committee on Human Research (no. 10-01599). As proxies of the primitive Miocene ape ancestral morphotype (MAA), we use the cercopithecoid colobine Nasalis larvatus (proboscis monkey, n = 19) and the ceboid ateline Lagothrix lagotricha (wooly monkey, n = 11), consistent with reconstructions of both Early and Middle Miocene apes (e.g., Proconsul, Nacholapithecus) and hypothesized functional and morphological similarity (18, 44, 45). We used adult wild-caught males and females, one scapula per individual, principally the right. Specimens were chosen from similar geographic localities and/or within subspecies to minimize the effect of population heterogeneity. Missing, broken, damaged, or pathological individuals were excluded. Three-dimensional landmark coordinate data (x,y,z) were recorded using a Microscribe-3Dx digitizer (Immersion Corporation) as previously described (32, 46). We obtained 3D computed-tomography (CT) data from the original specimens of DIK 1-1 (A. afarensis, right side) (13), MH2 (A. sediba, right side) (16), Kebara 2 (H. neanderthalensis, right side), and Qafzeh 9 (anatomically modern H. sapiens, right side) and generated a 3D object in Amira 5.4 (Visage Imaging, Inc.). For KNM WT15000 (H. ergaster, right side) and La Ferassie I (H. neanderthalensis, right side), we used high quality casts. All 3D objects were landmarked in Landmark Editor 3.5 (University of California, Davis). We applied a series of landmarks to each specimen (n = 13) (29, 45), excluding those not found in all fossils (Fig. S6).
Fig. S6.
Scapula landmarks. Descriptions and locations of the 3D landmarks used in this study are shown on a representative P. troglodytes scapula (Left) shown in dorsal and medial view.
Shape Analysis.
We performed a Procrustes superimposition to remove the effects of scale, rotation, and alignment, and to reflect right and left scapulae. We removed the effect of size heterogeneity by performing a multivariate regression of shape on log centroid size (LCS) within species. We used the residuals of the group-centered means in all subsequent analyses. We first performed a principal components analysis (PCA) to assess shape variation, and two further analyses to take into account group information and assess the effect of sample size differences among species: (i) a canonical variates analysis (CVA) using species as the grouping variables and the overall pooled covariance matrix as the measure of within-group variability, and (ii) a between-group PCA (bgPCA) using PC axes estimated from averages of each species (47). We performed a within-configuration partial least squares (PLS) analysis within each species and centering on the group mean to compare covariation between variation in the spine and blade landmarks, with significance tested by permutation (1,000 replicates). We calculated Procrustes distances among species and tested for significance using a permutation test for pairwise distances (10,000 iterations). From these distances, we performed a cluster analysis, using the unweighted pair group with arithmetical mean (UPGMA) method, and generated a phenetic tree using the neighbor-joining (NJ) method (Nasalis/Lagothrix = root) in the software NTSYS-pc (v.2.1) (48). Eigenanalysis and visualizations were performed in MorphoJ v1.06d (49), Landmark Editor (v.3.0) (50), and the geomorph package (51) implemented in R (v.3.2.1) (52).
Developmental Simulation.
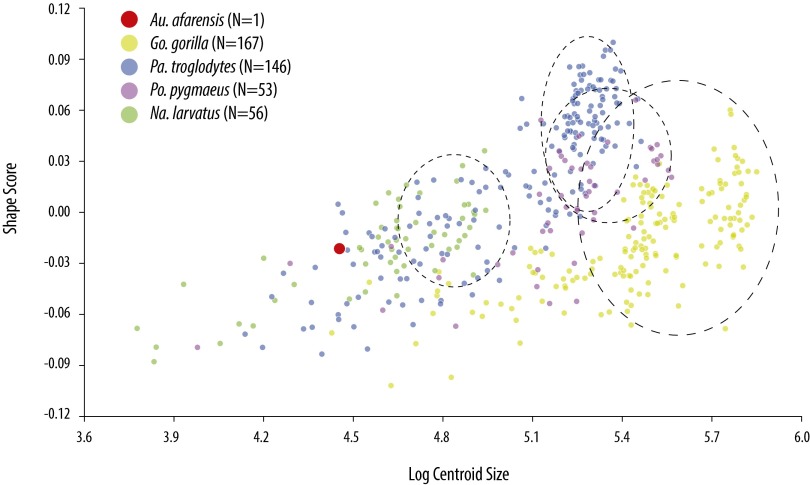
To compare DIK 1-1 to the adult morphospace, we performed a developmental simulation using allometric estimates under different assumptions of growth (Pan, Gorilla, Pongo, and Nasalis) (32). To do this analysis, we performed a Procrustes superimposition including the four extant species and DIK 1-1 so that all individuals and ontogenetic vectors were in the identical shape space. We next performed a multivariate regression of shape on log centroid size for each species age series alone and calculated the associated species-specific ontogenetic vector (Fig. S7). We next estimated adult shape by adding the product of each ontogenetic vector times LCS (= 0.75, the difference in LCS between juvenile and adult) to the DIK 1-1 Procrustes coordinates (53). Simulations were visualized by transforming the DIK1-1 specimen to the target adult landmark configuration in Landmark Editor (v.3.5) (Fig. 2C).
Fig. S7.
Growth vectors used for developmental simulation. Multivariate regression of group shape on log centroid size for the taxa shown. Individual growth vectors were generated by performing the same multivariate regression analysis using the Procrustes coordinates from the group superimposition but performed on each species alone. The Procrustes coordinates of A. afarensis (DIK 1-1) were simulated at an adult size corresponding to an increase of log centroid size of 0.75, consistent with achieving an adult outcome (dashed ellipses) in each of the taxa used.
Phylogenetic Morphospace.
We implemented squared-change parsimony (54) to (i) map alternative phylogenetic trees (Fig. 1 B and C) onto the continuous shape space defined by PCA, bgPCA, and CVA, (ii) reconstruct alternative ancestral morphotypes (i.e., nodes), and (iii) infer evolutionary trajectories (30, 55, 56). Squared-change parsimony is a generalization of maximum likelihood-based methods where all branch lengths are “1.” We justify this simplification by the fact that, with the exception of H. neanderthalensis, branch lengths are unknown for hominin fossil taxa. All trees reflect the currently accepted branching pattern as inferred from genomic datasets and calibrated from the fossil record (2) (Fig. 1 D and E and Table S2), but the AC trees differ in that a shared ancestral morphotype is represented by a simultaneous origin modeled as a hard polytomy (branch length of “0”) (Fig. 1E). In both cases, the MAA state corresponds to Nasalis and Lagothrix, which are also used to root the tree. Trees were generated in Mesquite v.3.01 (57). For each tree, we calculated the total branch length and tested the hypothesis of no phylogenetic signal using a permutation design (10,000 replicates) as implemented in MorphoJ v.1.06c (49).
Table S2.
Average PC1 scores, geologic ages, and estimated divergence times
| Species/node | PC1 | Age, Mya | |||
| Mean | SD | Estimate | Low | High | |
| H. sapiens | 0.195 | 0.027 | 0.000 | — | — |
| AMHs | 0.189 | — | 0.106 | 0.097 | 0.116 |
| H. neander. | 0.251 | 0.019 | 0.063 | 0.058 | 0.068 |
| H. ergaster | 0.228 | — | 1.550 | 1.500 | 1.600 |
| A. sediba | 0.117 | — | 1.977 | 1.974 | 1.980 |
| A. afarensis | 0.063 | 0.013 | 3.330 | 3.310 | 3.350 |
| Panins | −0.067 | 0.030 | 6.600 | 6.000 | 7.000 |
| African apes | −0.036 | 0.044 | 8.600 | 7.700 | 9.200 |
| P. pygmaeus | 0.091 | 0.037 | 18.300 | 16.300 | 20.800 |
| MAA | 0.086 | 0.031 | 30.500 | 26.900 | 36.400 |
Dashes indicate the diagonal, for which there is no value. AMHs, anatomically modern H. sapiens.
Supplementary Material
Acknowledgments
The Peabody Museum, Museum of Comparative Zoology, American Museum of Natural History, National Museum of Natural History, Field Museum of Natural History, Cleveland Museum of Natural History, University of Zürich-Irchel, Zooligische Staatssammlung, Musée Royale de l’Afrique Centrale, Powell-Cotton Museum, Kyoto University Primate Research Institute, and Japan Monkey Center provided access to specimens. T. Nalley assisted with segmentation of DIK1-1. K. Carlson provided computed tomography (CT) data for MH2. S. Mellilo kindly provided a subset of the adult human landmark data. B. Feeley provided additional human imaging data (CHR no. 10-01599). J. Camacho assisted in the CT scanning of La Ferassie I. I. Hershkovitz provided CT data for Kebara 2 and Qafzeh 9. Funding was provided through grants from the National Science Foundation (Grant BCS-1518596 to T.D.C., N.M.Y., and N.T.R.) and the generosity of Margaret and William Hearst (Z.A.). N.M.Y. acknowledges funding from National Institutes of Health Grants R01DE019638 and R01DE021708 and the ongoing support of the University of California, San Francisco Orthopaedic Trauma Institute, T. Miclau, R. Marcucio, and the Laboratory for Skeletal Regeneration.
Footnotes
The authors declare no conflict of interest.
This article is a PNAS Direct Submission.
This article contains supporting information online at www.pnas.org/lookup/suppl/doi:10.1073/pnas.1511220112/-/DCSupplemental.
References
- 1.Ruvolo M. Molecular phylogeny of the hominoids: Inferences from multiple independent DNA sequence data sets. Mol Biol Evol. 1997;14(3):248–265. doi: 10.1093/oxfordjournals.molbev.a025761. [DOI] [PubMed] [Google Scholar]
- 2.Steiper ME, Young NM. Primate molecular divergence dates. Mol Phylogenet Evol. 2006;41(2):384–394. doi: 10.1016/j.ympev.2006.05.021. [DOI] [PubMed] [Google Scholar]
- 3.Oxnard CE. The functional morphology of the primate shoulder as revealed by comparative anatomical, osteometric and discriminant function techniques. Am J Phys Anth. 1967;26(2):219–240. [Google Scholar]
- 4.Oxnard CE. Morphometric affinities of the human shoulder. Am J Phys Anthropol. 1977;46(2):367–374. doi: 10.1002/ajpa.1330460215. [DOI] [PubMed] [Google Scholar]
- 5.Bello-Hellegouarch G, et al. A comparison of qualitative and quantitative methodological approaches to characterizing the dorsal side of the scapula in Hominoidea and its relationship to locomotion. Int J Primatol. 2013;34:315–336. [Google Scholar]
- 6.Alemseged Z, et al. A juvenile early hominin skeleton from Dikika, Ethiopia. Nature. 2006;443(7109):296–301. doi: 10.1038/nature05047. [DOI] [PubMed] [Google Scholar]
- 7.Haile-Selassie Y, et al. An early Australopithecus afarensis postcranium from Woranso-Mille, Ethiopia. Proc Natl Acad Sci USA. 2010;107(27):12121–12126. doi: 10.1073/pnas.1004527107. [DOI] [PMC free article] [PubMed] [Google Scholar]
- 8.Green DJ, Alemseged Z. Australopithecus afarensis scapular ontogeny, function, and the role of climbing in human evolution. Science. 2012;338(6106):514–517. doi: 10.1126/science.1227123. [DOI] [PubMed] [Google Scholar]
- 9.Churchill SE, et al. The upper limb of Australopithecus sediba. Science. 2013;340(6129):1233477. doi: 10.1126/science.1233477. [DOI] [PubMed] [Google Scholar]
- 10.Pilbeam D. Genetic and morphological records of the Hominoidea and hominid origins: A synthesis. Mol Phylogenet Evol. 1996;5(1):155–168. doi: 10.1006/mpev.1996.0010. [DOI] [PubMed] [Google Scholar]
- 11.Harrison T. Apes among the tangled branches of human origins. Science. 2010;327(5965):532–534. doi: 10.1126/science.1184703. [DOI] [PubMed] [Google Scholar]
- 12.Zihlman AL, Cronin JE, Cramer DL, Sarich VM. Pygmy chimpanzee as a possible prototype for the common ancestor of humans, chimpanzees and gorillas. Nature. 1978;275(5682):744–746. doi: 10.1038/275744a0. [DOI] [PubMed] [Google Scholar]
- 13.Groves CP. The evolutionary ecology of the Hominoidea. Anu Psicol. 1988;39:87–98. [Google Scholar]
- 14.Gebo DL. Climbing, brachiation, and terrestrial quadrupedalism: Historical precursors of hominid bipedalism. Am J Phys Anthropol. 1996;101(1):55–92. doi: 10.1002/(SICI)1096-8644(199609)101:1<55::AID-AJPA5>3.0.CO;2-C. [DOI] [PubMed] [Google Scholar]
- 15.Wrangham R, Pilbeam D. African Apes as Time Machines. In: Galdikas BMF, Briggs NE, Sheeran LK, Shapiro GL, Goodall J, editors. All Apes Great and Small. Vol 1. Springer; Berlin: 2001. pp. 5–17. [Google Scholar]
- 16.Pilbeam D, Rose MD, Barry JC, Shah SM. New Sivapithecus humeri from Pakistan and the relationship of Sivapithecus and Pongo. Nature. 1990;348(6298):237–239. doi: 10.1038/348237a0. [DOI] [PubMed] [Google Scholar]
- 17.Moyà-Solà S, Köhler M, Alba DM, Casanovas-Vilar I, Galindo J. Pierolapithecus catalaunicus, a new Middle Miocene great ape from Spain. Science. 2004;306(5700):1339–1344. doi: 10.1126/science.1103094. [DOI] [PubMed] [Google Scholar]
- 18.Nakatsukasa M, Kunimatsu Y. Nacholapithecus and its importance for understanding hominoid evolution. Evol Anth. 2009;18:103–119. [Google Scholar]
- 19.Alba DM, Almécija S, Casanovas-Vilar I, Méndez JM, Moyà-Solà S. A partial skeleton of the fossil great ape Hispanopithecus laietanus from Can Feu and the mosaic evolution of crown-hominoid positional behaviors. PLoS One. 2012;7(6):e39617. doi: 10.1371/journal.pone.0039617. [DOI] [PMC free article] [PubMed] [Google Scholar]
- 20.Larson SG. Parallel evolution in the hominoid trunk and forelimb. Evol Anth. 1998;6:87–99. [Google Scholar]
- 21.Dainton M, Macho GA. Did knuckle walking evolve twice? J Hum Evol. 1999;36(2):171–194. doi: 10.1006/jhev.1998.0265. [DOI] [PubMed] [Google Scholar]
- 22.Kivell TL, Schmitt D. Independent evolution of knuckle-walking in African apes shows that humans did not evolve from a knuckle-walking ancestor. Proc Natl Acad Sci USA. 2009;106(34):14241–14246. doi: 10.1073/pnas.0901280106. [DOI] [PMC free article] [PubMed] [Google Scholar]
- 23.Thorpe SKS, Holder RL, Crompton RH. Origin of human bipedalism as an adaptation for locomotion on flexible branches. Science. 2007;316(5829):1328–1331. doi: 10.1126/science.1140799. [DOI] [PubMed] [Google Scholar]
- 24.Thorpe SKS, McClymont JM, Crompton RH. The arboreal origins of human bipedalism. Antiquity. 2014;88:906–926. [Google Scholar]
- 25.Lovejoy CO, Suwa G, Simpson SW, Matternes JH, White TD. The great divides: Ardipithecus ramidus reveals the postcrania of our last common ancestors with African apes. Science. 2009;326(5949):100–106. [PubMed] [Google Scholar]
- 26.White TD, Lovejoy CO, Asfaw B, Carlson JP, Suwa G. Neither chimpanzee nor human, Ardipithecus reveals the surprising ancestry of both. Proc Natl Acad Sci USA. 2015;112(16):4877–4884. doi: 10.1073/pnas.1403659111. [DOI] [PMC free article] [PubMed] [Google Scholar]
- 27.Sidlauskas B. Continuous and arrested morphological diversification in sister clades of characiform fishes: A phylomorphospace approach. Evolution. 2008;62(12):3135–3156. doi: 10.1111/j.1558-5646.2008.00519.x. [DOI] [PubMed] [Google Scholar]
- 28.Young NM. A reassessment of living hominoid postcranial variability: Implications for ape evolution. J Hum Evol. 2003;45(6):441–464. doi: 10.1016/j.jhevol.2003.09.001. [DOI] [PubMed] [Google Scholar]
- 29.Young NM. A comparison of the ontogeny of shape variation in the anthropoid scapula: Functional and phylogenetic signal. Am J Phys Anthropol. 2008;136(3):247–264. doi: 10.1002/ajpa.20799. [DOI] [PubMed] [Google Scholar]
- 30.Larson SG. Rotator cuff muscle size and the interpretation of scapular shape in primates. J Hum Evol. 2015;80:96–106. doi: 10.1016/j.jhevol.2015.01.001. [DOI] [PubMed] [Google Scholar]
- 31.Hartwig-Scherer S. 1993. Allometry in hominoids: A comparative study of skeletal growth trends. PhD dissertation (University of Zurich, Zurich)
- 32.Pilbeam D, Young N. Hominoid evolution: Synthesizing disparate data. C R Palevol. 2004;3:305–321. [Google Scholar]
- 33.Grabowski M, Hatala KG, Jungers WL, Richmond BG. Body mass estimates of hominin fossils and the evolution of human body size. J Hum Evol. 2015;85:75–93. doi: 10.1016/j.jhevol.2015.05.005. [DOI] [PubMed] [Google Scholar]
- 34.Roach NT, Venkadesan M, Rainbow MJ, Lieberman DE. Elastic energy storage in the shoulder and the evolution of high-speed throwing in Homo. Nature. 2013;498(7455):483–486. doi: 10.1038/nature12267. [DOI] [PMC free article] [PubMed] [Google Scholar]
- 35.Skinner MM, et al. Human-like hand use in Australopithecus africanus. Science. 2015;347(6220):395–399. doi: 10.1126/science.1261735. [DOI] [PubMed] [Google Scholar]
- 36.McPherron SP, et al. Evidence for stone-tool-assisted consumption of animal tissues before 3.39 million years ago at Dikika, Ethiopia. Nature. 2010;466(7308):857–860. doi: 10.1038/nature09248. [DOI] [PubMed] [Google Scholar]
- 37.Harmand S, et al. 3.3-million-year-old stone tools from Lomekwi 3, West Turkana, Kenya. Nature. 2015;521(7552):310–315. doi: 10.1038/nature14464. [DOI] [PubMed] [Google Scholar]
- 38.Larson SG. Evolutionary transformation of the hominin shoulder. Evol Anth. 2007;16:172–187. [Google Scholar]
- 39.Larson SG. Evolution of the hominin shoulder: Early Homo. In: Grine FE, Leakey RE, editors. The First Humans: Origins of the Genus Homo. Springer; New York: 2009. [Google Scholar]
- 40.Hunt KD. Positional behavior in the Hominoidea. Int J Primatol. 1991;12:95–118. [Google Scholar]
- 41.Apreleva M, Parsons IM, 4th, Warner JJ, Fu FH, Woo SL. Experimental investigation of reaction forces at the glenohumeral joint during active abduction. J Shoulder Elbow Surg. 2000;9(5):409–417. doi: 10.1067/mse.2000.106321. [DOI] [PubMed] [Google Scholar]
- 42.Parsons IM, Apreleva M, Fu FH, Woo SL. The effect of rotator cuff tears on reaction forces at the glenohumeral joint. J Orthop Res. 2002;20(3):439–446. doi: 10.1016/S0736-0266(01)00137-1. [DOI] [PubMed] [Google Scholar]
- 43.Pieretti J, et al. Organogenesis in deep time: A problem in genomics, development, and paleontology. Proc Natl Acad Sci USA. 2015;112(16):4871–4876. doi: 10.1073/pnas.1403665112. [DOI] [PMC free article] [PubMed] [Google Scholar]
- 44.Rose MD. Miocene hominoid postcranial morphology: Monkey-like, ape like, neither, or both? In: Ciochon RS, Corruccini RS, editors. New Interpretations of Ape and Human Ancestry. Plenum; New York: 1983. pp. 405–417. [Google Scholar]
- 45.Rose MD. Locomotor anatomy of Miocene hominoids. In: Gebo DL, editor. Postcranial Adaptation in Nonhuman Primates. Northern Illinois Univ Press; DeKalb, IL: 1993. pp. 252–272. [Google Scholar]
- 46.Young NM. Function, ontogeny and canalization of shape variance in the primate scapula. J Anat. 2006;209(5):623–636. doi: 10.1111/j.1469-7580.2006.00639.x. [DOI] [PMC free article] [PubMed] [Google Scholar]
- 47.Mitteroecker P, Bookstein F. Linear discrimination, ordination, and the visualization of selection gradients in modern morphometrics. Evol Biol. 2011;38:100–114. [Google Scholar]
- 48.Rohlf FJ. NTSYS-PC, Numerical Taxonomy System for the PC Exeter Software. Version 2.1 Applied Biostatistics Inc.; Setauket, NY: 2000. [Google Scholar]
- 49.Klingenberg CP. MorphoJ: An integrated software package for geometric morphometrics. Mol Ecol Resour. 2011;11(2):353–357. doi: 10.1111/j.1755-0998.2010.02924.x. [DOI] [PubMed] [Google Scholar]
- 50.Wiley DF, et al. 2005. Evolutionary morphing. Visualization 2005 (IEEE, Washington, DC), pp 431-438. [Google Scholar]
- 51.Adams DC, Otárola-Castillo E. geomorph: An R package for the collection and analysis of geometric morphometric shape data. Methods Ecol Evol. 2013;4:393–399. [Google Scholar]
- 52.R Core Team 2015 R: A Language and Environment for Statistical Computing (R Foundation for Statistical Computing, Vienna). Available at www.R-project.org/
- 53.Zelditch ML, Swiderski DL, Sheets HD. 2012. Geometric Morphometrics for Biologists: A Primer (Academic, London), 2nd Ed.
- 54.Maddison WP. Squared-change parsimony reconstructions of ancestral states for continuous-valued characters on a phylogenetic tree. Syst Zool. 1991;40:304–314. [Google Scholar]
- 55.Adams DC, Collyer ML. A general framework for the analysis of phenotypic trajectories in evolutionary studies. Evolution. 2009;63(5):1143–1154. doi: 10.1111/j.1558-5646.2009.00649.x. [DOI] [PubMed] [Google Scholar]
- 56.Klingenberg CP, Gidaszewski NA. Testing and quantifying phylogenetic signals and homoplasy in morphometric data. Syst Biol. 2010;59(3):245–261. doi: 10.1093/sysbio/syp106. [DOI] [PubMed] [Google Scholar]
- 57.Maddison WP, Maddison DR. 2015 Mesquite: A Modular System for Evolutionary Analysis. Version 3.03. Available at mesquiteproject.org. Accessed June 1, 2015.
- 58.Dembo M, Matzke NJ, Mooers AØ, Collard M. Bayesian analysis of a morphological supermatrix sheds light on controversial fossil hominin relationships. Proc Biol Sci. 2015;282(1812):20150943. doi: 10.1098/rspb.2015.0943. [DOI] [PMC free article] [PubMed] [Google Scholar]
- 59.Thorpe SKS, Crompton RH. Locomotor ecology of wild orangutans (Pongo pygmaeus abelii) in the Gunung Leuser Ecosystem, Sumatra, Indonesia: A multivariate analysis using log-linear modelling. Am J Phys Anthropol. 2005;127(1):58–78. doi: 10.1002/ajpa.20151. [DOI] [PubMed] [Google Scholar]
- 60.Thorpe SKS, Crompton RH. Orangutan positional behavior and the nature of arboreal locomotion in Hominoidea. Am J Phys Anthropol. 2006;131(3):384–401. doi: 10.1002/ajpa.20422. [DOI] [PubMed] [Google Scholar]
- 61.Cant JGH, Youlatos D, Rose MD. Suspensory locomotion of Lagothrix lagothricha and Ateles belzebuth in Yasuní National Park, Ecuador. J Hum Evol. 2003;44(6):685–699. doi: 10.1016/s0047-2484(03)00060-5. [DOI] [PubMed] [Google Scholar]
Associated Data
This section collects any data citations, data availability statements, or supplementary materials included in this article.


