Significance
After a heart attack, millions to billions of cardiomyocytes are lost. Because the adult mammalian heart possesses little regenerative potential, a precipitous loss of cardiac function ensues. Patients with heart failure could benefit from repopulating injured areas of the heart with functional cardiomyocytes. To date, cellular transplantation has been therapeutically unsuccessful. Direct lineage reprogramming offers a new approach to repopulate cardiomyocytes in the heart. We report here that addition of Akt1 to our established (GHMT) reprogramming cocktail dramatically enhances the generation of cardiomyocytes from fibroblasts. Our findings provide insights into the molecular basis of cardiac reprogramming.
Keywords: transdifferentiation, regeneration, cardiomyopathy, heart, cardiogenesis
Abstract
Conversion of fibroblasts to functional cardiomyocytes represents a potential approach for restoring cardiac function after myocardial injury, but the technique thus far has been slow and inefficient. To improve the efficiency of reprogramming fibroblasts to cardiac-like myocytes (iCMs) by cardiac transcription factors [Gata4, Hand2, Mef2c, and Tbx5 (GHMT)], we screened 192 protein kinases and discovered that Akt/protein kinase B dramatically accelerates and amplifies this process in three different types of fibroblasts (mouse embryo, adult cardiac, and tail tip). Approximately 50% of reprogrammed mouse embryo fibroblasts displayed spontaneous beating after 3 wk of induction by Akt plus GHMT. Furthermore, addition of Akt1 to GHMT evoked a more mature cardiac phenotype for iCMs, as seen by enhanced polynucleation, cellular hypertrophy, gene expression, and metabolic reprogramming. Insulin-like growth factor 1 (IGF1) and phosphoinositol 3-kinase (PI3K) acted upstream of Akt whereas the mitochondrial target of rapamycin complex 1 (mTORC1) and forkhead box o3 (Foxo3a) acted downstream of Akt to influence fibroblast-to-cardiomyocyte reprogramming. These findings provide insights into the molecular basis of cardiac reprogramming and represent an important step toward further application of this technique.
Adult mammalian cardiomyocytes possess limited capacity to proliferate, posing a major barrier to cardiac regeneration after injury (1). Thus, methods to generate induced cardiac-like myocytes (iCMs) by reprogramming fibroblasts with combinations of cardiac transcription factors represent a potential approach for enhancing cardiac repair (2–8). Various mixtures of proteins, microRNAs, and small molecules have been shown to activate cardiac gene expression in fibroblasts (9), confirming original observations made merely 5 y ago (2). However, the direct lineage conversion technique has been hampered by low efficiency, slow rate of cellular conversion, and production of intermediately reprogrammed or relatively immature iCMs (reviewed in ref. 9).
We reasoned that altering intracellular signaling pathways via kinase activation might enhance production of iCMs. We therefore screened a library of protein kinases for the potential to enhance reprogramming of fibroblasts to cardiomyocytes by four cardiac transcription factors [Gata4, Hand2, Mef2c, and Tbx5 (GHMT)]. Our unbiased kinase screen revealed that Akt1, also known as protein kinase B (Pkb), dramatically enhances and expedites the formation of iCMs from numerous types of fibroblasts in the presence of GHMT. The iCMs formed by Akt plus GHMT also displayed a mature phenotype, compared with those generated without Akt, and were responsive to β-adrenoreceptor pharmacologic modulation, polynucleated, and hypertrophic. Akt seems to act in a pathway with insulin-like growth factor 1 (IGF1), phosphoinositol 3-kinase (PI3K), the mitochondrial target of rapamycin complex 1 (mTORC1) and forkhead box o3 (Foxo3a) to boost the cardiac reprogramming process.
Results
Akt Enhances GHMT-Mediated Cardiac Reprogramming.
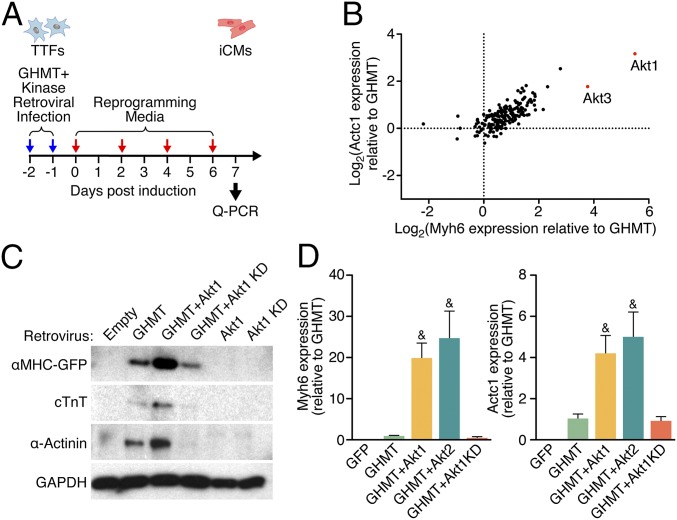
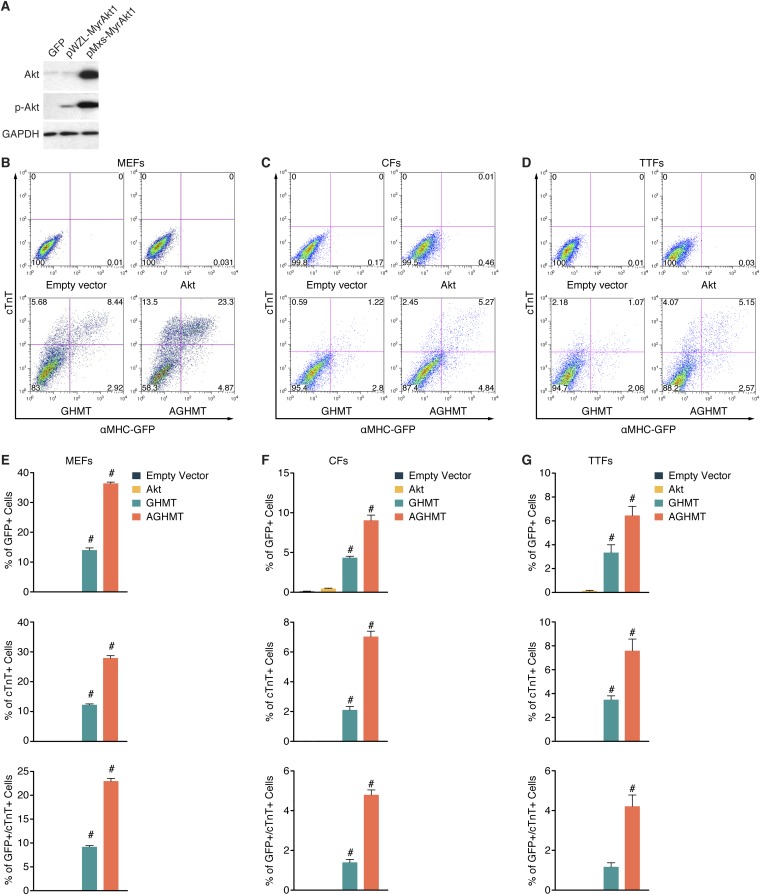
Previously, we established a cardiac reprogramming assay by expressing the cardiac transcription factors, GHMT, in mouse tail tip fibroblasts (TTFs) and cardiac fibroblasts (CFs) (7). With the goal of improving the efficiency and rate of reprogramming, we screened a myristoylated kinase expression library for individual kinases that might augment the generation of functional iCMs by GHMT. After 7 d of TTF induction with retrovirally expressed GHMT plus either GFP or each of the 192 kinases in the library, we harvested RNA and quantified expression of the cardiac markers Myh6 and Actc1 (Fig. 1A). Our results showed that overexpression of Akt1 or Akt3 specifically augmented expression of these cardiac markers (Fig. 1B). Akt2 was not present in this library. We confirmed these findings using a different Akt1 expression cassette (pMxs-MyrAkt1) that directed robust expression of active phospho-Akt1 (Fig. S1A) and used this vector for all subsequent experiments. Western blot analysis of mouse embryonic fibroblasts (MEFs) isolated from transgenic mice harboring a GFP transgene controlled by the cardiac-specific αMHC promoter confirmed that addition of Akt1 to GHMT enhanced expression of endogenous cardiac markers, as well as the αMHC-GFP reporter (Fig. 1C). Notably, neither Akt1 alone nor a kinase-dead (KD) form of Akt1 was able to induce expression of cardiac markers. Akt1 and Akt2 stimulated cardiac transcript expression comparably in the transdifferentiation assay whereas the KD mutant form of Akt1 abrogated the stimulatory activity on GHMT (Fig. 1D). We thus focused on Akt1 for subsequent experiments.
Fig. 1.
A kinase screen identifies Akt as an enhancer of cardiac reprogramming by GHMT. (A) Protocol for reprogramming and the kinase library screen. (B) Transcript levels measured by qPCR 7 d after TTF induction with GHMT plus either GFP or one of the retrovirally expressed kinases. This log–log plot is normalized to expression with GHMT+GFP and shows that Akt1 and Akt3 caused the greatest increases in cardiac marker expression. (C) Detection of cardiac markers by Western blot of protein lysates from αMHC-GFP transgenic MEFs a week after induction with the indicated retroviruses. KD, kinase dead. (D) Transcript levels of Myh6 and Actc1 were increased a week after induction by adding Akt1 or Akt2 to GHMT in TTFs. &P < 0.05 vs. all others unless also labeled with “&.”
Fig. S1.
Akt enhances cardiac reprogramming by GHMT. (A) Western blot of Akt and phospho-Akt in TTFs 7 d after infection with the indicated retroviral Akt expression cassettes. (B–D) Representative flow cytometry plot and (E–G) analyses of αMHC-GFP+ and cTnT+ cells in MEFs, CFs, or TTFs, after infection with control, Akt, GHMT, or AGHMT retrovirus at indicated times (5 d for MEFs, 1 wk for CFs and TTFs). #P < 0.05 vs. all others.
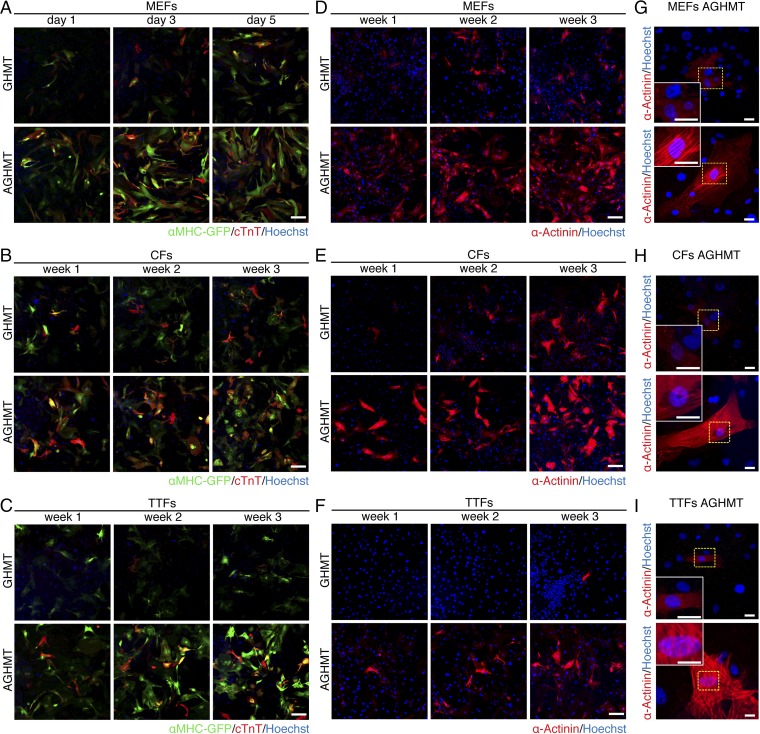
To further monitor the effect of Akt1 on GHMT-mediated cardiac reprogramming of fibroblasts, we isolated mouse embryonic fibroblasts (MEFs), TTFs, and CFs from αMHC-GFP transgenic mice. We observed that the addition of Akt to GHMT (AGHMT) dramatically enhanced the number of iCMs, detected by staining for GFP and cardiac troponin T (cTnT) (cTnT in red and GFP in green in Fig. 2 A–C) or α-actinin (Fig. 2 D–F). A subset of these iCMs showed characteristic striations indicative of sarcomere formation a week after induction (see Fig. 2G for MEFs and Fig. 2H for CFs,) or after 2 wk in the case of TTFs (Fig. 2I) whereas no sarcomere formation was seen with iCMs formed by GHMT alone at these time points. Using flow cytometry after expression of AGHMT in MEFs isolated from αMHC-GFP mice, we detected a dramatic increase in the percentage of cells positive for endogenous and exogenous cardiac markers compared with GHMT treatment (Fig. S1 B and E). The percentage of positive cells is noteworthy when considering that the statistical likelihood of an individual fibroblast taking up the four to five separate retroviruses encoding the transdifferentiation factors would be less than 100%. Similar experiments in CFs (Fig. S1 C and F) and TTFs (Fig. S1 D and G) yielded compatible results after 7 d of transdifferentiation although the absolute percentage of positive cells was not as pronounced as in MEFs. We further observed an increase in the percentage of α-actinin–positive cells by flow cytometry when adding Akt1 to GHMT in these different types of fibroblasts.
Fig. 2.
Akt enhances cardiac reprogramming by GHMT. (A–C) Immunocytochemistry of αMHC-GFP transgenic MEFs, CFs, and TTFs, respectively, at the indicated times showed more cells positive for GFP (green) and cTnT (red) with AGHMT compared with GHMT. (Scale bars: 200 µm.) (D–F) α-Actinin immunocytochemistry (red) of MEFs, CFs, and TTFs, respectively, at the indicated times showed enhanced reprogramming upon addition of Akt1 to GHMT. (Scale bars: 200 µm.) (G–I) α-Actinin staining of MEFs, CFs, and TTFs showed striations suggestive of sarcomere formation by 7 d of induction in AGHMT but not GHMT (two weeks for TTFs). (Scale bars: 25 µm.)
Akt1 Enhances Calcium Flux and Spontaneous Cell Beating in Response to GHMT.
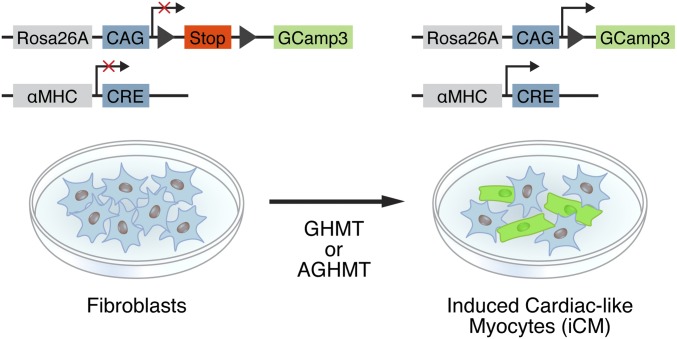
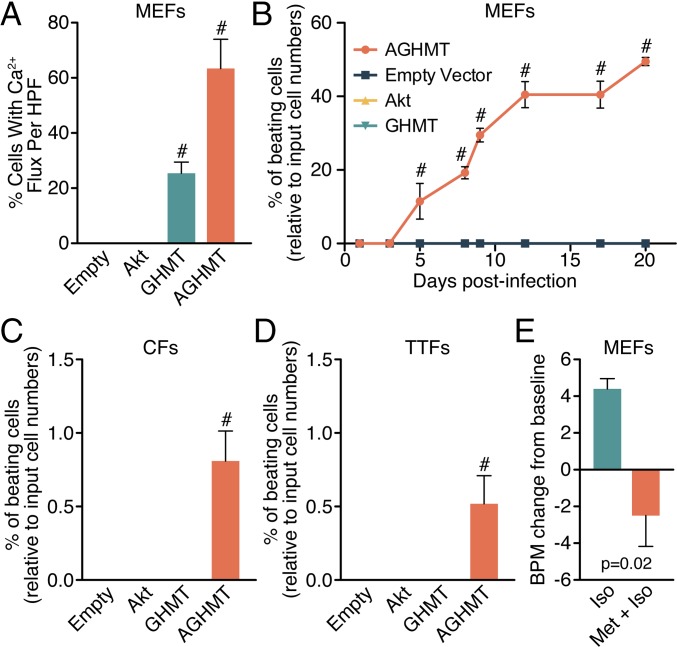
To examine the potential influence of Akt on calcium flux and spontaneous cell beating in response to GHMT, we used a conditionally active modified GFP reporter system (αMHC-Cre/Rosa26A-Flox-Stop-Flox-GCamp3 MEFs) for live cell imaging of spontaneous cellular calcium flux as detected by autofluorescence (Fig. S2). AGHMT-treated MEFs had greater calcium flux after a week of transdifferentiation than GHMT-treated MEFs, and a majority of the AGHMT-treated cells exhibited calcium flux with many cells seemingly firing in unison (Fig. 3A and Movie S1).
Fig. S2.
Strategy for measuring calcium flux. MEFs derived from αMHC-Cre/Rosa26A-Flox-Stop-Flox-GCaMP3 transgenic mice were reprogrammed to iCMs by addition of GHMT or AGHMT and exhibit spontaneous cyclic autofluorescence concomitant with calcium flux.
Fig. 3.
Akt1 promotes spontaneous calcium flux and cellular beating in iCMs. (A) Spontaneous calcium flux assessed in MEFs a week after induction with AGHMT compared with GHMT. (B–D) AGHMT enhances spontaneous cellular beating compared with GHMT treatment in MEFs, CFs (at 2 wk), and TTFs (at 3 wk), respectively, with about half of MEFs displaying spontaneous beating by 3 wk of AGHMT treatment. (E) Change from baseline spontaneous cellular beating rate (21 BPM) in MEFs 3 wk after induction and after β-adrenoreceptor modulation with the agonist isoproterenol (Iso) and the antagonist metoprolol (Met). #P < 0.05 vs. all others. BPM, beats per minute; HPF, high-power field.
Spontaneous beating represents a phenotype of mature cardiomyocytes, requiring functional sarcomeres and calcium cycling machinery, rather than spontaneous intracellular calcium flux alone. We observed a similar increase in spontaneous beating of MEFs (Fig. 3B and Movie S2) (there were very rare spontaneously beating cells only at 20 d in the GHMT treatment group), CFs [Fig. 3C (2 wk after induction) and Movie S3], and TTFs [Fig. 3D (3 wk after induction) and Movie S3] upon addition of Akt1 to GHMT. We observed no beating cells in CFs or TTFs after 2 or 3 wk of GHMT induction, respectively, and we observed no beating cells with empty vector or Akt1 alone in any fibroblast cell type.
To further characterize the properties of AGHMT-mediated iCMs, we tested the effects of adrenergic agonists and antagonists on AGHMT-induced MEFs 21 d after induction (Fig. 3E and Movie S4). AGHMT-mediated iCMs were responsive to pharmacologic modulation of β-adrenoreceptor activity. Although more difficult to quantify, it also seemed that altering β-adrenoreceptor activity had an effect on iCM inotropy (Movie S4).
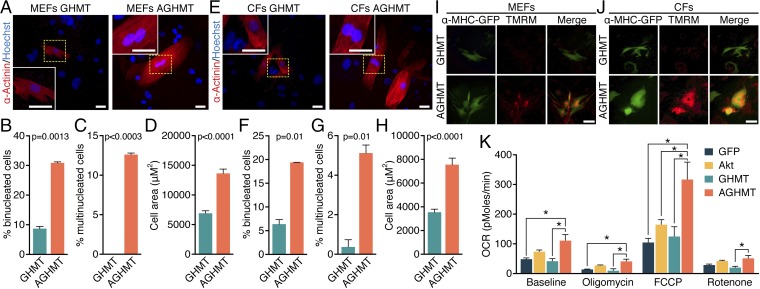
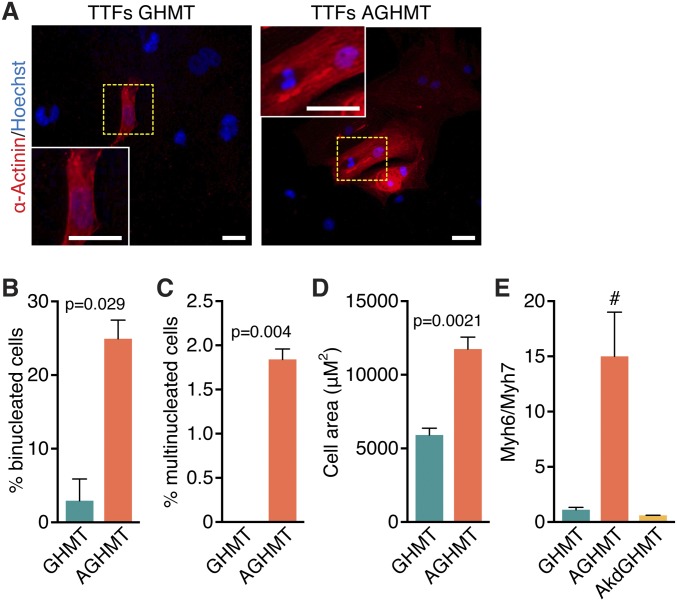
We noted that numerous AGHMT-treated iCMs became binucleate (Fig. 4 A and B and E and F and Fig. S3 A and B) or multinucleate (three or more nuclei) (Fig. 4 C and G and Fig. S3C) within 3 wk whereas such cells were observed only rarely after induction with GHMT. We therefore examined whether AGHMT-induced iCMs displayed other features of mature cardiomyocytes, including an altered metabolic profile, increased ratio of Myh6:Myh7 expression, increased cell size, and mitochondrial membrane depolarization activity. AGHMT treatment of fibroblasts resulted in an approximate doubling of iCM size after 3 wk of induction relative to GHMT treatment (Fig. 4 D and H and Fig. S3D). Akt1 added to GHMT treatment also increased the ratio of Myh6:Myh7 RNA expression as assessed by qPCR (Fig. S3E).
Fig. 4.
Addition of Akt1 to GHMT stimulates maturation of iCMs. (A and E) α-Actinin immunostaining shows mononucleate or binucleate iCM 3 wk after induction with GHMT or AGHMT in MEFs (A) and CFs (E). (Scale bars: 25 µm.) (B and C and F and G) Quantification of the percentage of iCMs with more than a single nucleus (binucleate, two nuclei; multinucleate, three or more nuclei) 3 wk after AGHMT treatment reveals an increase relative to cells treated with GHMT in MEFs (B and C) and CFs (F and G). (D and H) Size of iCMs was approximately doubled by addition of Akt1 to GHMT, as shown here in MEFs (D) and CFs (H) 3 wk after induction after immunocytochemistry for α-actinin. (I and J) Immunocytochemistry of MEFs (I) and CFs (J) 2 wk after induction shows that mitochondrial activity was increased in iCMs; tetramethylrhodamine methyl ester (TMRM) in red and αMHC-GFP transgene expression in green. (Scale bars: 100 µm.) (K) Oxygen consumption rates in MEFs a week after induction showed increased baseline levels for AGHMT-treated cells compared with non–Akt1-treated cells, and AGHMT-treated cells also had increased maximal oxygen consumption compared with other treatment groups (n = 4, except Akt, where n = 3, analyzed as a separate one-way ANOVA for each drug treatment). *P < 0.05.
Fig. S3.
Addition of Akt1 to GHMT stimulates maturation of iCMs in TTFs. (A) α-Actinin immunostaining shows binucleate iCM 3 wk after induction with GHMT and AGHMT. (Scale bars: 25 μm.) (B and C) Quantification of the percentage of iCMs with more than a single nucleus (binucleate, two nuclei; multinucleate, three or more nuclei) 3 wk after AGHMT treatment reveals an increase relative to cells treated with GHMT. (D) Size of iCMs was approximately doubled by addition of Akt1 to GHMT, as shown here 3 wk after induction after immunocytochemistry for α-actinin. (E) The ratio of Myh6:Myh7 by qPCR in TTFs 1 wk after induction suggests that adding Akt1 to GHMT results in more mature iCMs whereas a kinase dead mutant of Akt1 abrogates this effect. #P < 0.05 vs. all others.
Metabolic analysis showed that AGHMT-treated MEFs had higher baseline oxygen utilization per cell a week after induction than non–Akt1-treated cells and greater possible maximal oxygen consumption than other tested cells (Fig. 4K). This experiment measured oxygen consumption rate normalized to input cell number at baseline and in the presence of several compounds that counteract various stages of oxidative phosphorylation: oligomycin inhibits ATP synthase by blocking its F0 subunit (proton channel) and thus severely limits oxygen utilization, FCCP uncouples the hydrogen ion gradient needed for ATP synthesis and thus maximizes oxygen utilization, and rotenone prevents electron transfer from complex I to ubiquinone within the electron transport chain and also minimizes oxygen utilization. The lack of difference between oligomycin and rotenone treatments suggests that the metabolic effects of Akt1 are not specific to a component of the electron transport chain but rather represent a more general metabolic phenotype. Moreover, addition of Akt1 to GHMT increased mitochondrial membrane depolarization in MEFs and CFs as determined by use of a membrane-permeable dye that is taken up by active mitochondria (Fig. 4 I and J). All of these measurements, in addition to the above qualitative change in cellular inotropy with isoproterenol, corresponded to a more mature iCM phenotype after AGHMT treatment.
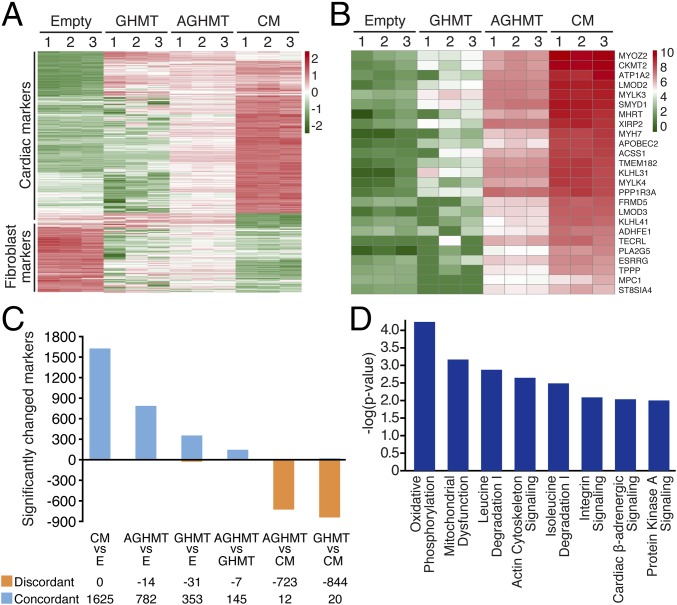
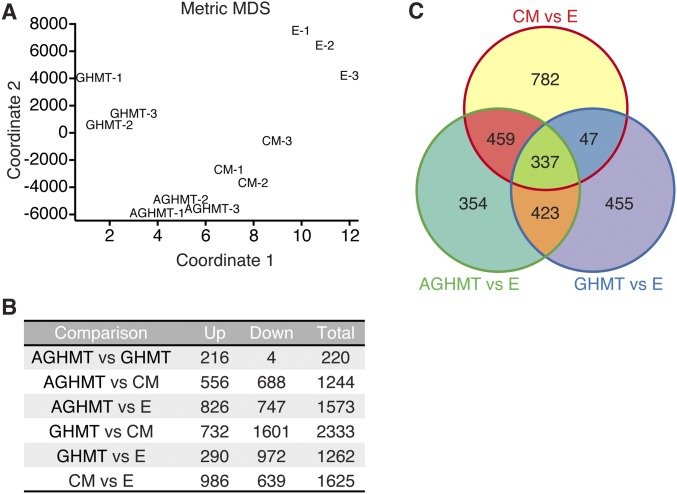
We performed RNA-Seq using either isolated adult mouse ventricular cardiomyocytes (CMs) or MEFs treated for 3 wk with empty vector, GHMT (iCMs cell-sorted using αMHC-GFP before RNA-Seq), or AGHMT (iCMs cell-sorted using αMHC-GFP before RNA-Seq (Table S1). These data showed that global RNA expression profiles of iCMs formed with AGHMT were more similar to mature CMs than those formed with GHMT (Fig. 5A and Fig. S4A). Some specific cardiac markers of interest that displayed increased expression in AGHMT relative to GHMT iCMs are shown in Fig. 5B. It seemed that the effects of Akt1 were mediated predominantly by increases in cardiac marker expression (Fig. S4 B and C). Using a twofold cutoff and P < 0.01 threshold for inclusion, ∼1,600 markers differed between CMs and MEFs treated with empty vector. Restricting analysis to these ∼1,600 markers and only counting those that changed expression in the same direction as CMs, ∼800 changed for AGHMT (vs. empty vector) whereas only ∼350 changed for GHMT (vs. empty vector) (Fig. 5C). These results suggest that AGHMT iCMs are more similar to mature CMs than GHMT iCMs. Pathway analyses showed changes in marker expression patterns between GHMT and AGHMT iCMs indicative of a shift toward a more cardiomyocyte-like phenotype with AGHMT: changes in mitochondrial function, cellular metabolism, sarcomere/cytoskeleton organization, and β-adrenoreceptor function, to name a few (Fig. 5D).
Table S1.
Summary of RNA-Seq sequencing output, quality control filtering, and mapping results
| Sample | Total reads | Filtered | % | Mapped | Mapping ratio, % | Unique reads | Unique ratio, % |
| GHMT-1 | 7,276,236 | 7,056,944 | 97.0 | 5,813,947 | 82.4 | 2,462,467 | 42.4 |
| GHMT-2 | 6,377,141 | 5,815,703 | 91.2 | 3,835,725 | 66.0 | 2,745,984 | 71.6 |
| GHMT-3 | 5,392,897 | 4,945,779 | 91.7 | 3,473,624 | 70.2 | 2,258,765 | 65.0 |
| AGHMT-1 | 31,744,595 | 31,526,448 | 99.3 | 26,701,703 | 84.7 | 16,869,653 | 63.2 |
| AGHMT-2 | 33,918,839 | 33,689,150 | 99.3 | 28,545,217 | 84.7 | 19,429,545 | 68.1 |
| AGHMT-3 | 41,491,341 | 41,213,099 | 99.3 | 34,529,127 | 83.8 | 22,427,626 | 65.0 |
| CM-1 | 40,783,401 | 40,584,054 | 99.5 | 34,931,197 | 86.1 | 17,989,722 | 51.5 |
| CM-2 | 35,168,486 | 34,997,535 | 99.5 | 29,953,628 | 85.6 | 15,163,436 | 50.6 |
| CM-3 | 10,713,123 | 10,650,974 | 99.4 | 9,109,740 | 85.5 | 5,716,551 | 62.7 |
| E-1 | 57,253,655 | 56,875,215 | 99.3 | 48,706,296 | 85.6 | 40,326,320 | 82.8 |
| E-2 | 29,011,588 | 28,455,694 | 98.1 | 23,808,068 | 83.7 | 19,260,544 | 80.9 |
| E-3 | 32,718,600 | 32,524,244 | 99.4 | 27,952,054 | 85.9 | 22,782,625 | 81.5 |
Fig. 5.
Comprehensive expression analysis by RNA-Seq shows that AGHMT iCMs are more similar to adult mouse ventricular cardiomyocytes than GHMT iCMs. (A and B) Heatmaps of RNA expression data illustrating differentially expressed markers in empty vector, GHMT, AGHMT, and CMs. Red indicates up-regulated markers, and green indicates down-regulated markers. (C) Restricting analysis to the 1,625 markers that differed between CMs and MEFs and only counting those that changed expression in the same direction as CMs, 782 changed for AGHMT whereas only 353 changed for GHMT. These findings suggest that AGHMT iCMs are more similar to mature CMs than GHMT iCMs. Notably, AGHMT and GHMT iCMs had only 14 and 31 markers, respectively, that changed to look more like MEFs. (D) Analysis showed expression changes in key pathways between GHMT and AGHMT iCMs, indicating a more cardiomyocyte-like phenotype with AGHMT.
Fig. S4.
RNA-Seq global analysis shows that AGHMT iCMs are more similar to mature CM than GHMT iCMs. (A) Multidimensional scaling (MDS) plot showing RNA-Seq sample relatedness based on 2D coordinates. Distance measurements were calculated using normalized RNA expression values from all expressed markers in each sample. (B) Count table for differentially expressed markers for various sample group comparisons using fold change cutoff of ≥2 and P value of ≤0.01. (C) Venn diagram showing number of overlapping markers between GHMT, AGHMT, and CM compared with empty vector control. Marker counts include both up-regulated and down-regulated genes.
Analysis of the Mechanism of Akt1-Dependent Reprogramming.
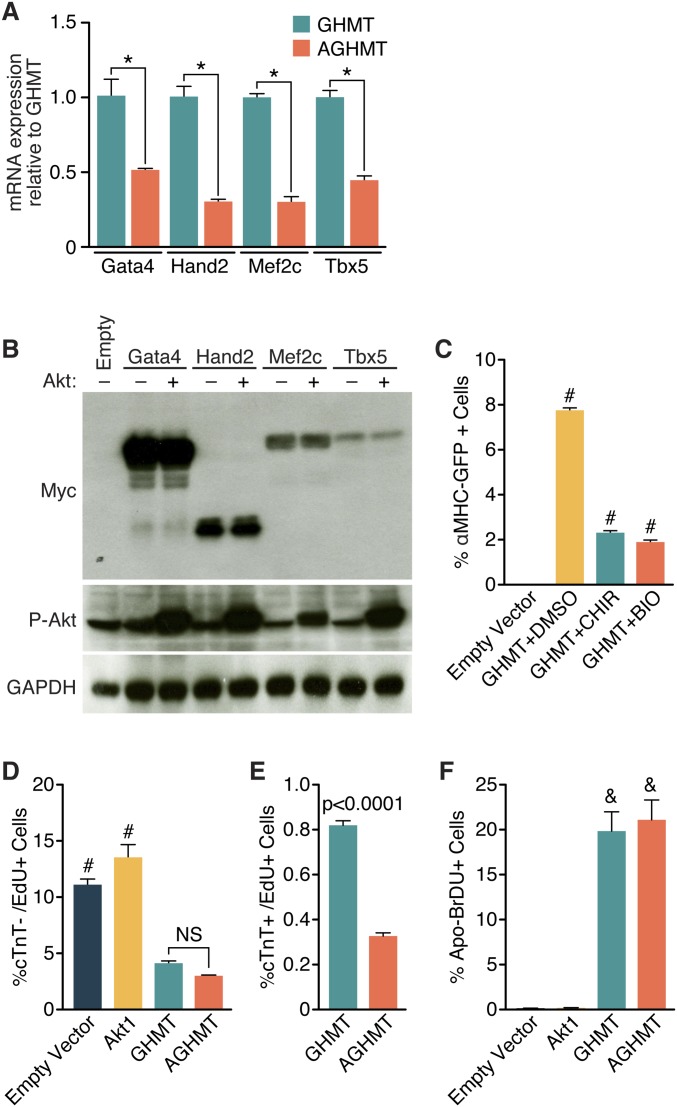
To begin to define the molecular mechanism whereby Akt signaling enhanced reprogramming by GHMT, we examined whether Akt1 might function by enhancing GHMT expression. Measurement of GHMT expression by RT-PCR (Fig. S5A) or Western blot analysis (Fig. S5B) showed that Akt did not increase expression of these reprogramming factors.
Fig. S5.
Processes not involved in the mechanism by which Akt1 enhances GHMT-mediated formation of iCMs. (A) Measurement of Gata4, Hand2, Mef2c, or Tbx5 transcript by qPCR after 7 d of induction in GHMT- or AGHMT-treated MEFs. (B) Western blot of myc-tagged GHMT proteins in the presence or absence of Akt1 in MEFs after 2 d of induction. (C) Flow cytometry analysis after 7 d of GHMT treatment in MEFs (derived from aMHC-GFP mice) in the presence or absence of CHIR99021 (CHIR) or BIO. (D and E) Flow cytometry analysis of MEFs treated with Edu for 1 h following 7 d induction with control, Akt, GHMT, or AGHMT. Cardiac troponin T (cTnT) labels iCMs and Edu labels proliferating cells. (F) Flow cytometry analysis was used to measure apoptosis of MEFs following 7 d induction with control, Akt, GHMT, or AGHMT. Addition of Akt had no significant effect on apoptosis as measured by this assay. *P < 0.05; #P < 0.05 vs. all others; &P < 0.05 vs. all others unless also labeled with “&”.
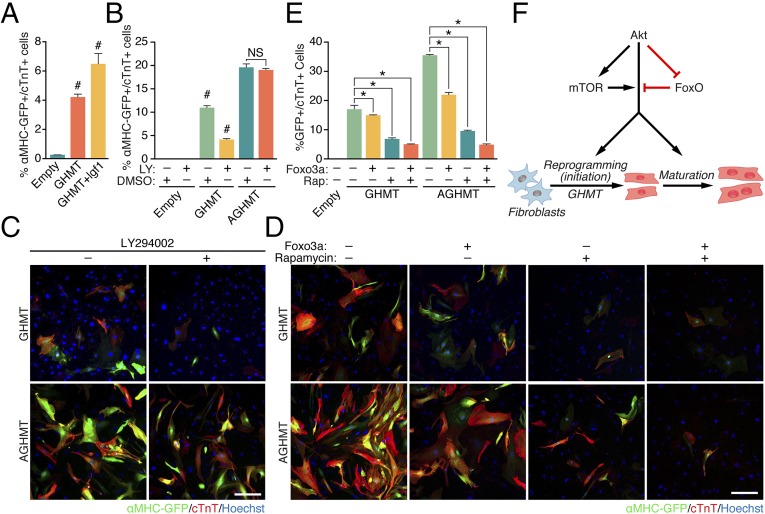
We next tested the impact of multiple components of intracellular signaling pathways involving Akt on the reprogramming process. MEFs treated with IGF1 an upstream activator of Akt signaling, had higher rates of conversion to iCMs than GHMT-treated cells, as assessed by flow cytometry (Fig. 6A). Conversely, pharmacological inhibition with LY294002 of PI3K, which signals from the IGF1 receptor to Akt, reduced the formation of iCMs. This effect was attenuated by constitutively active Akt1 (Fig. 6 B and C).
Fig. 6.
Akt1 enhancement of GHMT-mediated reprogramming relies on signaling through IGF1, PI3K, mTORC1, and Foxo3a. (A) IGF1 (300 ng/mL) enhanced the proportion of MEFs expressing cardiac markers detected by flow cytometry a week after induction. (B and C) A similar experiment using pharmacologic inhibition of PI3K activity ± genetic rescue by Akt1 suggested that PI3K activity may stimulate GHMT-mediated transdifferentiation into iCMs. LY, LY294002 (PI3K antagonist). (Scale bar: 200 µm.) (D and E) After 7 d induction of MEFs, we also found that pharmacologic inhibition of mTORC1 and/or genetic addition of Foxo3a incrementally attenuated formation of iCMs (rapamycin, mTORC1 antagonist). (Scale bar: 200 µm.) Upon treatment with both rapamycin and Foxo3a, residual formation of iCMs was equal when comparing GHMT and AGHMT treatments. (F) Proposed mechanism of action by which Akt1 enhances GHMT-mediated formation of induced cardiac-like myocytes. *P < 0.05; #P < 0.05 vs. all others.
We also analyzed the potential influence of downstream mediators of Akt1 signaling on cardiac reprogramming. Pharmacologic inhibition of mTORC1 and/or genetic addition of Foxo3a in GHMT-treated MEFs impaired cardiac reprogramming by AGHMT (Fig. 6 D and E). These results suggest that mTORC1 and Foxo3a act as downstream mediators of Akt1 in transdifferentiation. Pharmacologic inhibition of glycogen synthase kinase 3 (Gsk3), an antagonist of Akt signaling, did not alter cardiac gene expression in a way supporting its function downstream of Akt1 in cardiac reprogramming (Fig. S5C).
Because Akt could potentially enhance transdifferentiation by increasing proliferation of iCMs, we performed dual EdU/cTnT staining and analyzed MEFs using flow cytometry after a week of induction (Fig. S5 D and E). The results showed reduced proliferation of both MEFs and iCMs treated with GHMT or AGHMT. The reduction in proliferation when comparing GHMT- or AGHMT-treated MEFs with iCMs indicated that iCMs likely quickly exit the cell cycle during the reprogramming process. It is possible that AGHMT-treated cells do so more quickly, as shown by the significantly lower percentage of EdU+ AGHMT-treated iCMs after a week of induction. To test whether Akt alters apoptosis levels after transdifferentiation, we performed BrdU staining of MEFs a week after induction but observed no difference in apoptosis between cells treated with GHMT and AGHMT (Fig. S5F).
We interpret the above results to indicate a mechanism of action for Akt1 whereby IGF1 signals (likely through the IGF receptor) via PI3K to Akt, and then activates downstream signals of Akt that are involved in iCM formation including mTORC1 and Foxo3a (Fig. 6F). Other pathways identified by RNA-Seq analysis (Fig. 5) may play additional roles in this process.
Discussion
We show that addition of Akt1 significantly boosts iCM formation in vitro compared with GHMT treatment alone. These effects were validated by a variety of biochemical, structural, and functional assays, suggesting a robust effect overall. We noted large increases in number of cells with calcium flux and beating upon treatment with AGHMT, and the resultant cells were both hypertrophic and responsive to β-adrenoreceptor pharmacologic manipulation. AGHMT-treated cells also displayed changes in metabolism, mitochondria, morphology, multi/binucleation, and gene expression corresponding to a more mature cardiomyocyte phenotype than GHMT-treated cells (maturation criteria were reviewed recently for engineered iCMs in ref. 10). We additionally found that some fibroblast genes have enhanced expression in AGHMT-reprogrammed cells. The functional significance of this finding remains unclear. Akt seems to signal through a pathway involving IGF1, PI3K, mTORC1, and Foxo3a to enhance reprogramming (Fig. 6F). These results represent a significant advance over existing techniques in producing iCMs via direct lineage conversion, which until now have been largely limited by the inefficiency of the reprogramming process. This finding is the first time, to our knowledge, that polynucleate iCMs have been described by direct lineage conversion, and addition of Akt1 to GHMT treatment significantly increases production of these cells. It will be of eventual interest to determine whether activation of the Akt signaling pathway enhances cardiac reprogramming of fibroblasts within the context of a myocardial infarct. In this regard, prior studies (6, 11) reported that the 43-amino acid peptide thymosin β4, which activates Akt, enhances cardiac function postmyocardial infarction in the presence of a GMT (Gata4, Mef2c, and Tbx5) cardiac reprogramming mixture (6).
In comparison with adult fibroblasts, embryonic fibroblasts are easier to reprogram to other cell types. Interestingly, we show that adult CFs are more amenable to reprogramming into cardiomyocytes than adult TTFs. This difference could be due to the fact that CFs already express GHMT factors (12), although not at levels sufficient to turn CFs into cardiomyocytes.
We enhanced GHMT-mediated iCM formation by addition of IGF1, which is an activator of the Akt signaling pathway via PI3K. However, reprogramming with GHMT+IGF1 was less efficient than with AGHMT (Fig. 6A). We attribute this difference to the fact that IGF1 is not the only factor controlling the Akt signaling pathway. Furthermore, overexpression of constitutively activated Akt in the reprogramming assay provides a more potent effect than activating endogenous Akt by IGF1. Downstream of Akt1 there are many potential effectors. Although at least some signaling occurs through mTORC1 and Foxo3a, there does not seem to be significant signaling through Gsk3. That the mechanism of Akt1 involves mTOR and FoxO is intriguing given their roles in regulating mitochondrial metabolism, muscle development, and gene expression. Moreover, our RNA-Seq analysis confirmed expression changes for markers involved with mitochondrial metabolism, sarcomeres/cytoskeletal components, and β-adrenergic signaling. The realization that Akt signaling enhances the reprogramming process raises possibilities for further augmenting this process through pharmacologic manipulation of aspects of this pathway.
Cardiomyocyte bi- and multinucleation, as observed in response to reprogramming with AGHMT, results from progression through S-phase of the cell cycle without subsequent cytokinesis. It is interesting that Akt has been implicated in both cardiac hyperplasia and hypertrophy depending on the specific context (13–15). It is conceivable that Akt simultaneously stimulates hypertrophy, DNA replication, and cellular senescence similarly to development of mature/polynucleate mammalian cardiomyocytes.
The ability to use iCMs for therapeutic purposes in humans with various cardiomyopathies remains a long-term goal of cardiac reprogramming research, but technical boundaries must be crossed before this therapeutic approach is feasible. The concern that iCMs are formed with low efficiency using direct lineage conversion can be reduced by the gains imparted by addition of Akt to the reprogramming mixture. There remains a concern that gene delivery by integrating retroviruses may not be compatible with future clinical use of this technology although this concern is not insurmountable.
Materials and Methods
Cell Culture.
TTFs, CFs, and MEFs were prepared as described (7, 16). Retroviral transduction and cellular reprogramming were performed as described (7). Small molecule treatments were used either throughout the reprogramming process [20 µM LY294002 (LY), Sigma; 5 nM rapamycin (Rap), Sigma; 10 µM CHIR99021 (CHIR), Selleck Chemicals; 5 µM BIO, Sigma; 300 ng/mL IGF1R3 (IGF1), Sigma] or at the indicated times [10 µM isoproterenol (Iso), Sigma; 10 µM metoprolol tartrate (Met), Sigma; 20 nM tetramethylrhodamine methyl ester (TMRM), Invitrogen].
Generation of Retroviruses.
Retroviruses were produced and used analogously to prior description (7, 16). The Myristoylated Kinase Library listed in Table S2 was obtained from Addgene [(Kit #1000000012) deposited by William Hahn and Jean Zhao (17)].
Table S2.
List of myristoylated kinases tested in an addition analysis to enhance GHMT-mediated cardiac reprogramming
| AAK1 | CKMT1A | HK1 | MVK | PIP5K1B | RPS6KL1 |
| ACVR1 | CKMT2 | HK2 | NADK | PIP5K2A | RPSK6A3 |
| ADCK4 | CKS1B | HK3 | NEK11 | PIP5K3 | SGK |
| ADCK5 | CKS2 | IHPK2 | NEK3 | PKM2 | SNF1LK |
| ADPGK | CLK1 | IKBKE | NEK6 | PKN1 | SPHK2 |
| ADRBK1 | CLK2 | ILK | NME7 | PKN2 | SRPK2 |
| ADRBK2 | CLK3 | ITK | NTRK3 | PLAU | STK17B |
| AKT1 | CMPK | ITPK1 | NUAK2 | PLK1 | STK3 |
| AKT3 | CSNK1A1L | ITPKB | OXSR1 | PLK2 | STK32A |
| AMHR2 | CSNK1E | LCK | PACSIN1 | PLK3 | STK32B |
| AURKA | CSNK1G1 | LIMK1 | PAK4 | PLK4 | STK32C |
| AXL | CSNK1G2 | LIMK2 | PAPSS1 | PMVK | STK33 |
| BLK | DAK | MAP2K5 | PBK | PNKP | STK38L |
| BMX | DGKG | MAP2K6 | PCK2 | PRKAA1 | STK4 |
| BTK | DGUOK | MAP2K7 | PCTK1 | PRKACB | STK40 |
| CALM2 | DLG5 | MAP3K14 | PCTK2 | PRKACG | SYK |
| CAMK1G | DYRK2 | MAP3K6 | PCTK3 | PRKAG2 | TAOK3 |
| CAMK2B | DYRK4 | MAP3K7 | PDIK1L | PRKAR2A | TBK1 |
| CAMK2D | EPHA4 | MAP3K8 | PDK1 | PRKCD | TEC |
| CAMK4 | FASTK | MAPK12 | PDPK1 | PRKCI | TESK1 |
| CAMKK1 | FGFR1 | MAPK13 | PDXK | PRKCZ | TIE1 |
| CAMKV | FGR | MAPK14 | PFKL | PRKRA | TK1 |
| CDC2 | FRK | MAPK6 | PFKM | PTK2 | TNK2 |
| CDK2 | GAK | MAPK7 | PI4K2B | RET | TSSK1B |
| CDK4 | GALK2 | MAPKAP1 | PIK3CB | RIOK1 | TSSK6 |
| CDK5 | GCK | MAST1 | PIK3CG | RIOK2 | TTK |
| CDK7 | GK | MATK | PIK3R3 | RIOK3 | TYK2 |
| CDK9 | GK2 | MELK | PIK3R5 | RPS6KA2 | UCK2 |
| CERK | GRK5 | MKNK1 | PIK4CA | RPS6KA5 | ULK4 |
| CHEK1 | GRK6 | MOBKL1A | PIK4CB | RPS6KA6 | VRK2 |
| CKB | HCK | MOBKL2A | PIM1 | RPS6KB1 | VRK3 |
| CKM | HIPK1 | MPP1 | PIP5K1A | RPS6KB2 | YES1 |
qPCR, Western Blot Analyses, Immunocytochemistry, Flow Cytometry, Beating Cell Analyses, Calcium Transient Measurements, and Cell Size Measurements.
These experiments were performed as previously described (7), with the exceptions of beating cell analyses, calcium transient measurements, and cell size measurements. Beating cell analyses and calcium transient measurements were normalized to the initially plated number of fibroblasts. Beating cell analyses were performed by light microscopy at room temperature after retroviral treatment of TTFs, CFs, and MEFs at the indicated time points. Three to nine high-power fields of view were randomly selected for each well, video recorded for 3 min (maintaining the same shutter speed), manually quantified, and averaged to provide an individual replicate. Responses to isoproterenol ± metoprolol tartrate were assessed in similar fashion except that they were each acquired for 2 min starting 1 min after addition of the indicated compounds. Calcium transient measurements were performed by fluorescence microscopy at room temperature 1 wk after retroviral treatment of αMHC-Cre/Rosa26A-Flox-Stop-Flox-Gcamp3 MEFs. Three high-power fields of view were randomly selected for each well, video recorded for 3 min (maintaining the same shutter speed of 1.9 s), manually quantified, and averaged to yield an individual replicate. Cell size measurements used manually drawn contours of αMHC-GFP–positive iCMs where, as above, three randomly selected fields of view from each well were averaged to provide an individual replicate.
Proliferation and Apoptosis Assays.
Cells were harvested at the indicated time points and assayed according to manufacturer recommendations using the Click-iT EdU Alexa Fluor 647 Flow Cytometry Assay Kit or the APO-BrdU TUNEL Assay Kit (both from Life Technologies).
Cell Metabolism Experiments.
MEFs were analyzed a week after induction using manufacturer recommendations with XFe Cell Mito Stress Test kits (Seahorse Bioscience). Experiments were normalized to input cell number and used the following drug concentrations within the above test kits: 1 µM oligomycin, 1 µM carbonyl cyanide-4-(trifluoromethoxy) phenylhydrazone (FCCP), or 0.1 µM rotenone.
Differential Gene Expression Analysis.
We performed RNA-Seq using the Next Generation Sequencing Core at the University of Texas Southwestern Medical Center. Methods and analyses of RNA-seq are described in SI Materials and Methods. Our results are archived using the GEO accession number GSE68509.
Pathway Enrichment Analysis.
Significant pathway enrichment analysis was performed using Ingenuity Pathways Analysis (Ingenuity Systems) as described in SI Materials and Methods.
Statistical Analyses.
All in vitro data are presented as mean with SEM and have n = 3 per group (except Fig. 3E, with n = 6 per group, Fig. 4 A–H, with n = 2 per group). P values were calculated with either unpaired/two-way t test or one-way ANOVA, as appropriate, except in time-course analyses where we used two-way ANOVA. All statistical analyses were run using the GraphPad Prism 6 software package (GraphPad Software). P < 0.05 was considered significant in all cases after corrections were made for multiple pairwise comparisons.
SI Materials and Methods
Differential Gene Expression Analysis.
Three micrograms of DNase-treated RNA per replicate were prepared using the TruSeq Stranded LT Kit from Illumina. Samples were then PCR amplified and purified with Ampure XP beads before sequencing on a HiSeq 2500 instrument (Illumina). All procedures were carried out according to manufacturer protocols. Quality assessment of the RNA-Seq data was done using NGS-QC Toolkit. Reads with mean phred quality scores of less than 20 were removed from further analysis. Quality filtered reads were then aligned to the mouse reference genome GRCm38 (mm 10) using the Bowtie2 (v 2.0.6) aligner (18). Only uniquely mapped reads were kept for further downstream analysis. Differential gene expression analysis was done using the R package DESeq (v 1.10.1) (19) following the protocols outlined in ref. 20. Read counts were normalized by taking the median of each gene count across samples and dividing each sample gene count by the relative ratio of library sizes between the calculated median and sample size. The averaged normalized expression values of the triplicate samples were used to calculate fold change and P values. Cutoff values of fold change greater than two and P value less than 0.01 were then used to select for differentially expressed genes between sample group comparisons.
Pathway Enrichment Analysis.
Differentially expressed genes from the RNA expression data are associated with a biological function supported by at least one publication in the Ingenuity Pathways Knowledge Base. Fisher’s exact test was then used to calculate the P value and determine the probability that each biological function was enriched in the dataset due to chance alone. Statistically significant biological pathways were then identified by selection for pathways with P values less than 0.05. The DAVID gene functional annotation and classification tool (21) was used to annotate the list of differentially expressed genes with respective Gene Ontology (GO) terms and perform GO enrichment analysis for molecular and biological functional categories. Functional Gene Ontology groups were selected for significance by using a P value cutoff of 1%.
Supplementary Material
Acknowledgments
We thank the members of the E.N.O. laboratory (including Kedryn Baskin, Angie Bookout, Ning Liu, Catherine Makarewich, and Benjamin Nelson) for advice and intellectual input. We thank Jose Cabrera for graphics, and Young-Jae Nam and Nikhil Munshi for kindly sharing reagents. We thank the University of Texas Southwestern Mouse Metabolic Phenotyping Core for help with cell metabolism experiments. This work was supported by NIH Grants HL-077439, HL-111665, HL-093039, DK-099653, and U01-HL-100401; Foundation Leducq Networks of Excellence; the Cancer Prevention and Research Institute of Texas; Robert A. Welch Foundation Grant 1-0025 (to E.N.O.); and National Heart, Lung, and Blood Institute JumpStart Award U01HL099997 (to M.E.D.). H.Z. was supported by American Heart Association (14PRE20030030).
Footnotes
The authors declare no conflict of interest.
Data deposition: The data reported in this paper have been deposited in the Gene Expression Omnibus (GEO) database, www.ncbi.nlm.nih.gov/geo (accession no. GSE68509).
This article contains supporting information online at www.pnas.org/lookup/suppl/doi:10.1073/pnas.1516237112/-/DCSupplemental.
References
- 1.Xin M, Olson EN, Bassel-Duby R. Mending broken hearts: Cardiac development as a basis for adult heart regeneration and repair. Nat Rev Mol Cell Biol. 2013;14(8):529–541. doi: 10.1038/nrm3619. [DOI] [PMC free article] [PubMed] [Google Scholar]
- 2.Ieda M, et al. Direct reprogramming of fibroblasts into functional cardiomyocytes by defined factors. Cell. 2010;142(3):375–386. doi: 10.1016/j.cell.2010.07.002. [DOI] [PMC free article] [PubMed] [Google Scholar]
- 3.Inagawa K, et al. Induction of cardiomyocyte-like cells in infarct hearts by gene transfer of Gata4, Mef2c, and Tbx5. Circ Res. 2012;111(9):1147–1156. doi: 10.1161/CIRCRESAHA.112.271148. [DOI] [PubMed] [Google Scholar]
- 4.Jayawardena TM, et al. MicroRNA induced cardiac reprogramming in vivo: Evidence for mature cardiac myocytes and improved cardiac function. Circ Res. 2015;116(3):418–424. doi: 10.1161/CIRCRESAHA.116.304510. [DOI] [PMC free article] [PubMed] [Google Scholar]
- 5.Nam YJ, et al. Reprogramming of human fibroblasts toward a cardiac fate. Proc Natl Acad Sci USA. 2013;110(14):5588–5593. doi: 10.1073/pnas.1301019110. [DOI] [PMC free article] [PubMed] [Google Scholar]
- 6.Qian L, et al. In vivo reprogramming of murine cardiac fibroblasts into induced cardiomyocytes. Nature. 2012;485(7400):593–598. doi: 10.1038/nature11044. [DOI] [PMC free article] [PubMed] [Google Scholar]
- 7.Song K, et al. Heart repair by reprogramming non-myocytes with cardiac transcription factors. Nature. 2012;485(7400):599–604. doi: 10.1038/nature11139. [DOI] [PMC free article] [PubMed] [Google Scholar]
- 8.Später D, Hansson EM, Zangi L, Chien KR. How to make a cardiomyocyte. Development. 2014;141(23):4418–4431. doi: 10.1242/dev.091538. [DOI] [PubMed] [Google Scholar]
- 9.Sadahiro T, Yamanaka S, Ieda M. Direct cardiac reprogramming: Progress and challenges in basic biology and clinical applications. Circ Res. 2015;116(8):1378–1391. doi: 10.1161/CIRCRESAHA.116.305374. [DOI] [PubMed] [Google Scholar]
- 10.Yang X, Pabon L, Murry CE. Engineering adolescence: Maturation of human pluripotent stem cell-derived cardiomyocytes. Circ Res. 2014;114(3):511–523. doi: 10.1161/CIRCRESAHA.114.300558. [DOI] [PMC free article] [PubMed] [Google Scholar]
- 11.Bock-Marquette I, et al. Thymosin beta4 mediated PKC activation is essential to initiate the embryonic coronary developmental program and epicardial progenitor cell activation in adult mice in vivo. J Mol Cell Cardiol. 2009;46(5):728–738. doi: 10.1016/j.yjmcc.2009.01.017. [DOI] [PMC free article] [PubMed] [Google Scholar]
- 12.Furtado MB, et al. Cardiogenic genes expressed in cardiac fibroblasts contribute to heart development and repair. Circ Res. 2014;114(9):1422–1434. doi: 10.1161/CIRCRESAHA.114.302530. [DOI] [PMC free article] [PubMed] [Google Scholar]
- 13.Condorelli G, et al. Akt induces enhanced myocardial contractility and cell size in vivo in transgenic mice. Proc Natl Acad Sci USA. 2002;99(19):12333–12338. doi: 10.1073/pnas.172376399. [DOI] [PMC free article] [PubMed] [Google Scholar]
- 14.Gude N, et al. Akt promotes increased cardiomyocyte cycling and expansion of the cardiac progenitor cell population. Circ Res. 2006;99(4):381–388. doi: 10.1161/01.RES.0000236754.21499.1c. [DOI] [PubMed] [Google Scholar]
- 15.Shiojima I, Walsh K. Regulation of cardiac growth and coronary angiogenesis by the Akt/PKB signaling pathway. Genes Dev. 2006;20(24):3347–3365. doi: 10.1101/gad.1492806. [DOI] [PubMed] [Google Scholar]
- 16.Nam YJ, et al. Induction of diverse cardiac cell types by reprogramming fibroblasts with cardiac transcription factors. Development. 2014;141(22):4267–4278. doi: 10.1242/dev.114025. [DOI] [PMC free article] [PubMed] [Google Scholar]
- 17.Boehm JS, et al. Integrative genomic approaches identify IKBKE as a breast cancer oncogene. Cell. 2007;129(6):1065–1079. doi: 10.1016/j.cell.2007.03.052. [DOI] [PubMed] [Google Scholar]
- 18.Li H, Durbin R. Fast and accurate short read alignment with Burrows-Wheeler transform. Bioinformatics. 2009;25(14):1754–1760. doi: 10.1093/bioinformatics/btp324. [DOI] [PMC free article] [PubMed] [Google Scholar]
- 19.Anders S, Huber W. Differential expression analysis for sequence count data. Genome Biol. 2010;11(10):R106. doi: 10.1186/gb-2010-11-10-r106. [DOI] [PMC free article] [PubMed] [Google Scholar]
- 20.Anders S, et al. Count-based differential expression analysis of RNA sequencing data using R and Bioconductor. Nat Protoc. 2013;8(9):1765–1786. doi: 10.1038/nprot.2013.099. [DOI] [PubMed] [Google Scholar]
- 21.Huang DW, et al. DAVID Bioinformatics Resources: Expanded annotation database and novel algorithms to better extract biology from large gene lists. Nucleic Acids Res. 2007;35(Web Server issue) Suppl 2:W169–W175. doi: 10.1093/nar/gkm415. [DOI] [PMC free article] [PubMed] [Google Scholar]
Associated Data
This section collects any data citations, data availability statements, or supplementary materials included in this article.


