

Abstract
Mutations in PIK3CA, the gene encoding the p110α catalytic subunit of phosphoinositide 3-kinase (PI3K) have been shown to transform human mammary epithelial cells (MECs). These mutations are present in all breast cancer subtypes, including basal-like breast cancer (BLBC). Using liquid chromatography-tandem mass spectrometry (LC-MS/MS), we identified 72 protein expression changes in human basal-like MECs with knock-in E545K or H1047R PIK3CA mutations versus isogenic MECs with wild-type PIK3CA. Several of these were secreted proteins, cell surface receptors or ECM interacting molecules and were required for growth of PIK3CA mutant cells as well as adjacent cells with wild-type PIK3CA. The proteins identified by MS were enriched among human BLBC cell lines and pointed to a PI3K-dependent amphiregulin/EGFR/ERK signaling axis that is activated in BLBC. Proteins induced by PIK3CA mutations correlated with EGFR signaling and reduced relapse-free survival in BLBC. Treatment with EGFR inhibitors reduced growth of PIK3CA mutant BLBC cell lines and murine mammary tumors driven by a PIK3CA mutant transgene, all together suggesting that PIK3CA mutations promote tumor growth in part by inducing protein changes that activate EGFR.
PIK3CA1, the gene encoding the p110α catalytic subunit of phosphatidylinositide-3 kinase (PI3K), is one of the two most frequently mutated genes in breast cancer. Approximately 80% of these mutations occur in two hot spots in the helical domain (E545K, E542K) and in the catalytic domain (H1047R). PIK3CA activating mutations occur in ∼40% of luminal and HER2-enriched breast cancer subtypes and ∼10% of basal-like breast cancer (BLBC) (1). In this last tumor subtype, mutations in PIK3CA are the most frequent activating kinase mutation. Thus, understanding of how PIK3CA mutations operate in BLBC is important for identifying therapeutic targets in this subtype of the disease, which lacks approved targeted therapies.
To elucidate mechanisms by which mutant PIK3CA transforms MECs, we used immortalized, nontumorigenic MCF10A cells, which exhibit basal-like gene expression. Although MCF10A cells require growth factors for proliferation (2), heterozygous knock-in of E545K or H1047R PIK3CA mutation allows growth factor-independent proliferation (3). These knock-in PIK3CA mutant MECs provide a robust model in which to study the impact of these mutations without the effects of random insertion and overexpression associated with ectopic gene transduction. Liquid chromatography-tandem mass spectrometry (LC-MS/MS) analysis of these cells identified 72 proteins concordantly altered by both PIK3CA mutations. A significant fraction of these were secreted proteins, cell surface receptors or ECM interacting molecules, suggesting PIK3CA mutations induce changes involving communication with the tumor microenvironment. This analysis identified a PI3K-induced amphiregulin (AREG)-EGFR-ERK signaling pathway that was required for growth of PIK3CA-mutant cells as well as adjacent PIK3CA-WT cells. In addition, these protein changes correlated with poor clinical outcome in BLBC. EGFR antagonists inhibited growth of PIK3CA mutant BLBC tumors, suggesting a potential therapeutic strategy for patients with this molecular subtype of breast cancer.
EXPERIMENTAL PROCEDURES
Cell Culture, siRNA Transfection, and Virus Production
MCF10A, PIK3CA mutant MCF10A (E545K or H1047R), or MCF10AT1 cells were maintained in complete media (DMEM/F12 supplemented with 5% horse serum, 20 ng/ml EGF, 10 μg/ml insulin, 0.5 μg/ml hydrocortisone, 0.1 μg/ml cholera toxin). For experiments under starvation conditions, cells were: (1) seeded in complete media, washed twice with PBS, and then provided with starvation media (DMEM/F12 supplemented with 1% charcoal dextran-treated serum, 10 μg/ml insulin, 0.5 μg/ml hydrocortisone, 0.1 μg/ml cholera toxin) or (2) washed, trypsinized, treated with soybean trypsin inhibitor, and then plated directly in starvation media. Starvation method #2 was employed in proliferation assays assessed by SRB staining to avoid washing and overmanipulating 96-well plates, which disrupts the monolayer and can cause cell death. Parallel plates seeded for lysate collection were seeded in starvation media in the same manner. All breast cancer cells, except SUM102 cells, were maintained in DMEM supplemented with 10% FBS. For experiments in starvation conditions, cells were plated in DMEM supplemented with 1% charcoal dextran-treated serum. SUM102 cells were maintained in complete media (DMEM/F12 supplemented with 5% FBS, 10 μg/ml insulin, 0.5 μg/ml hydrocortisone); for experiments in starvation media, DMEM/F12 supplemented with 1% charcoal dextran-treated serum, 10 μg/ml insulin, 0.5 μg/ml hydrocortisone was used. When experiments exceeded 3 days, cultures were replenished with fresh media and inhibitors every 3 days. The intrinsic molecular subtype of breast cancer cells used herein and EGFR ligands expression in human breast cancer cell lines are from published microarray data (4). siRNA complexes were prepared at 250 nm in OptiMEM and then diluted tenfold into culture media for a final concentration of 25 nm. For example, 100 μl of 250 nm siRNA were prepared by mixing 1.25 μLof 20 μm siRNA and 1.5 μl Lipofectamine RNAiMAX in a final volume of 100 μl OptiMEM, allowing complexes to form for 15 min and then applying them to cells in 900 μl of starvation media for a final 25 nm siRNA. Amphotropic retroviruses were generated by cotransfecting 2.5 μg proviral plasmid and 2.5 μg pCL-Ampho into 293FT cells using the calcium phosphate method. Lentiviruses were generated by cotransfecting 3.6 μg proviral plasmid, 2.7 μg pΔ8.9 (plasmid encoding gag, pol, and rev genes), and 1.7 μg pVSVG envelope plasmid into 293FT cells using the calcium phosphate method. Packaging cells were fed 24 h post-transfection; virus-containing supernatants were harvested 48 and 72 h post-transfection, diluted 1:4 and applied to target cells with 8 μg/ml polybrene. Target cells were selected with 1 μg/ml puromycin or 500 μg/ml G418 or with flow sorting for mCherry or GFP expression at the Vanderbilt University Flow Cytometry Core Resource.
Reagents
Commercially purchased siRNA, shRNA and antibodies are listed in Table I. pRetroQ-mCherry was provided by Dr. Harold Moses (Vanderbilt University, Nashville, TN). pLNCX2-GFP-Luciferase was provided by Dr. Steven Anderson (University of Colorado, Denver). pLZRS-EphA2-IRES-GFP and pLZRS-GFP were provided by Dr. Jin Chen (Vanderbilt University). Wild type or phosphatase deficient (C1522S) PTPRF in pMT plasmid backbone was provided by Dr. Shuxin Li (Temple University, Philadelphia, PA). Wild type and phosphatase deficient PTPRF open reading frames were amplified by PCR using Elongase polymerase (Life Technologies, Carlsbad, CA) and the following two primers: cctcctagatctatggcccctgagccagccc and cctcctagatctttacgttgcatagtggtcaaagc (BglII restriction sites are underlined). PCR fragments (∼6 kb) were gel extracted and inserted into pCR-XL-TOPO following manufacturer's directions. Full length PTPRF ORFs (wild type and C1522S) were excised from pCR-XL-TOPO using BglII restriction endonuclease and ligated into pMSCV-puro digested with BglII. The wild-type pMSCV-PTPRF failed to express, so a 1.6-kb EcoRI-EcoRI wild- type fragment was inserted into pMSCV-PTPRF (C1522S) and digested with EcoRI to generate wild-type PTPRF in the phosphatase deficient backbone. Sequences were validated by the Sanger method and expression confirmed by immunoblot analysis. Cetuximab was purchased from the Vanderbilt University Medical Center pharmacy. Selumetinib (AZD6244), MK2206 and gefitinib were purchased from Selleck chemicals. BYL719 was provided by Novartis. Recombinant human amphiregulin was purchased from R&D Systems, Minneapolis, MN and resuspended in sterile PBS. Fibronectin coated cell culture plates were purchased from BD Biosciences, Franklin Lakes, NJ.
Table I. Reagents.
| siRNA | Vendor | Catalog # | Antibody | Vendor | Cat # | Dilution |
|---|---|---|---|---|---|---|
| AllStars neg ctrl siRNA | Qiagen | 1027281 | p110α | Cell Signaling | 4249 | 1:1,000 (immunoblot) |
| Universal neg ctrl siRNA | Sigma | SIC001 | P-S6 (S235/236) | Cell Signaling | 4858 | 1:1,000 (immunoblot) |
| EphA2 siRNA #6 | Qiagen | SI00300188 | S6 | Cell Signaling | 2317 | 1:1,000 (immunoblot) |
| EphA2 siRNA #12 | Qiagen | SI04434990 | P-Akt (S473) | Cell Signaling | 9271 | 1:1,000 (immunoblot) |
| TGM2 siRNA #1 | Qiagen | SI00743715 | Akt | Cell Signaling | 9272 | 1:2,000 (immunoblot) |
| TGM2 siRNA #5 | Qiagen | SI03020927 | P-ERK (T202/Y204) | Cell Signaling | 4370 | 1:1,000 (immunoblot) |
| TGM2 siRNA #6 | Qiagen | SI03055465 | ERK | Cell Signaling | 9102 | 1:2,000 (immunoblot) |
| TGM2 siRNA #7 | Qiagen | SI03101966 | Laminin α3 | R&D Systems | MAB2144 | 10 μg/ml (immunofluor) |
| PXDN siRNA | Sigma | SASI_Hs02_00344041 | Laminin β3 | Epitomics | 7030 | 1:1,000 (immunoblot) |
| PXDN siRNA | Sigma | SASI_Hs02_00344042 | Laminin β3 | Santa Cruz | 133178 | 1:500 (immunoblot) |
| LAMC2 siRNA | Sigma | SASI_Hs01_00136952 | Laminin γ2 | Millipore | MAB19562 | 1:1,000 (immunoblot) |
| LAMC2 siRNA | Sigma | SASI_Hs01_00136953 | Fibronectin | Epitomics | 1574 | 1:2,000 (immunoblot) |
| LAMB3 siRNA | Sigma | SASI_Hs01_00247331 | THBS1 | Millipore | BA24 | 1 μg/ml (immunoblot) |
| LAMB3 siRNA | Sigma | SASI_Hs01_00247332 | β-Actin | Sigma | A2228 | 1:10,000 (immunoblot) |
| ITGA5 siRNA | Sigma | SASI_Hs01_00058581 | EphA2 | Millipore | 05–480 | 1:500 (immunoblot) |
| ITGA5 siRNA | Sigma | SASI_Hs02_00333426 | TGM2 | Thermo | Ms-300 | 1:500 (immunoblot) |
| THBS1 siRNA | Sigma | SASI_Hs01_00148022 | Integrin α2 | Santa Cruz | 6585 | 1:500 (immunoblot) |
| THBS1 siRNA | Sigma | SASI_Hs01_00148023 | Integrin α5 | Cell Signaling | 4705 | 1:1,000 (immunoblot) |
| AREG siRNA | Sigma | SASI_Hs01_00014263 | Integrin α6 | Cell Signaling | 3750 | 1:1,000 (immunoblot) |
| AREG siRNA | Sigma | SASI_Hs01_00332258 | Integrin β1 | Cell Signaling | 4706 | 1:1,000 (immunoblot) |
| Integrin β4 | Cell Signaling | 4707 | 1:1,000 (immunoblot) | |||
| Vimentin | Cell Signaling | 5741 | 1:1,000 (immunoblot) | |||
| PTPRF | R&D Systems | MAB3004 | 0.5 μg/ml (immunoblot) | |||
| shRNA | Vendor | Catalog # | CAB39 | Cell Signaling | 2716 | 1:1,000 (immunoblot) |
| TGM2 IPTG induc shRNA | Sigma | TRCN0000272817 | Gelsolin | Cell Signaling | 8090 | 1:1,000 (immunoblot) |
| PTPRFshRNA | Sigma | TRCN0000002855 | P-Rb (S780) | Cell Signaling | 9307 | 1:1,000 (immunoblot) |
| PTPRFshRNA | Sigma | TRCN0000002857 | P-EGFR (Y1173) | Santa Cruz | 12351 | 1:500 (immunoblot) |
| non-silencing ctrl shRNA | Sigma | SHC002 | P-EGFR (Y1068) | Cell Signaling | 3777 | 1:1,000 (immunoblot) |
| P-EGFR (Y1148) | Cell Signaling | 4404 | 1:1,000 (immunoblot) | |||
| EGFR | Santa Cruz | 03 | 1:500 (immunoblot) | |||
| HER2 | Thermo | Rb103 | 1:1,000 (immunoblot) | |||
| P-Tyr | R&D Systems | HAM1676 | 1:5,000 (immunoblot) | |||
| AREG | R&D Systems | AF262 | 0.5 μg/ml (immunoblot) | |||
| AREG | R&D Systems | MAB262 | 25 μg/ml (neutralize) | |||
| mouse IgG | R&D Systems | MAB002 | 25 μg/ml (neutralize) | |||
Mass Spectrometry
Seven replicate 10-cm plates of WT or PIK3CA mutant MCF10A cells in starvation media were washed twice with PBS, scraped in PBS and pelleted by centrifugation at 500 × g for 5 min. PBS was removed and cell pellets frozen at −80 °C. One pellet was lysed for immunoblot analysis and the other six cell pellets were resuspended for mass spectrometry analysis.
Sample Preparation and Digestion of Cell Pellets
Frozen cell pellets were resuspended 100 μl of trifluoroethanol (TFE) and 100 μl of 100 mm ammonium bicarbonate, pH 8. Samples were sonicated for 20 s followed by 30 s incubation on ice. This sonication step was repeated two additional times making sure samples were placed on ice between sonications. The resulting homogenate was heated with shaking at 1000 rpm for 1 h at 60 °C followed by a second series of sonication steps, as described above (5). Protein quantitation was performed using a BCA protein assay.
An aliquot equivalent to 200 μg was removed and reduced with tris(2-carboxyethyl)phosphine (TCEP, 20 mm) and dithiothreitol (DTT, 50 mm) at 60 °C for 30 min followed by alkylation with iodoacetamide (IAM, 100 mm) in the dark at room temperature for 20 min. The lysate was diluted with the appropriate volume of 50 mm ammonium bicarbonate, pH 8.0, to reduce the TFE concentration to 10%; trypsin was added at a ratio of 1:50 (w:w) and digested overnight at 37 °C. The digested mixture was frozen at −80 °C and lyophilized to dryness. The lyophilized samples were resuspended in 350 μl of HPLC-grade water, vortexed vigorously for 1 min, and desalted using an Oasis HLB 96-well μElution plate (30 μm, 5 mg, Waters Corp., Milford, MA), which were prewashed with 500 μl of acetonitrile and equilibrated with 750 μl of HPLC-grade water. The flow-through was discarded and the plates were washed with 500 μl of HPLC-grade water and the peptides eluted with 80% acetonitrile and dried in vacuo. Samples were stored in the freezer until further analysis.
Peptide Fractionation by Isoelectric Focusing (IEF)
Isoelectric focusing (IEF) of tryptic peptides was adapted from the method of Cargile et al. (6). Tryptic peptides from 200 μg of protein were resuspended in 155 μl of 6 m urea and loaded in a custom ordered 7 cm, pH 3.5–4.5 ZOOM pH Strips (Invitrogen, Carlsbad, CA) in a ZOOM cassette and allowed to rehydrate for 1 h at room temperature. The loaded strips were focused at 21 °C on a ZOOM IPG Runner system (Invitrogen) using the following program: step at 175 V for 15 min; gradient to 2000 V over 45 min and held at 2000 V for 105 min. The strips were then cut into 15 pieces and placed in separate wells of a 96-well enzyme-linked immunosorbent assay (ELISA) plate. Peptides were eluted from the strips as follows: 200 μl of 0.1% formic acid (FA) for 15 min; 200 μl of 50% acetonitrile (ACN)/0.1% FA for 15 min; 200 μl of 100% ACN/0.1% FA for 15 min. Solutions of extracted peptides were combined and evaporated in vacuo, resuspended in 750 μl of 0.1% trifluoroacetic acid, desalted with Oasis HLB 96-well 30 μm μElution plates, (Waters Corp., Milford, MA) and evaporated in vacuo with a SpeedVac sample concentrator (ThermoFisher). Peptides were resuspended in 100 μl of 0.1% FA and placed in sample vials for LC-MS/MS analysis.
LC-MS/MS Analysis
Peptide fractions were analyzed on a Thermo LTQ Orbitrap Velos ion trap mass spectrometer equipped with an Eksigent NanoLC 2D pump and AS-1 autosampler. A 2 μl injection volume of peptides was separated on a packed capillary tip (Polymicro Technologies, Phoenix, AZ, 100 μm × 11 cm) containing Jupiter C18 resin (5 μm, 300 Å, Phenomenex, Torrance, CA) using an in-line solid-phase extraction column (100 μm × 6 cm) packed with the same C18 resin [using a frit generated with liquid silicate Kasil 1]. Mobile phase A consisted of 0.1% formic acid and Mobile phase B consisted of 0.1% formic acid in acetonitrile. A 95 min gradient was performed with a 15 min washing period (100% A) at a flow-rate of 1.5 μl/min to remove residual salt. Following the washing period, the gradient was increased to 25% B by 50 min, followed by an increase to 90% B by 65 min and held for 9 min before returning to the initial conditions. A full MS scan was collected for peptides from 400–2000 m/z on the Orbitrap portion of the instrument at a resolution of 60,000 followed by eight data-dependent MS/MS scans from lowest to highest signal intensity on the LTQ portion. Centroided MS/MS scans were acquired using an isolation width of 3 m/z, an activation time of 30 ms, an activation q of 0.250 and 35% normalized collision energy. One microscan with a max ion time of 100 ms and 1000 ms was used for each MS/MS and full MS scan, respectively. MS/MS spectra were collected using a dynamic exclusion of 60 s with a repeat of one and repeat duration of one.
Database Searching and Statistical Analysis of Spectral Counts
The .raw files were converted to mzXML files using Scansifter (v2.1.25) under default parameters (7) and are available at MassIVE (massive.ucsd.edu; ID# MSV000079060). These data were searched against the human IPI database (v. 3.56), which contains 76,539 protein entries, using the Myrimatch algorithm (v 1.6.75) (8). The database incorporated both the forward as well as reversed sequences to allow for determination of false discovery rates. The searches were performed allowing a static modification of +57 on cysteine (for carboxyamidomethylation from iodoacetamide) and dynamic modifications of +16 on methionine (oxidation). Semitryptic peptides were considered in the search parameters. Peptide and fragment ion tolerances were set to ± 0.01 and 0.5 Da, respectively. A complete detail the search parameters are provided in supplemental Table S4. The data were filtered and assembled with the IDPicker algorithm (v. 3.1.603.0) using a 1% FDR for all peptide-spectrum matches with parsimony applied (minimum protein reporting) and requiring at least two peptides (minimum peptide length of seven amino acids) and three spectra per protein in the entire data set, achieving a final protein-level FDR of 4.6% (9). Spectral count differences between cell lines were analyzed using Quasitel (10), requiring a minimum of 12 total spectral counts across the 12 compared groups and a quasi-p value of <0.005.
Orthotopic Tumor Studies
All mice were housed and maintained by the Vanderbilt University Division of Animal Care, an AAALAC-accredited facility in accordance to approved IACUC protocols. Mice were purchase from Harlan laboratories. A MMTV/rtTA × tet-op/PIK3CAH1047R mammary tumor was initially harvested from a female transgenic mouse (11, 12) and homogenized in serum-free media with gentleMACS C Tubes (Miltenyi Biotec, Bergisch Gladbach, Germany). Large tissue fragments were removed by brief, low-speed centrifugation with the liquid and smaller tumor fragments transferred to a fresh conical tube that was centrifuged at 200 × g; the tissue pellet was resuspended in 4 ml matrigel diluted with 50% PBS. Tumor homogenates (100 μl) were injected into the inguinal mammary fat pad of ∼4-week old female athymic nude mice using a 25-gauge needle and expanded as orthotopic tumors with mice receiving doxycycline (2 mg/ml) ad libitum in the drinking water. Mice bearing tumors ≥250 mm3 were randomized to treatment with vehicle (0.5% methylcellulose, 0.1% Tween-80) or gefitinib (100 mg/kg by orogastric gavage, daily). Tumors were measured at the indicated time points and volume calculated by the formula: volume = width2 × length/2. When tumor volume exceeded 1 cm3, mice were sacrificed and tumors harvested 1 h after treatment. Portions of tumors were snap frozen for biochemical analyses or fixed in 10% neutral buffered formalin and embedded in paraffin for histological analyses.
Immunodetection and qPCR
Lysates were generated by removing media from cells, washing monolayers with cold PBS and lysis with RIPA: 50 mm Tris, pH 7.4, 150 mm NaCl, 1% Nonidet P-40, 0.5% Deoxycholate, 0.1% SDS, 1 mm EDTA, 50 mm NaF, 1 mm NaVO4, and 1× protease inhibitor mixture (Roche). ∼30 mg fragments of tumor were minced with surgical scissors in 750 μl lysis buffer [20 mm Tris, pH 7.4, 150 mm NaCl, 1% Nonidet P-40, 10% glycerol, 1 mm EDTA, 1 mm EGTA, 5 mm Na4P2O7, 50 mm NaF, 10 mm β-glycerophosphate, 1 mm Na3VO4 and 1×Protease inhibitor Mixture (Roche)] and lysed with a Polytron rotor-stator homogenizor. Lysates were clarified by centrifugation at 15,000 × g for 15 min. Protein concentration was determined by BCA assay (Thermo scientific). For immunoblot analysis, equal amounts of protein/lane were subjected to SDS-PAGE, transferred to nitrocellulose membranes and analyzed with the antibodies detailed above. For immunofluorescent staining, monolayers grown in chamber slides were fixed with PBS containing 3.7% formaldehyde, washed with PBS, permeabilized with PBS containing 0.25% Triton-X-100, blocked with PBS containing 10% BSA and 0.1% Tween-20, and incubated with primary antibodies diluted in blocking solution overnight. Slides were washed and incubated with goat-derived alexa fluor 594-conjugated antibodies and mounted with Prolong Gold antifade mounting media (Life technologies). AREG concentration was determined by ELISA (R&D Systems) following the manufacturer's protocol. RNA was purified from cells using RNeasy kit (Qiagen, Valencia, CA) and cDNA was generated using High Capacity cDNA Reverse Transcription Kits (Applied Biosystems, Carlsbad, CA). qPCR was performed with a cDNA equivalent of 50 ng RNA, 1 μm For and Rev primers and SsoAdvanded SYBR Green Supermix (Bio-Rad) following the manufacturer's protocol using a CFX qPCR machine (Bio-Rad). EGFR ligand primers are previously described (13). Other primers, generated with assistance of PrimerBank (14), are listed in Table II. The CT of primer sets for each target gene and Rplp0 or GAPDH were determined in triplicate samples. ΔCT was determined by subtracting the target gene CT from the Rplp0 or GAPDH CT. 2ΔCT was used to determine the expression of each target gene relative to Rplp0 or GAPDH. This relative expression was normalized to control cells.
Table II. q-RT-PCR primer sets.
| TGM2 For | CGTGACCAACTACAACTCGG | FN1 For | AGGAAGCCGAGGTTTTAACTG |
| TGM2 Rev | CATCCACGACTCCACCCAG | FN1 Rev | AGGACGCTCATAAGTGTCACC |
| PXDN For | AATCAGAGAGATCCAACCTGGG | PTPRF For | ACCATGCTATGTGCCGCAG |
| PXDN Rev | AATGCTCCACTAGGTATCCTCTT | PTPRF Rev | CCTTGGTCGGATTCCTCACT |
| ITGB1 For | GTAACCAACCGTAGCAAAGGA | LAMA3 For | CACCGGGATATTTCGGGAATC |
| ITGB1 Rev | TCCCCTGATCTTAATCGCAAAAC | LAMA3 Rev | AGCTGTCGCAATCATCACATT |
| ITGA5 For | GGCTTCAACTTAGACGCGGAG | LAMB3 For | CCAAAGGTGCGACTGCAATG |
| ITGA5 Rev | TGGCTGGTATTAGCCTTGGGT | LAMB3 Rev | AGTTCTTGCCTTCGGTGTGG |
| THBS1 For | TGCTATCACAACGGAGTTCAGT | LAMC2 For | CAAAGGTTCTCTTAGTGCTCGAT |
| THBS1 Rev | GCAGGACACCTTTTTGCAGATG | LAMC2 Rev | CACTTGGAGTCTAGCAGTCTCT |
| EPHA2 For | TGGCTCACACACCCGTATG | ||
| EPHA2 Rev | GTCGCCAGACATCACGTTG |
Proliferation and Invasion Assays
Proliferation assays were performed by plating 1 × 10⁴ cells/60 mm plate in starvation media and replenishing fresh starvation media ± inhibitors every 2–3 days. Once control plates reached ∼75% confluency, plates were fixed and stained with PBS containing 2% formaldehyde, 1% methanol and 0.05% crystal violet, destained with three water rinses, dried, and imaged with a flatbed scanner. Alternatively, 5 × 10³ cells/well were seeded in 96-well plates and treated as described with fresh media, conditioned media or drugs replenished every 3 days. At different times, media were decanted and plates were fixed with 10% TCA, washed with tap water, dried, stained with 0.4% sulforhodamine B (SRB), destained with 1% acetic acid, dried, solubilized with 10 mm Tris base and quantitated by spectrophotometric detection at 490 nm using a plate reader. Luciferase activity was detected by incubating cells with 150 μg/ml d-luciferin using an IVIS-200 machine and Living Image software at the Vanderbilt University Institute of Imaging Sciences. For invasion assays, transwell membranes with 8-μm pores (Corning) were coated with matrigel diluted 1:20 in OptiMEM, blocked with 1% BSA and placed in a 24-well plate. Cells (1 × 10⁵) were seeded in starvation media in the upper chamber and allowed to migrate toward DMEM/F12 containing 10% FBS for 24 h. The upper chamber was swabbed to remove cells and the lower chamber was stained/fixed with the above described crystal violet solution and destained with tap water and dried. Photomicrographs (100×) of triplicate membranes were captured, converted to binary images, and the area occupied by cells quantitated using Image J software, summing three photos per membrane. The average area occupied by cells for three membranes was normalized to control cells.
Exosome and Microvesicle Isolation
2.5 × 10⁶ MCF10A cells were plated in duplicate 15-cm dishes in complete medium and allowed to proliferate for 48 h. The monolayers were then washed twice with PBS and each plate incubated with 17 ml serum-free, EGF-free media for 24 h. Conditioned media was harvested and pooled from each pair of plates (33 ml total); monolayers were trypsinized and cells were counted for normalization of vesicle number to cell number. Conditioned media was centrifuged at 2000 × g for 20 min to remove any cells and debris. Eleven ml of conditioned media was kept as “whole conditioned media” and 22 ml were centrifuged at 16,000 × g for 30 min. The microvesicle pellet was resuspended in 11 ml serum-free, EGF-free MCF10A media. The 22-ml supernatant was centrifuged at 100,000 × g for 20 h; the exosome pellet was resuspended in 11 ml serum-free, EGF-free MCF10A media and the remaining supernatant was considered “vesicle-depleted conditioned media,” which was confirmed by Nano Sight vesicle counting. Vesicle number in all fractions was determined by Nano Sight counting and is presented as both vesicle #/cell or vesicle #/ml. Next, 100 μl of each conditioned media/vesicle fraction or unconditioned media was applied to 96-well plates of WT cells in 100 μl starvation media (5 × 10³/well) ± 10 μg/ml cetuximab. Fresh starvation media and whole conditioned media or vesicle fractions were applied on day 2 and 4 and proliferation of WT cells assessed by SRB assay after 7 days of treatment. Fractions were prepared for immunoblot analysis by mixing 300 μl fraction (all in serum-free, EGF-free MCF10A media) with 100 μl 4× sample buffer containing β-mercaptoethanol.
Databases
Kegg analysis of pathways upregulated in PIK3CA mutant MCF10A cells was performed using the Duke University GATHER web-based software (15). The intrinsic molecular subtype of breast cancer cells used herein and EGFR ligands expression in human breast cancer cell lines are from published microarray data (4). The EGFR ligand expression in HER2-and PIK3CAH1047R driven mouse mammary tumors are from published microarray data (12). The correlation between gene expression and patient RFS was determined using web-based software, kmplot.com (16). Four EGFR pathway signatures in 476 tumor samples in TCGA data set for which intrinsic subtype by PAM50 and PIK3CA mutation status is known (1) were determined by calculating the median score of published EGFR-driven gene lists (17, 18) and then comparing PIK3CA mutant to PIK3CA WT tumors. EGFR and P-Y1068 EGFR protein abundance was queried from the 361 breast tumors in TCGA RPPA data set (1), comparing PIK3CA mutant versus PIK3CA WT tumors. EGFR transcript abundance was queried from 1031 breast cancer samples in TCGA mRNA sequencing data set as previously described (19) comparing PIK3CA mutant to PIK3CA WT tumors. To determine if genes corresponding to the proteins upregulated in PIK3CA mutant MCF10A cells correlated with BLBC in the TCGA, log transformed TCGA RNAseq gene expression data (1) for 38 genes from 514 tumors were analyzed. Samples were binned into PAM50 basal/claudin-low (94 and 8, respectively) and “other” (230 luminal A, 126 luminal B, and 56 HER2-enriched). Differential expression was quantified by linear model, comparing basal/claudin-low to all other subtypes. The Bonferroni method was used to correct for multiple hypothesis testing (0.05/38 = 0.0013).
Clinical Trials
ClinicalTrials.gov Identifier: NCT01097642: Patients diagnosed with triple negative invasive breast cancer were randomized to preoperative treatment with (1) ixabepilone (4 cycles at 40 mg/m2 i.v. every 3 weeks) or (2) ixabepilone + cetuximab (12 weekly infusions, 400 mg/m2 i.v. on week 1, then 250 mg/m2). After surgery, pathological complete response was scored in the mastectomy specimen by an expert breast pathologist. DNA was isolated from formalin-fixed, paraffin-embedded diagnostic core biopsies and subjected to competitive allele-specific PCR (Applied Biosystems), testing for E545K or H1047R PIK3CA mutations as previously described (20). ClinicalTrials.gov Identifier: NCT00248287: Patients with metastatic breast cancer were randomized to receive: 1) Irinotecan (90 mg/m2) + Carboplatin (AUC = 2.0) i.v. on days 1 and 8 of a 21 day cycle or 2) Irinotecan + Carboplatin + Cetuximab (400 mg/m2 week 1 and 250 mg/m2 weekly thereafter). DNA was extracted from the primary breast tumor and the recurrent lung metastasis and subjected to deep sequencing evaluating 3769 exons of 236 cancer-related genes and 47 introns from 19 genes that are frequently rearranged in cancer using the Illumina HiSeq 2000 to at an average depth exceeding 500× as previously described (21, 22).
Statistical Analyses
GraphPad Prism or Microsoft Excel was used for statistical analyses. For two-group analyses, Student's t tests were conducted. Error bars represent S.E.
RESULTS
PIK3CA Mutation Increases Secreted Factors and ECM-interacting Proteins
MCF10A cells undergo growth arrest when cultured in media lacking EGF or growth factors (starvation media) (23). However, MCF10A cells with heterozygous knock-in of E545K or H1047R PIK3CA mutations exhibit growth factor-independent proliferation and constitutive activation of S6, Akt, and ERK, without altering total levels of p110α (Fig. 1A–1B) (3).
Fig. 1.
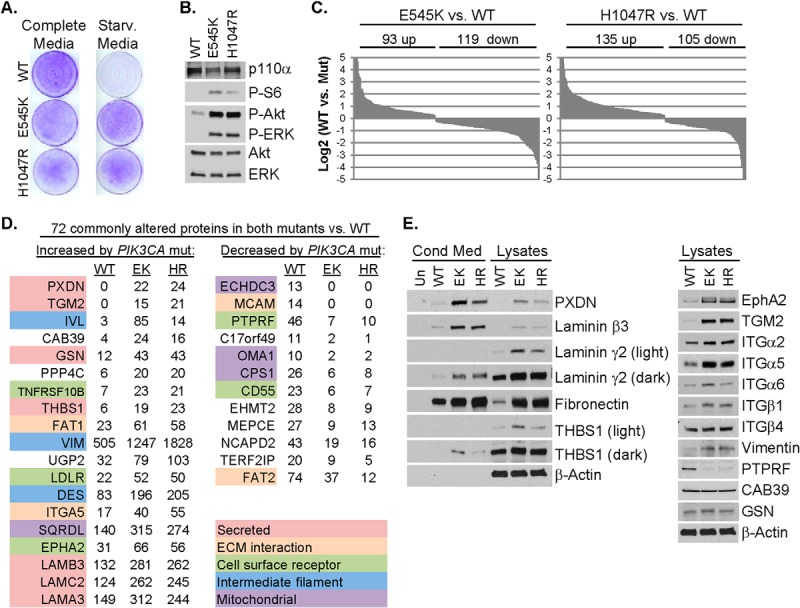
Proteomic analysis of PIK3CA mutant MCF10A cells shows upregulation of secreted factors and ECM–cell interacting molecules. A, Wild type (WT) or PIK3CA mutant (E545K or H1047R) MCF10A cells were cultured in complete or starvation media for 6 days; proliferation was assessed by crystal violet staining of cell monolayers. B, Lysates of cells cultured for 2 days in starvation media were assessed by immunoblot analysis using the indicated antibodies. C, LC-MS/MS analysis of cell lysates was performed to determine relative protein abundance in E545K or H1047R PIK3CA MCF10A compared with WT PIK3CA MCF10A cells. Each protein which differed between WT and mutant cells with a p < 0.005 is presented as the log2 spectral count value of mutant versus WT. D, Partial list of the most highly up or downregulated proteins common in E545K (EK) and H1047R (HR) MCF10A cells compared with WT MCF10A cells presented as total spectral counts. E, Cells were cultured in starvation media. After 48 h, lysates and conditioned media were prepared and subjected to immunoblot analysis with the indicated antibodies.
To interrogate how PIK3CA mutation alters the proteomic profile of these cells, we performed LC-MS/MS analyses of WT, E545K, and H1047R MCF10A whole cell lysates. This approach identified differences in 212 and 240 proteins between WT cells and E545K or H1047R cells, respectively (Fig. 1C and supplemental Tables S2 and S3). Of these, 72 protein changes were commonly detected in both E545K and H1047R cell lines versus WT (43 upregulated and 29 down-regulated) [Fig. 1D (partial list) and supplemental Table S1]. A complete inventory of proteins identified by LC-MS/MS, including accession number, number of unique peptides identified and percent sequence coverage is provided (supplemental Table S5). Immunoblot analysis was performed to validate a subset of proteins identified by LC-MS/MS. Compared with WT cells, PIK3CA mutant cells exhibited increased levels of peroxidasin (PXDN), laminin-332 chains (laminin α3, β3, and γ2), thrombospondin (THBS1), EphA2, tissue transglutaminase (TGM2), integrins β1, α2, α5, and α6, and vimentin (Fig. 1E, supplemental Fig. S1A). Fibronectin, a primary ligand for integrin α5, was increased in mutant cell lines. Despite increased levels of integrin β4, calcium binding protein 39 (CAB39) and gelsolin (GSN) by LC-MS/MS, immunoblot analysis of these proteins appeared similar in the three cell lines. A receptor tyrosine phosphatase, PTPRF, was decreased in both mutant cell lines. Ten of 11 corresponding mRNA transcripts correlated with changes observed at the protein level (supplemental Fig. S1B). Immunoblot analysis of lysates of cells cultured in complete media showed similar expression changes, suggesting these proteomic alterations are not secondary to proliferation induced by mutant PIK3CA under growth factor depleted conditions (supplemental Fig. S1C).
Of the top 19 proteins upregulated by both PIK3CA mutations, seven were secreted proteins and five were cell surface receptors or ECM interacting molecules (Fig. 1D). Thus, ∼60% of the proteins upregulated by PIK3CA mutations may involve communication of mutant cells with their surrounding microenvironment. Furthermore, KEGG pathway analysis showed that PIK3CA mutant cells had increased activation of focal adhesion, ECM-receptor interaction and regulation of actin cytoskeleton (supplemental Fig. S1D). Consistent with this analysis, PXDN, laminin β3, laminin γ2, fibronectin, and THBS1, but not TGM2, were increased in media conditioned by PIK3CA mutant cells (Fig. 1E). Also consistent with the alterations in adhesion and actin cytoskeleton-associated molecules, PIK3CA mutant cells exhibited an increased ability to invade through matrigel-coated transwell filters (supplemental Fig. S1E).
PIK3CA Mutant Cell Proliferation is Reduced Upon Down-regulation of Proteins Identified by LC-MS/MS
To assess the functional relevance of the observed protein changes, we transfected WT and PIK3CA mutant MCF10A cells with nontargeted siRNA (control) or two siRNAs each targeting EphA2, PXDN, laminin γ2, integrin β1 or TGM2 under starvation conditions. These targets included the most differentially expressed proteins identified by LC-MS/MS (PXDN and TGM2), the receptor tyrosine kinase (RTK) EphA2, one of the three laminin-332 chains and integrin β1, which functionally dimerizes with all α integrins also identified by LC-MS/MS. Knock-down of EphA2, PXDN, laminin γ2, or integrin β1 resulted in decreased growth factor-independent proliferation of PIK3CA mutant cells, without reducing phosphorylation of Akt, suggesting this reduction in cell growth was not because of a blockade of PI3K signaling. ERK phosphorylation was reduced by knock-down of EphA2, but not the other candidates (Fig. 2A–2H). Because TGM2 expression could not be reduced by siRNA (supplemental Fig. S2A), we utilized an IPTG-inducible TGM2 shRNA. shRNA-induced down-regulation of TGM2 did not affect the proliferation of PIK3CA mutant cells (supplemental Fig. S2B–2C). Although decreased EphA2 expression reduced proliferation of PIK3CA mutant cells (Fig. 2G), EphA2 overexpression in WT cells did not stimulate their proliferation (Fig. 2I). Because expression of the PTPRF receptor tyrosine phosphatase was reduced in PIK3CA mutant cells, and loss of phosphatases can sustain oncogenic kinase signaling, we next examined whether loss of PTPRF with or without concurrent EphA2 overexpression increased proliferation of WT cells. Loss of PTPRF increased proliferation of WT cells. However, depletion of PTPRF in combination with EphA2 overexpression led to even greater proliferation and ERK phosphorylation, suggesting these two proteins cooperate in promoting growth of PIK3CA mutant cells (Fig. 2I–2J). WT cells expressing PTPRF shRNA showed increased EGFR phosphorylation (Fig. 2J), suggesting that the loss of PTPRF in PIK3CA mutant cells activates EGFR. Conversely, overexpression of wild-type PTPRF (but not phosphatase-deficient PTPRF) reduced EGFR and ERK phosphorylation and inhibited proliferation of PIK3CAH1047R cells (Fig. 2K–2L). These data suggest that, in addition to Akt, PIK3CA mutation activates other signaling pathways that drive cell proliferation.
Fig. 2.

Loss of PTPRF and upregulation of EphA2 cooperate to promote EGF-independent proliferation and EGFR activation. WT or PIK3CA mutant (EK or HR) MCF10A cells were transfected with 25 nm control siRNA or two different siRNA sequences targeting PXDN, A–B, Laminin γ2, C–D, Integrin β1, E–F, or EphA2, G–H, in starvation media. A, C, E, G, Relative proliferation, normalized to control siRNA transfected cells, was assessed at 96 h by SRB assay (average of six biological replicates ± S.E.). B, D, F, H, Cells were harvested 48 h after transfection and cell lysates evaluated by immunoblot analysis with the indicated antibodies. I, Proliferation of WT MCF10A cells stably expressing GFP or EphA2 and nonsilencing shRNA (shN.S.) or PTPRF-targeted shRNA (sh#1 or sh#2) was determined by SRB assay after 5 days of culture in starvation media (average of six biological replicates ± S.E.). J, Cells treated as described in panel I were lysed after 3 days and evaluated by immunoblot analysis. K, PIK3CAH1047R (HR) MCF10A cells stably expressing empty vector (vec), wild type (WT) PTPRF, or phosphatase-deficient (PD) PTPRF were seeded in equal numbers and cultured for 9 days in starvation media (with media replenished every 3 days); proliferation was assessed by crystal violet staining of cell monolayers. L, Cells treated as described in panel K were harvested after 3 days of culture and lysates evaluated by immunoblot analysis with the indicated antibodies. *p < 0.05 Student's t test.
Secreted Factors from PIK3CA Mutant Cells Activate EGFR/ERK and Promote Growth Factor- and PI3K-Independent Proliferation
Media conditioned by PIK3CA mutant cells markedly increased proliferation, P-Rb and P-ERK in recipient WT cells. All these responses were blocked by the MEK1/2 inhibitor AZD6244 (selumetinib) (24) but not by the p110α-specific inhibitor BYL719 (25) (Fig. 3A–B), suggesting a MEK-dependent paracrine effect of the mutant cells on the WT cells. Both AZD6244 and BYL719 inhibited proliferation and P-Rb levels in PIK3CA mutant cells (Fig. 3C–3D). To investigate this paracrine effect further, we cocultured 1000 GFP-luciferase expressing WT MCF10A cells with 500, 250, 125, or 62 mCherry-labeled WT, E545K or H1047R cells. Photomicrographs captured at the end of 2 weeks in starvation media showed expansion of WT-GFP+ cells when cocultured with PIK3CA mutant-mCherry cells, but not with WT-mCherry cells (Fig. 3E). Using luciferase activity to measure WT cell number, we found increased luminescence of WT-GFP-luciferase cells cocultured with PIK3CA mutant mCherry but not with WT-mCherry cells (Fig. 3F).
Fig. 3.

Secreted factors from PIK3CA mutant MCF10A cells are sufficient to promote growth factor- and p110α-independent proliferation and EGFR activation. A–B, WT MCF10A cells in starvation media were treated with conditioned media harvested from WT or PIK3CA mutant (EK or HR) cells and DMSO, 1 μm AZD6244 or 1 μm BYL719. Cell proliferation was assessed by staining monolayers with crystal violet on day 18, A. After 5 days, lysates were prepared and evaluated by immunoblot analysis, B. C–D, WT or PIK3CA mutant MCF10A cells were cultured in starvation media in the presence of DMSO, 1 μm AZD6244 or 1 μm BYL719. Proliferation was assessed after 8 days, C. After 24 h, lysates were prepared for immunoblot analysis, D. E–F, One-thousand WT GFP-luciferase-expressing MCF10A cells were incubated in starvation media with 62, 125, 250, or 500 mCherry labeled WT, EK, or HR MCF10A cells. Cells were cultured for 14 days before being photomicrographed, E, or imaged with an IVIS200 bioimager, F, to quantitate luciferase expression (average photons/sec of biological duplicates ± S.E.; *p < 0.05 Student's t test). G, WT (W), E545K (EK) or H1047R (HR) MCF10A cells were cultured in starvation media for 2 days (lanes 1–3); WT cells were treated with the indicated conditioned media for 7 days (lanes 4–7). Cell lysates were harvested and subjected to immunoprecipitation and P-Tyr immunoblot analysis. P-Tyr band intensities were quantitated and normalized to lane 1. H–I, WT, EK, or HR MCF10A cells were cultured in starvation media ±10 μg/ml cetuximab. Cell proliferation was assessed after 8 days, H, and cell lysates prepared for immunoblot analysis after 2 days, I. J–K, Starvation media conditioned by WT, EK, or HR MCF10A cells were applied to WT MCF10A cells plated in starvation media ±10 μg/ml cetuximab. Cell proliferation was assessed after 8 days, J, and cell lysates prepared for immunoblot analysis after 2 days, K. Media and drugs were replenished every 3 days in all experiments.
PIK3CA mutant cells or WT cells treated with media conditioned by PIK3CA mutant cells showed increased EGFR phosphorylation compared with untreated WT cells, whereas phosphorylation of the closely related HER2 RTK was unaffected (Fig. 3G). The EGFR blocking antibody cetuximab reduced P-ERK and proliferation in PIK3CA mutant cells (Fig. 3H–3I). The induction of proliferation, P-EGFR and P-ERK in WT cells treated with the media conditioned by PIK3CA mutant cells was also inhibited by cetuximab (Fig. 3J–3K). These data suggest that PIK3CA mutation induces EGFR- and MEK-dependent paracrine signals that drive cell growth independent of intrinsic PI3K activity in the recipient cell population.
Amphiregulin Induced by PIK3CA Mutations is Necessary and Sufficient to Promote Growth Factor-Independent Proliferation
Because EGFR-activating ligands were not identified in the MS analysis, we performed quantitative PCR analysis measuring all eight ErbB family ligands. This revealed increased levels of transcripts encoding HB-EGF, epiregulin (EREG) and amphiregulin (AREG) in PIK3CA mutant cells. Compared with WT cells, PIK3CA mutant cells contained >10-fold and fourfold higher AREG mRNA and protein, respectively (Fig. 4A–4B). Increased expression of AREG in PIK3CA mutant versus WT cells was observed in both complete media and starvation media, suggesting AREG overexpression is not secondary to increased cell proliferation induced by the PIK3CA mutations (supplemental Fig. S3A). Interrogation of cDNA microarray data for five EGFR ligands in 51 human breast cancer cell lines (4) showed that AREG expression is increased in PIK3CA mutant compared with PIK3CA WT cells, whereas the other four ligands are similarly expressed (supplemental Fig. S3B). AREG protein expression also correlated with PIK3CA mutation status in a panel of 19 breast cancer cell lines: four of the top five AREG expressing cells contained PIK3CA hot spot mutations (supplemental Fig. S3C). Inhibition of p110α with BYL719 decreased AREG transcript and protein expression in PIK3CA mutant MCF10A cells (Fig. 4C–4D). Treatment with the Akt inhibitor MK-2206 (26) also suppressed AREG protein in PIK3CA mutant cells (supplemental Fig. S3D). Finally, inhibition of p110α with BYL719 decreased AREG protein levels in PIK3CA mutant MCF7, T47D, BT20, and SUM102 breast cancer cells (supplemental Fig. S3E–S3F), further supporting a causal association between PI3K/Akt signaling and AREG expression.
Fig. 4.

Amphiregulin induced by PIK3CA mutation promotes EGF-independent cell proliferation. A, The expression of eight EGFR-family ligands in WT and PIK3CA mutant MCF10A cells cultured in starvation media was determined by qPCR and normalized to the expression of RPLP0; the normalized expression of each ligand in each mutant cell line is presented relative to WT cells (average of biological quadruplicates ± S.E.). B, Amphiregulin (AREG) concentration in 25 μg of WT or PIK3CA mutant MCF10A cell lysate was determined by ELISA (average of technical duplicates ± S.E.). Lysates were harvested from cells cultured in starvation media. C–D, WT or PIK3CA mutant MCF10A cells were cultured in starvation media containing DMSO or 1 μm BYL719. C, After 48 h, RNA was harvested and qPCR was used to determine the RPLP0 normalized expression of AREG in each mutant cell line, presented relative to the DMSO control (average of biological triplicates ± S.E.). D, After 72 h, cell lysates were prepared and analyzed by immunoblot analysis with the indicated antibodies. E–F, WT, PIK3CA mutant (EK and HR), or HRAS mutant (AT1) MCF10A cells were cultured in starvation media containing 25 μg/ml mouse IgG or AREG neutralizing antibody. Relative proliferation was assessed by SRB assay after 6 days of treatment (E; average of biological triplicates ± S.E.) and lysates were prepared for immunoblot analysis after 2 days, F. G, Starvation media conditioned by WT, EK or HR MCF10A cells were applied to WT MCF10A cells cultured in starvation media containing 25 μg/ml mouse IgG or AREG neutralizing antibody. After 9 days, monolayers were stained with crystal violet to assess cell proliferation. H–I, Growth factor starved WT MCF10A cells were seeded to plastic or fibronectin-coated plates and treated with the indicated doses of AREG. After 7 days, proliferation was assessed by crystal violet staining, H. Lysates were prepared for immunoblot analysis after 3 days, I. J, The number of microvesicles or exosomes harvested from starvation media conditioned by WT or PIK3CA mutant MCF10A cells was determined by Nano Sight and normalized to the number of cells (left) or to volume (right). K–L, Unconditioned starvation media (U.C.), whole conditioned media (C.M.whole), conditioned media depleted of vesicles (C.M.−ves), and exosome fraction or microvesicle fraction were evaluated by immunoblot analysis with the indicated antibodies, K. WT MCF10A cells plated in starvation media were treated with these fractions ±10 μg/ml cetuximab; proliferation was assessed by SRB assay after 7 days in culture (L; average of six biological replicates ± S.E.). Media and drugs were replenished every 3 days in all experiments. *p < 0.05 Student's t test.
Similar to PIK3CA mutant cells, MCF10AT1 cells, which bear a G12V HRAS mutation, proliferate in the absence of exogenous growth factors (supplemental Fig. S3G). We treated WT, PIK3CA mutant or HRAS mutant MCF10A cells with IgG or an AREG neutralizing monoclonal antibody (27) in growth factor-depleted media. Treatment with the AREG antibody decreased P-EGFR, P-ERK and proliferation in PIK3CA mutant but not in HRAS mutant MCF10AT1 cells (Fig. 4E–4F). AREG siRNA also decreased proliferation, P-Rb and P-ERK in PIK3CA mutant cells (supplemental Fig. S3H–S3I). Finally, antibody-mediated AREG blockade reduced the proliferation of WT cells induced by media conditioned by PIK3CA mutant cells (Fig. 4G). Taken together, these results suggest the induction of AREG is specific to a mutant PIK3CA. Serum- and growth factor-starved WT cells treated with AREG (5 ng/ml) transiently increased EGFR phosphorylation at Y1068 and Y1173. However, AREG-induced ERK activation was maintained through 48 h (supplemental Fig. S3J). These data suggest that AREG-induced EGFR phosphorylation is relatively transient, but results in sustained activation of downstream signal transducers such as ERK.
HRAS mutant MCF10AT1 cells displayed increased activation of Akt, ERK and S6, increased expression of PXDN, THBS1 and EphA2, and decreased PTPRF expression compared with WT cells. However, unlike PIK3CA mutant cells, HRASG12V cells did not overexpress laminin β3, laminin γ2, fibronectin, TGM2, integrin α5 or integrin β1 (supplemental Fig. S4A), and secreted three to sevenfold less AREG than PIK3CA mutant cells (supplemental Fig. S4B). Further, media conditioned by PIK3CA mutant cells but not by HRAS mutant cells, stimulated proliferation of WT cells (supplemental Fig. S4C), suggesting that induction of these proteins involved in paracrine and/or microenvironment interactions may be specific to PIK3CA mutations.
The media conditioned by PIK3CA mutant cells contained ∼150–300 pg/ml AREG (supplemental Fig. S4B). However, ≥2500 pg/ml of recombinant AREG was required to stimulate WT cell proliferation and P-ERK (supplemental Fig. S4C–S4D) suggesting that, in addition to AREG, other factors contribute to the growth promoting effects of PIK3CA mutant conditioned media. For example, fibronectin, which is robustly secreted by PIK3CA mutant cells but not by HRAS mutant cells (Fig. 1E, supplemental Fig. S4A), enhanced AREG-induced proliferation and P-ERK in WT cells without altering P-Akt or P-EGFR (Fig. 4H–4I). Additionally, fibronectin induced TGM2 expression while AREG induced EphA2, THBS1, and fibronectin expression in WT cells (supplemental Fig. S4E). These results suggest AREG and fibronectin secreted by PIK3CA mutant cells exert additive and temporally distinct paracrine effects and also induce expression of some of the proteins modulated by mutant PIK3CA that were identified by LC-MS/MS.
AREG and ECM proteins have been shown to be carried on exosomes, late endosome-derived extracellular vesicles that contains bioactive protein and RNA cargoes (28, 29). We previously reported that exogenous expression of PIK3CAH1047R promotes exosome secretion in head and neck cancer cells (30). To test this in knock-in PIK3CA mutant MECs, we purified exosomes and larger shed microvesicles from conditioned media. PIK3CA mutant cells secreted nearly 3-fold more exosomes as WT cells, whereas microvesicle secretion was relatively unaltered (Fig. 4J). Laminin β3, laminin γ2, PXDN, fibronectin, and the exosome marker CD63 were present in whole conditioned media and exosome fractions, but were not detected in the microvesicle fraction or in conditioned media depleted of vesicles, suggesting that these proteins are mainly associated with secreted exosomes. AREG was detected in whole conditioned media, conditioned media depleted of vesicles, and in the exosome fraction (Fig. 4K), suggesting that AREG is secreted on exosomes and shed either from the exosome or plasma membrane surfaces by proteinases (31). PIK3CA mutant fractions contained more AREG than PIK3CA WT fractions, and H1047R cells contained more AREG than E545K cells. The fractions with highest AREG induced the greatest proliferation of WT cells. Additionally, whole conditioned media contained more AREG and conferred greater proliferation than the other fractions (Fig. 4K–4L). The proliferation conferred by all fractions was blocked by treatment with cetuximab (Fig. 4L). These data suggest enhanced exosome secretion induced by mutant PIK3CA provides an EGFR-dependent mechanism for the delivery of secreted factors associated with transforming potential.
Proteins Induced by PIK3CA Mutations Correlate With Decreased Relapse-free Survival (RFS) and EGFR Signaling in BLBC
Using a panel of luminal and BLBC cell lines, we interrogated expression of proteins found by MS to be altered in PIK3CA mutant MCF10A cells. Of these, TGM2, EphA2, integrin β1, integrin α5, fibronectin, THBS1, laminin β3, and laminin γ2 were also overexpressed in basal-like compared with luminal breast cancer cell lines (Fig. 5A, supplemental Fig. S5A). PTPRF, which is down-regulated in PIK3CA mutant MCF10A cells, is reduced in BLBC cell lines. However, there was no correlation of these changes with PIK3CA mutation status, suggesting the possibility that the suite of proteins altered in PIK3CA mutant MCF10A cells is more specific to the BLBC subtype of breast cancer. Further, in primary breast tumors in the TCGA, mRNAs of 18/38 proteins upregulated in PIK3CA mutant cells were also enriched in BLBC, 8/38 were enriched in nonbasal cancers (HER2 and luminal), and the remaining 12 were not associated with any subtype (supplemental Fig. S5B).
Fig. 5.

Proteins upregulated by PIK3CA mutation correlate with decreased relapse free survival in BLBC. A, Lysates of a panel of luminal and BLBC cell lines were prepared and evaluated by immunoblot analysis with the indicated antibodies. B, A data set that includes RFS time and cDNA gene expression profiling data of the tumors from 2274 breast cancer patients (all) or a subset of 417 BLBC was queried (16). For each of the indicated genes, groups were divided equally in half (high expressors and low expressors); the RFS hazard ratio (HR) attributed to high expression and logrank p value between the two groups are presented. C, The same data set was queried with a multiple comparison of high versus low expression of the seven indicated genes. The Kaplan-Meier survival plots, hazard ratio and logrank p values for all patients and patients with BLBC are presented. D, The five indicated cell lines were transfected with control siRNA or two different siRNA sequences targeting PXDN, THBS1, EphA2, laminin γ2, laminin β3, or integrin α5 at a siRNA concentration of 25 nm in complete media. Relative proliferation, normalized to control siRNA transfected cells, was assessed at 96 h by SRB assay (average of five biological replicates ± S.E.).
We next interrogated public data sets (16) to correlate transcript expression of the proteins enriched in BLBC cell lines with breast cancer patient outcome. High expression of PXDN or THBS1 correlated with a shorter RFS in BLBC (relapse hazard ratios of 1.52 and 1.34, respectively), but not when all breast cancer subtypes were analyzed together. High expression of EPHA2, LAMA3, LAMB3, and LAMC2 each correlated with better RFS when all breast cancer subtypes were analyzed jointly. This correlation with an improved RFS was lost in BLBC (Fig. 5B, supplemental Fig. S5C). In examining multiple genes, combined high expression of PXDN, THBS1, integrin α5, EphA2, laminin α3, laminin β3, and laminin γ2 correlated with shorter RFS in BLBC (relapse hazard ratio of 1.85), but had no prognostic value when applied to all breast cancers (hazard ratio of 1.05) (Fig. 5C), further implying a subtype specific association.
Next, to determine whether these proteins play a role in BLBC growth, we transfected four BLBC cell lines with siRNAs targeting PXDN, THBS1, EphA2, laminin γ2, laminin β3, or integrin α5. All four cell lines exhibited reduced proliferation when PXDN or THBS1 expression was knocked down, whereas three of the four cell lines were at least modestly sensitive to reduction of laminin β3 or integrin α5 (Fig. 5D, supplemental Fig. S5D). The proliferation of a luminal cell line, MDA-MB-361, which has low expression of these proteins, was not inhibited by these siRNAs, with the exception of PXDN knockdown. These data suggest that the proteins identified by LC-MS/MS of PIK3CA mutant MCF10A cells are associated with the virulence of BLBC.
Analysis of the breast tumor reverse phase protein array (RPPA) data in TCGA (1) showed that PIK3CA mutant BLBCs display increased levels of EGFR and P-Y1068-EGFR compared with PIK3CA WT BLBCs. However, neither EGFR nor P-Y1068-EGFR correlated with PIK3CA status when all breast cancers were examined jointly (Fig. 6A). Similarly, EGFR gene expression was higher in PIK3CA mutant BLBC than PIK3CA WT BLBC. There was no difference in EGFR expression between PIK3CA mutant and WT when all breast cancer subtypes were evaluated together (Fig. 6B). TCGA gene expression data were used to compute published EGFR pathway activation scores (17, 18) comparing PIK3CA WT and mutant breast cancers. Two of four EGFR activation scores were increased in PIK3CA mutant BLBCs compared with WT. However, when all breast cancer subtypes were jointly evaluated, none of the EGFR pathway scores was higher in PIK3CA mutant cancers (Fig. 6C). These data suggest PIK3CA mutation is correlated with EGFR activity only in BLBC but not the other molecular subtypes of breast cancer.
Fig. 6.

PIK3CA mutations correlate with EGFR activity in basal-like breast cancer. A, TCGA reverse phase protein array data were analyzed to determine EGFR and P-Y1068 EGFR levels comparing PIK3CA WT versus PIK3CA mutant tumors in all breast cancers (top) or in the basal-like subtype (bottom). B, TCGA gene expression data were analyzed to determine EGFR levels comparing PIK3CA WT versus PIK3CA mutant tumors in all breast cancers (top) or in the basal-like subtype (bottom). C, TCGA gene expression data was used to compute four different EGFR pathway scores (17, 18) comparing PIK3CA WT to PIK3CA mutant tumors in all breast cancers (top) or in the basal-like subtype (bottom). D, Mammary tumors derived from MMTV/rtTA × tet-op/PIK3CAH1047R transgenic mice were transplanted into the mammary fat pad of athymic nude mice. Once tumors reached ≥250 mm3, mice were treated daily with vehicle or gefitinib (100 mg/kg orogastric gavage). Average tumor volume ±S.E. of six vehicle-treated and nine gefitinib-treated tumors is presented in mm3 (*p < 0.05 Student's t test). E, Tumor-bearing mice were treated for 4 days. 1 h after final treatment, tumors were harvested, and lysates prepared followed by immunoblot analyses. F–G, BT20 and SUM102 cells were cultured in starvation media with DMSO (D) or 1 μm Gefitinib, (G). Plates were fixed on days 0, 2, 4, and 6. Media and drugs were replenished every 3 days. Relative proliferation was assessed by SRB assay (F; average of six biological replicates ± S.E.). After 4 days of treatment, cell lysates were prepared for immunoblot analyses, G.
Clinical Activity of EGFR Inhibitor against PIK3CA Mutant Breast Cancers
EGFR is overexpressed in the majority of patients with triple negative breast cancer (TNBC). This clinical subtype of breast cancer predominantly exhibits basal-like gene expression (1). Clinical trials with EGFR inhibitors have been performed in patients with TNBC. In a study of patients with metastatic TNBC, a doubling of the response rate was observed when cetuximab was combined with cisplatin compared with cisplatin alone (32). In a neoadjuvant trial of ixabepilone and cetuximab (ClinicalTrials.gov #NCT01097642), 8/23 patients achieved a pathological complete response (pCR: no detectable tumor in the post-treatment mastectomy specimen). DNA was extracted from 19 available pretreatment biopsies (5 pCR, 14 nonpCR) and subjected to competitive allele-specific PCR to detect PIK3CA hot spot mutations. One of five tumors (20%) that achieved a pCR contained E545K PIK3CA whereas all nonresponsive tumors harbored wild-type PIK3CA (Chi-squared = 2.956 with one degree of freedom p = 0.0428, one tailed).
In another clinical trial evaluating chemotherapy (irinotecan + carboplatin) plus cetuximab in patients with metastatic TNBC (ClinicalTrials.gov #NCT00248287), one patient exhibited an exceptional clinical response. After 8 months of treatment, the primary breast tumor and pulmonary metastases responded completely. At this time, the patient underwent lumpectomy that showed no residual cancer in the breast; cetuximab alone was continued. One year later a pulmonary mass recurred and was surgically resected, showing histology identical to the original cancer. The patient was rendered free of disease and continued on cetuximab treatment for 8 years with no evidence of recurrence. DNA from the primary breast tumor and the lung metastasis that recurred 8 months after the original diagnosis were extracted and subjected to targeted NGS of 3,769 exons of 236 oncogenes and tumor suppressors plus 47 introns of 19 genes frequently rearranged in cancer. Both lesions harbored the same TP53 mutation (832C>T, p.P278S) and MCL1 and MYC amplifications suggesting similar clonal origin of the primary tumor and the metastasis. However, an activating PIK3CA mutation (1258T>C, p.C420R) (33) found in the pretreatment breast cancer biopsy was undetectable in the recurrent lung metastasis. These data suggest that the PIK3CA mutant primary tumor was likely EGFR-dependent and eliminated by treatment with cetuximab whereas the PIK3CA WT lung metastasis was not. Although limited, these clinical data are consistent with EGFR-dependent tumor cell proliferation induced by mutant PIK3CA that can be exploited with therapeutic intent.
The data above suggest PIK3CA mutant tumors depend, at least in part, on EGFR for their viability. To expand on this, we treated PIK3CA mutant BLBC cells and transgenic mouse mammary tumors driven by PIK3CAH1047R (11) with the EGFR inhibitor gefitinib. Of note, cetuximab was not used because it does not recognize mouse EGFR. Murine mammary tumors driven by transgenic expression of PIK3CAH1047R express higher levels of AREG mRNA and protein compared with transgenic mammary tumors driven by HER2 (supplemental Fig. S6A–S6B) (12). Importantly, these PIK3CAH1047R tumors have been shown to cluster with transgenic mouse tumors with basal-like gene expression, such as C3-Tag (34). Gefitinib inhibited P-EGFR and P-ERK and delayed growth of PIK3CAH1047R transgenic tumors (Fig. 6D–6E). Gefitinib also reduced the proliferation of PIK3CA mutant human BLBC BT20 and SUM102 cells and also reduced the phosphorylation of Akt and ERK (Fig. 6F–6G). These data suggest that blockade of EGFR is a therapeutic strategy which warrants further clinical investigation in BLBC with aberrant activation of PI3K.
DISCUSSION
Proteomic analysis of MCF10A cells identified a key role for secreted factors in growth factor-independent proliferation induced by PIK3CA hot spot mutations. A similar model which utilized microarray analyses focused on mutant PIK3CA-induced, NFκB-dependent cytokine production and STAT3 induction (35). In our studies, proliferation of WT cells was conferred by the media conditioned by PIK3CA mutant cells. Growth induced by media conditioned by PIK3CA mutant cells was insensitive to PI3K inhibitors, suggesting that these secreted factors operate independent of cell-intrinsic PI3K signaling. In addition, the cooperation between two secreted factors, fibronectin and AREG, in the induction of proliferation and ERK activation suggests that ECM molecules induced by mutant PIK3CA play a causative role in proliferation induced by growth factors such as AREG. This is consistent with other studies in which fibronectin and growth factors cooperate to induce activation of ERK and cell cycle entry (36) or in which AREG stimulates fibronectin expression (37). Because matrix stiffening by ECM crosslinking is itself tumor promoting (38), we speculate that the up-regulation of ECM molecules and the matrix crosslinking enzyme PXDN (39) are novel mechanisms of tumor promotion by mutant PIK3CA. Indeed, knockdown of some of these components, including laminins, THBS1 and PXDN, hindered the proliferation of PIK3CA mutant MCF10A and BLBC cell lines. PI3K activation was associated with increased exosome secretion, which could be because of the promotion of actin cytoskeletal rearrangements, such as invadopodia formation by PI3K lipid products (30, 40). A phosphoproteomic and signaling network analysis of PIK3CA mutant MCF10A cells revealed novel substrates of Akt1, including cortactin, which was an important substrate for the enhanced migration induced by PIK3CA mutation (41). Because of the role of cortactin in invadopodia formation (42), and the association with invadopodia formation and exosome secretion (30), we speculate that the activation of cortactin in PIK3CA mutant cells was likely a critical aspect of the increased exosome secretion which we observed. Most of the secreted proteins identified in our LC-MS/MS analysis, including EGFR ligands and ECM molecules, were contained on exosomes, suggesting that a concerted secretion-proliferation/invasion program involving exosomes is induced by PIK3CA mutations.
The overexpression of EGFR in BLBC has been reported previously and our results suggest novel mechanisms by which EGFR is activated in BLBC with aberrant PI3K activity. Indeed, analysis of breast cancers performed by TCGA revealed that the basal-like subtype has the highest level of PI3K activity as inferred from RNA, protein and pathway activation scores (1). Further, PTPRF expression was markedly reduced in PIK3CA mutant cells and shRNA-mediated knockdown of PTPRF in PIK3CA WT cells resulted in EGFR activation as measured by P-EGFR levels. These results are consistent with studies showing an association between overexpression of miR-24, which down-regulates PTPRF, and concurrently enhanced EGFR activity (43). Laminin γ2, upregulated by PIK3CA mutation, can be cleaved extracellularly, releasing EGF-like motifs also capable of activating EGFR (44), suggesting another potential mechanism by which EGFR-dependent proliferation could occur in PIK3CA mutant cells. Thus, multiple proteomic consequences of PIK3CA mutation (up-regulation of AREG, laminin γ2, and fibronectin and down-regulation of the PTPRF phosphatase) may all cooperate in the induction of EGFR/ERK signaling.
AREG overexpression was a mechanism by which PIK3CA mutant MCF10A cells induced EGFR activity and proliferation. Because activation of the oncogenic YAP transcription factor in MCF10A cells has been shown to induce AREG and paracrine proliferation (27), we examined whether induction of AREG was a “generic” mechanism by which cancer lesions activate growth factor-independent growth of MCF10A cells. However, HRAS mutant MCF10AT1 cells, which grow in the absence of exogenous growth factors, secreted far less AREG than PIK3CA mutant cells, were insensitive to AREG blockade and were unable to induce paracrine growth of WT cells. These results suggest not all oncogenes use AREG for growth factor-independent proliferation. High AREG mRNA levels in a breast cancer cell line gene expression data set (4) and AREG protein measured by ELISA (supplemental Fig. S3B–S3C) correlated with PIK3CA mutation status. In addition, MCF7, T47D, BT20, and SUM102 PIK3CA mutant cells, exhibited PI3K-dependent AREG expression, as has been reported in RT4 bladder cancer cells (45). Our analysis of TCGA data and previous studies (18) categorize AREG as a nonbasal EGFR ligand, however, our ELISA data showed that AREG is also expressed in BLBC cells. Additionally, of the cell lines with highest levels of AREG mRNA, over half are basal-like, and the two cell lines with highest levels of AREG, SUM149, and HCC1954, are both basal-like and PTEN-deficient or PIK3CA mutant, respectively (4, 46). Further, SUM149 cells are dependent on AREG for proliferation in the absence of exogenous growth factors (47), similar to PIK3CA mutant MCF10A cells. Therefore, AREG appears to be a growth factor induced by PI3K activity in both luminal and basal-like cells as suggested by Kappler and colleagues (37).
Because EGFR is overexpressed in a cohort of TNBC, the majority of which exhibit basal-like gene expression, clinical trials of chemotherapy plus the EGFR antibody cetuximab have been conducted in patients with TNBC. In a randomized trial of cisplatin ± the EGFR antibody cetuximab, the combination induced a doubling of the overall clinical response rate compared with cisplatin alone (32). The modest clinical activity of EGFR inhibitors suggests the need of predictive biomarkers for patient selection, understanding mechanisms of EGFR pathway activation in TNBC and identification of the best combination of targeted therapies.
The results shown herein suggest that AREG is induced upon transformation by PIK3CA mutations, which can be reversed with inhibition of p110α. In addition, PIK3CA mutant BLBC cells and mouse transgenic basal-like mammary tumors driven by PIK3CAH1047R were sensitive to EGFR inhibition, suggesting that oncogenic activation of PIK3CA relies, in part, upon EGFR. We recognize, however, that in breast tumors with PI3K mutations, mutant PIK3CA is probably a more dominant oncogene and also a therapeutic target. Importantly, treatment with PI3K pathway inhibitors induces feedback up-regulation of several RTKs including the EGFR family (48–50). This compensatory up-regulation of RTKs limits the antitumor effect of PI3K inhibitors. Thus, we posit that the antitumor action of PI3K inhibitors in BLBC with PI3K mutations should be enhanced by cotreatment with EGFR inhibitors. This combination should blunt the feed-forward activation of AREG caused by aberrant PI3K activation described herein and the reactivation of RTKs that follows the inhibition of PI3K with targeted therapies.
Our studies have revealed pathways activated by mutant PIK3CA in BLBC which bear prognostic and therapeutic implications. The suite of proteins induced by mutant PIK3CA and identified by LC-MS/MS are associated with a poor prognosis in patients with BLBC and their down-regulation by siRNA reduced the proliferation of BLBC cell lines, suggesting these proteins as both markers of BLBC virulence and potential drug targets. The induction of AREG/EGFR by mutant PIK3CA and the evidence of clinical response to anti-EGFR therapies in patients with PIK3CA mutant BLBC warrant the inclusion of EGFR inhibitors in combination therapies against BLBC mutations in the PI3K pathway.
Supplementary Material
Acknowledgments
We thank Dr. Robbert Slebos for his assistance with uploading mass spectrometry data to MassIVE.
Footnotes
Author contributions: C.D.Y., L.J.Z., D.H., T.S., C.M.P., A.M.W., J.A.O., J.C.C., D.C.L., R.S.C., and C.L.A. designed research; C.D.Y., L.J.Z., D.H., L.F., A.B.H., M.L.G., M.M.M., P.D.M., C.A.W., B.D., T.S., N.E.B., G.O.S., P.P., M.L., and M.H. performed research; C.D.Y., L.J.Z., D.H., A.B.H., B.D., T.S., D.M.B., N.A.P., K.W., P.J.S., C.M.P., A.M.W., J.A.O., J.C.C., B.H.P., D.C.L., and C.L.A. contributed new reagents or analytic tools; C.D.Y., L.J.Z., D.H., L.F., A.B.H., M.L.G., M.M.M., B.D., T.S., G.O.S., J.A.O., J.C.C., D.C.L., R.S.C., and C.L.A. analyzed data; C.D.Y., L.J.Z., A.M.W., J.A.O., D.C.L., R.S.C., and C.L.A. wrote the paper.
* This work is supported by Breast Cancer Specialized Program of Research Excellence (SPORE) grant P50 CA098131, Vanderbilt-Ingram Cancer Center Support grant P30 CA68485, a Breast Cancer Research Foundation grant (CLA), Susan G. Komen for the Cure Foundation grant SAC100013 (CLA), NIH R01 CA143126 (RSC), R01 CA163592 (AMW), DOD postdoctoral fellowship grants W81XWH-12-1-0026 (CDY) and W81XWH-11-1-0751 (ABH), and NIH/NCI K12 CA090625 (ABH). PhD fellowship supported by “Terapie Avanzate Biomediche e Chirurgiche” University of Naples (LF).
 This article contains supplemental Figs. S1 to S6 and Tables S1 to S5.
1 The abbreviations used are:
- PIK3CA
- Gene encoding the p110α catalytic subunit of phosphatidylinositide-3 kinase
- AREG
- Amphiregulin
- BLBC
- Basal like breast cancer
- ECM
- Extracellular matrix
- EGFR
- Epidermal growth factor receptor
- EREG
- Epiregulin
- ERK
- Extracellular signal-regulated kinase
- GFP
- Green fluorescent protein
- HB-EGF
- Heparin-binding epidermal growth factor
- HER2
- Human epidermal growth factor receptor 2
- MEC
- Mammary epithelial cell
- MEK
- Mitogen/Extracellular signal-regulated kinase
- NGS
- Next generation sequencing
- PI3K
- Phosphoinositide 3-kinase
- PTPRF
- Receptor tyrosine phosphatase F
- PXDN
- Peroxidasin
- RFS
- Relapse-free survival
- RPPA
- Reverse phase protein array
- RTK
- Receptor tyrosine kinase
- TCGA
- The cancer genome atlas
- TGM2
- Tissue transglutaminase
- THBS1
- Thrombospondin 1
- WT
- Wild type.
REFERENCES
- 1. TCGA (2012) Comprehensive molecular portraits of human breast tumours. Nature 490, 61–70 [DOI] [PMC free article] [PubMed] [Google Scholar]
- 2. Debnath J., Brugge J. S. (2005) Modeling glandular epithelial cancers in three-dimensional cultures. Nat. Rev. Cancer 5, 675–688 [DOI] [PubMed] [Google Scholar]
- 3. Gustin J. P., Karakas B., Weiss M. B., Abukhdeir A. M., Lauring J., Garay J. P., Cosgrove D., Tamaki A., Konishi H., Konishi Y., Mohseni M., Wang G., Rosen D. M., Denmeade S. R., Higgins M. J., Vitolo M. I., Bachman K. E., Park B. H. (2009) Knockin of mutant PIK3CA activates multiple oncogenic pathways. Proc. Natl. Acad. Sci. U.S.A. 106, 2835–2840 [DOI] [PMC free article] [PubMed] [Google Scholar]
- 4. Neve R. M., Chin K., Fridlyand J., Yeh J., Baehner F. L., Fevr T., Clark L., Bayani N., Coppe J. P., Tong F., Speed T., Spellman P. T., DeVries S., Lapuk A., Wang N. J., Kuo W. L., Stilwell J. L., Pinkel D., Albertson D. G., Waldman F. M., McCormick F., Dickson R. B., Johnson M. D., Lippman M., Ethier S., Gazdar A., Gray J. W. (2006) A collection of breast cancer cell lines for the study of functionally distinct cancer subtypes. Cancer Cell 10, 515–527 [DOI] [PMC free article] [PubMed] [Google Scholar]
- 5. Wang H., Qian W. J., Mottaz H. M., Clauss T. R., Anderson D. J., Moore R. J., Camp D. G., 2nd, Khan A. H., Sforza D. M., Pallavicini M., Smith D. J., Smith R. D. (2005) Development and evaluation of a micro- and nanoscale proteomic sample preparation method. J. Proteome Res. 4, 2397–2403 [DOI] [PMC free article] [PubMed] [Google Scholar]
- 6. Cargile B. J., Sevinsky J. R., Essader A. S., Stephenson J. L., Jr., Bundy J. L. (2005) Immobilized pH gradient isoelectric focusing as a first-dimension separation in shotgun proteomics. J. Biomol. Techn. 16, 181–189 [PMC free article] [PubMed] [Google Scholar]
- 7. Ma Z. Q., Tabb D. L., Burden J., Chambers M. C., Cox M. B., Cantrell M. J., Ham A. J., Litton M. D., Oreto M. R., Schultz W. C., Sobecki S. M., Tsui T. Y., Wernke G. R., Liebler D. C. (2011) Supporting tool suite for production proteomics. Bioinformatics 27, 3214–3215 [DOI] [PMC free article] [PubMed] [Google Scholar]
- 8. Tabb D. L., Fernando C. G., Chambers M. C. (2007) MyriMatch: highly accurate tandem mass spectral peptide identification by multivariate hypergeometric analysis. J. Proteome Res. 6, 654–661 [DOI] [PMC free article] [PubMed] [Google Scholar]
- 9. Zhang B., Chambers M. C., Tabb D. L. (2007) Proteomic parsimony through bipartite graph analysis improves accuracy and transparency. J. Proteome Res. 6, 3549–3557 [DOI] [PMC free article] [PubMed] [Google Scholar]
- 10. Li M., Gray W., Zhang H., Chung C. H., Billheimer D., Yarbrough W. G., Liebler D. C., Shyr Y., Slebos R. J. (2010) Comparative shotgun proteomics using spectral count data and quasi-likelihood modeling. J. Proteome Res. 9, 4295–4305 [DOI] [PMC free article] [PubMed] [Google Scholar]
- 11. Liu P., Cheng H., Santiago S., Raeder M., Zhang F., Isabella A., Yang J., Semaan D. J., Chen C., Fox E. A., Gray N. S., Monahan J., Schlegel R., Beroukhim R., Mills G. B., Zhao J. J. (2011) Oncogenic PIK3CA-driven mammary tumors frequently recur via PI3K pathway-dependent and PI3K pathway-independent mechanisms. Nat. Med. 17, 1116–1120 [DOI] [PMC free article] [PubMed] [Google Scholar]
- 12. Hanker A. B., Pfefferle A. D., Balko J. M., Kuba M. G., Young C. D., Sanchez V., Sutton C. R., Cheng H., Perou C. M., Zhao J. J., Cook R. S., Arteaga C. L. (2013) Mutant PIK3CA accelerates HER2-driven transgenic mammary tumors and induces resistance to combinations of antiHER2 therapies. Proc. Natl. Acad. Sci. U.S.A. 110, 14372–14377 [DOI] [PMC free article] [PubMed] [Google Scholar]
- 13. Wang S. E., Xiang B., Guix M., Olivares M. G., Parker J., Chung C. H., Pandiella A., Arteaga C. L. (2008) Transforming growth factor beta engages TACE and ErbB3 to activate phosphatidylinositol-3 kinase/Akt in ErbB2-overexpressing breast cancer and desensitizes cells to trastuzumab. Mol. Cell. Biol. 28, 5605–5620 [DOI] [PMC free article] [PubMed] [Google Scholar]
- 14. Wang X., Spandidos A., Wang H., Seed B. (2012) PrimerBank: a PCR primer database for quantitative gene expression analysis, 2012 update. Nucleic Acids Res. 40, D1144–1149 [DOI] [PMC free article] [PubMed] [Google Scholar]
- 15. Chang J. T., Nevins J. R. (2006) GATHER: a systems approach to interpreting genomic signatures. Bioinformatics 22, 2926–2933 [DOI] [PubMed] [Google Scholar]
- 16. Gyorffy B., Lanczky A., Eklund A. C., Denkert C., Budczies J., Li Q., Szallasi Z. (2010) An online survival analysis tool to rapidly assess the effect of 22,277 genes on breast cancer prognosis using microarray data of 1809 patients. Breast Cancer Res. Treat. 123, 725–731 [DOI] [PubMed] [Google Scholar]
- 17. Gatza M. L., Lucas J. E., Barry W. T., Kim J. W., Wang Q., Crawford M. D., Datto M. B., Kelley M., Mathey-Prevot B., Potti A., Nevins J. R. (2010) A pathway-based classification of human breast cancer. Proc. Natl. Acad. Sci. U.S.A. 107, 6994–6999 [DOI] [PMC free article] [PubMed] [Google Scholar]
- 18. Hoadley K. A., Weigman V. J., Fan C., Sawyer L. R., He X., Troester M. A., Sartor C. I., Rieger-House T., Bernard P. S., Carey L. A., Perou C. M. (2007) EGFR associated expression profiles vary with breast tumor subtype. BMC Genomics 8, 258. [DOI] [PMC free article] [PubMed] [Google Scholar]
- 19. Hoadley K. A., Yau C., Wolf D. M., Cherniack A. D., Tamborero D., Ng S., Leiserson M. D., Niu B., McLellan M. D., Uzunangelov V., Zhang J., Kandoth C., Akbani R., Shen H., Omberg L., Chu A., Margolin A. A., Van't Veer L. J., Lopez-Bigas N., Laird P. W., Raphael B. J., Ding L., Robertson A. G., Byers L. A., Mills G. B., Weinstein J. N., Van Waes C., Chen Z., Collisson E. A., Benz C. C., Perou C. M., Stuart J. M. (2014) Multiplatform analysis of 12 cancer types reveals molecular classification within and across tissues of origin. Cell 158, 929–944 [DOI] [PMC free article] [PubMed] [Google Scholar]
- 20. Dave B., Granados-Principal S., Zhu R., Benz S., Rabizadeh S., Soon-Shiong P., Yu K., Shao Z., Li X., Gilcrease M., Lai Z., Chen Y., Huang T. H., Shen H., Liu X., Ferrari M., Zhan M., Wong S. T., Kumaraswami M., Mittal V., Chen X., Gross S. S., Chang J. C. (2014) Targeting RPL39 and MLF2 reduce tumor initiation and metastasis in breast cancer by inhibiting nitric oxide synthase signaling. Proc. Natl. Acad. Sci. U.S.A. 111, 8838–8843 [DOI] [PMC free article] [PubMed] [Google Scholar]
- 21. Frampton G. M., Fichtenholtz A., Otto G. A., Wang K., Downing S. R., He J., Schnall-Levin M., White J., Sanford E. M., An P., Sun J., Juhn F., Brennan K., Iwanik K., Maillet A., Buell J., White E., Zhao M., Balasubramanian S., Terzic S., Richards T., Banning V., Garcia L., Mahoney K., Zwirko Z., Donahue A., Beltran H., Mosquera J. M., Rubin M. A., Dogan S., Hedvat C. V., Berger M. F., Pusztai L., Lechner M., Boshoff C., Jarosz M., Vietz C., Parker A., Miller V. A., Ross J. S., Curran J., Cronin M. T., Stephens P. J., Lipson D., Yelensky R. (2013) Development and validation of a clinical cancer genomic profiling test based on massively parallel DNA sequencing. Nat. Biotechnol. 31, 1023–1031 [DOI] [PMC free article] [PubMed] [Google Scholar]
- 22. Lipson D., Capelletti M., Yelensky R., Otto G., Parker A., Jarosz M., Curran J. A., Balasubramanian S., Bloom T., Brennan K. W., Donahue A., Downing S. R., Frampton G. M., Garcia L., Juhn F., Mitchell K. C., White E., White J., Zwirko Z., Peretz T., Nechushtan H., Soussan-Gutman L., Kim J., Sasaki H., Kim H. R., Park S. I., Ercan D., Sheehan C. E., Ross J. S., Cronin M. T., Janne P. A., Stephens P. J. (2012) Identification of new ALK and RET gene fusions from colorectal and lung cancer biopsies. Nat. Med. 18, 382–384 [DOI] [PMC free article] [PubMed] [Google Scholar]
- 23. Soule H. D., Maloney T. M., Wolman S. R., Peterson W. D., Jr., Brenz R., McGrath C. M., Russo J., Pauley R. J., Jones R. F., Brooks S. C. (1990) Isolation and characterization of a spontaneously immortalized human breast epithelial cell line, MCF-10. Cancer Res. 50, 6075–6086 [PubMed] [Google Scholar]
- 24. Yeh T. C., Marsh V., Bernat B. A., Ballard J., Colwell H., Evans R. J., Parry J., Smith D., Brandhuber B. J., Gross S., Marlow A., Hurley B., Lyssikatos J., Lee P. A., Winkler J. D., Koch K., Wallace E. (2007) Biological characterization of ARRY-142886 (AZD6244), a potent, highly selective mitogen-activated protein kinase kinase 1/2 inhibitor. Clin. Cancer Res. 13, 1576–1583 [DOI] [PubMed] [Google Scholar]
- 25. Fritsch C., Huang A., Chatenay-Rivauday C., Schnell C., Reddy A., Liu M., Kauffmann A., Guthy D., Erdmann D., De Pover A., Furet P., Gao H., Ferretti S., Wang Y., Trappe J., Brachmann S. M., Maira S. M., Wilson C., Boehm M., Garcia-Echeverria C., Chene P., Wiesmann M., Cozens R., Lehar J., Schlegel R., Caravatti G., Hofmann F., Sellers W. R. (2014) Characterization of the novel and specific PI3Kalpha inhibitor NVP-BYL719 and development of the patient stratification strategy for clinical trials. Mol. Cancer Therapeut. 13, 1117–1129 [DOI] [PubMed] [Google Scholar]
- 26. Hirai H., Sootome H., Nakatsuru Y., Miyama K., Taguchi S., Tsujioka K., Ueno Y., Hatch H., Majumder P. K., Pan B. S., Kotani H. (2010) MK-2206, an allosteric Akt inhibitor, enhances antitumor efficacy by standard chemotherapeutic agents or molecular targeted drugs in vitro and in vivo. Mol. Cancer Therapeut. 9, 1956–1967 [DOI] [PubMed] [Google Scholar]
- 27. Zhang J., Ji J. Y., Yu M., Overholtzer M., Smolen G. A., Wang R., Brugge J. S., Dyson N. J., Haber D. A. (2009) YAP-dependent induction of amphiregulin identifies a noncell-autonomous component of the Hippo pathway. Nature cell biology 11, 1444–1450 [DOI] [PMC free article] [PubMed] [Google Scholar]
- 28. Higginbotham J. N., Demory Beckler M., Gephart J. D., Franklin J. L., Bogatcheva G., Kremers G. J., Piston D. W., Ayers G. D., McConnell R. E., Tyska M. J., Coffey R. J. (2011) Amphiregulin exosomes increase cancer cell invasion. Curr. Biol. 21, 779–786 [DOI] [PMC free article] [PubMed] [Google Scholar]
- 29. Thery C. (2011) Exosomes: secreted vesicles and intercellular communications. F1000 Biol. Rep. 3, 15. [DOI] [PMC free article] [PubMed] [Google Scholar]
- 30. Hoshino D., Kirkbride K. C., Costello K., Clark E. S., Sinha S., Grega-Larson N., Tyska M. J., Weaver A. M. (2013) Exosome secretion is enhanced by invadopodia and drives invasive behavior. Cell Rep. 5, 1159–1168 [DOI] [PMC free article] [PubMed] [Google Scholar]
- 31. Blobel C. P. (2005) ADAMs: key components in EGFR signalling and development. Nat. Rev. Mol. Cell Biol. 6, 32–43 [DOI] [PubMed] [Google Scholar]
- 32. Baselga J., Gomez P., Greil R., Braga S., Climent M. A., Wardley A. M., Kaufman B., Stemmer S. M., Pego A., Chan A., Goeminne J. C., Graas M. P., Kennedy M. J., Ciruelos Gil E. M., Schneeweiss A., Zubel A., Groos J., Melezinkova H., Awada A. (2013) Randomized phase II study of the anti-epidermal growth factor receptor monoclonal antibody cetuximab with cisplatin versus cisplatin alone in patients with metastatic triple-negative breast cancer. J. Clin. Oncol. 31, 2586–2592 [DOI] [PMC free article] [PubMed] [Google Scholar]
- 33. Gymnopoulos M., Elsliger M. A., Vogt P. K. (2007) Rare cancer-specific mutations in PIK3CA show gain of function. Proc. Natl. Acad. Sci. U.S.A. 104, 5569–5574 [DOI] [PMC free article] [PubMed] [Google Scholar]
- 34. Young C. D., Pfefferle A. D., Owens P., Kuba M. G., Rexer B. N., Balko J. M., Sanchez V., Cheng H., Perou C. M., Zhao J. J., Cook R. S., Arteaga C. L. (2013) Conditional loss of ErbB3 delays mammary gland hyperplasia induced by mutant PIK3CA without affecting mammary tumor latency, gene expression, or signaling. Cancer Res. 73, 4075–4085 [DOI] [PMC free article] [PubMed] [Google Scholar]
- 35. Hutti J. E., Pfefferle A. D., Russell S. C., Sircar M., Perou C. M., Baldwin A. S. (2012) Oncogenic PI3K mutations lead to NF-kappaB-dependent cytokine expression following growth factor deprivation. Cancer Res. 72, 3260–3269 [DOI] [PMC free article] [PubMed] [Google Scholar]
- 36. Roovers K., Davey G., Zhu X., Bottazzi M. E., Assoian R. K. (1999) Alpha5beta1 integrin controls cyclin D1 expression by sustaining mitogen-activated protein kinase activity in growth factor-treated cells. Mol. Biol. Cell 10, 3197–3204 [DOI] [PMC free article] [PubMed] [Google Scholar]
- 37. Kappler C. S., Guest S. T., Irish J. C., Garrett-Mayer E., Kratche Z., Wilson R. C., Ethier S. P. (2014) Oncogenic signaling in amphiregulin and EGFR-expressing PTEN-null human breast cancer. Molecular Oncology, 9, 527–543 [DOI] [PMC free article] [PubMed] [Google Scholar]
- 38. Levental K. R., Yu H., Kass L., Lakins J. N., Egeblad M., Erler J. T., Fong S. F., Csiszar K., Giaccia A., Weninger W., Yamauchi M., Gasser D. L., Weaver V. M. (2009) Matrix crosslinking forces tumor progression by enhancing integrin signaling. Cell 139, 891–906 [DOI] [PMC free article] [PubMed] [Google Scholar]
- 39. Bae Y. K., Kim A., Kim M. K., Choi J. E., Kang S. H., Lee S. J. (2013) Fibronectin expression in carcinoma cells correlates with tumor aggressiveness and poor clinical outcome in patients with invasive breast cancer. Human Pathol. 44, 2028–2037 [DOI] [PubMed] [Google Scholar]
- 40. Carey L. A., Rugo H. S., Marcom P. K., Mayer E. L., Esteva F. J., Ma C. X., Liu M. C., Storniolo A. M., Rimawi M. F., Forero-Torres A., Wolff A. C., Hobday T. J., Ivanova A., Chiu W. K., Ferraro M., Burrows E., Bernard P. S., Hoadley K. A., Perou C. M., Winer E. P. (2012) TBCRC 001: randomized phase II study of cetuximab in combination with carboplatin in stage IV triple-negative breast cancer. J. Clin. Oncol. 30, 2615–2623 [DOI] [PMC free article] [PubMed] [Google Scholar]
- 41. Wu X., Renuse S., Sahasrabuddhe N. A., Zahari M. S., Chaerkady R., Kim M. S., Nirujogi R. S., Mohseni M., Kumar P., Raju R., Zhong J., Yang J., Neiswinger J., Jeong J. S., Newman R., Powers M. A., Somani B. L., Gabrielson E., Sukumar S., Stearns V., Qian J., Zhu H., Vogelstein B., Park B. H., Pandey A. (2014) Activation of diverse signaling pathways by oncogenic PIK3CA mutations. Nat. Commun. 5, 4961. [DOI] [PMC free article] [PubMed] [Google Scholar]
- 42. Clark E. S., Whigham A. S., Yarbrough W. G., Weaver A. M. (2007) Cortactin is an essential regulator of matrix metalloproteinase secretion and extracellular matrix degradation in invadopodia. Cancer Res. 67, 4227–4235 [DOI] [PubMed] [Google Scholar]
- 43. Du W. W., Fang L., Li M., Yang X., Liang Y., Peng C., Qian W., O'Malley Y. Q., Askeland R. W., Sugg S. L., Qian J., Lin J., Jiang Z., Yee A. J., Sefton M., Deng Z., Shan S. W., Wang C. H., Yang B. B. (2013) MicroRNA miR-24 enhances tumor invasion and metastasis by targeting PTPN9 and PTPRF to promote EGF signaling. J. Cell Sci. 126, 1440–1453 [DOI] [PubMed] [Google Scholar]
- 44. Koshikawa N., Minegishi T., Sharabi A., Quaranta V., Seiki M. (2005) Membrane-type matrix metalloproteinase-1 (MT1-MMP) is a processing enzyme for human laminin gamma 2 chain. J. Biol. Chem. 280, 88–93 [DOI] [PubMed] [Google Scholar]
- 45. Ornskov D., Nexo E., Sorensen B. S. (2007) Insulin induces a transcriptional activation of epiregulin, HB-EGF and amphiregulin, by a PI3K-dependent mechanism: identification of a specific insulin-responsive promoter element. Biochem. Biophys. Res. Commun. 354, 885–891 [DOI] [PubMed] [Google Scholar]
- 46. Saal L. H., Gruvberger-Saal S. K., Persson C., Lovgren K., Jumppanen M., Staaf J., Jonsson G., Pires M. M., Maurer M., Holm K., Koujak S., Subramaniyam S., Vallon-Christersson J., Olsson H., Su T., Memeo L., Ludwig T., Ethier S. P., Krogh M., Szabolcs M., Murty V. V., Isola J., Hibshoosh H., Parsons R., Borg A. (2008) Recurrent gross mutations of the PTEN tumor suppressor gene in breast cancers with deficient DSB repair. Nat. Genet. 40, 102–107 [DOI] [PMC free article] [PubMed] [Google Scholar]
- 47. Willmarth N. E., Ethier S. P. (2006) Autocrine and juxtacrine effects of amphiregulin on the proliferative, invasive, and migratory properties of normal and neoplastic human mammary epithelial cells. J. Biol. Chem. 281, 37728–37737 [DOI] [PubMed] [Google Scholar]
- 48. Chandarlapaty S., Sawai A., Scaltriti M., Rodrik-Outmezguine V., Grbovic-Huezo O., Serra V., Majumder P. K., Baselga J., Rosen N. (2011) AKT inhibition relieves feedback suppression of receptor tyrosine kinase expression and activity. Cancer Cell 19, 58–71 [DOI] [PMC free article] [PubMed] [Google Scholar]
- 49. Chakrabarty A., Sanchez V., Kuba M. G., Rinehart C., Arteaga C. L. (2011) Breast Cancer Special Feature: Feedback upregulation of HER3 (ErbB3) expression and activity attenuates antitumor effect of PI3K inhibitors. Proc. Natl. Acad. Sci. U.S.A. 109, 2718–2723 [DOI] [PMC free article] [PubMed] [Google Scholar]
- 50. Fox E. M., Kuba M. G., Miller T. W., Davies B. R., Arteaga C. L. (2013) Autocrine IGF-I/insulin receptor axis compensates for inhibition of AKT in ER-positive breast cancer cells with resistance to estrogen deprivation. Breast Cancer Res. 15, R55. [DOI] [PMC free article] [PubMed] [Google Scholar]
Associated Data
This section collects any data citations, data availability statements, or supplementary materials included in this article.