Abstract
Purpose
To design and evaluate a new reduced scan time 3D FLuid Attenuated Inversion Recovery (FLAIR) sequence.
Materials and Methods
The 3D FLAIR sequence was modified so that the repetition time was modulated in a predetermined smooth fashion (3D mFLAIR). Inversion times were adjusted accordingly to maintain CSF suppression. Simulations were performed to determine SNR for gray matter (GM), white matter (WM) and CSF. Fourteen volunteers were imaged using the modified and product sequence. SNR measurements were performed in GM, WM and CSF. Mean value and the 95% confidence interval ([CI]) were assessed. Scan time for the 3D FLAIR and 3D mFLAIR sequences was measured.
Results
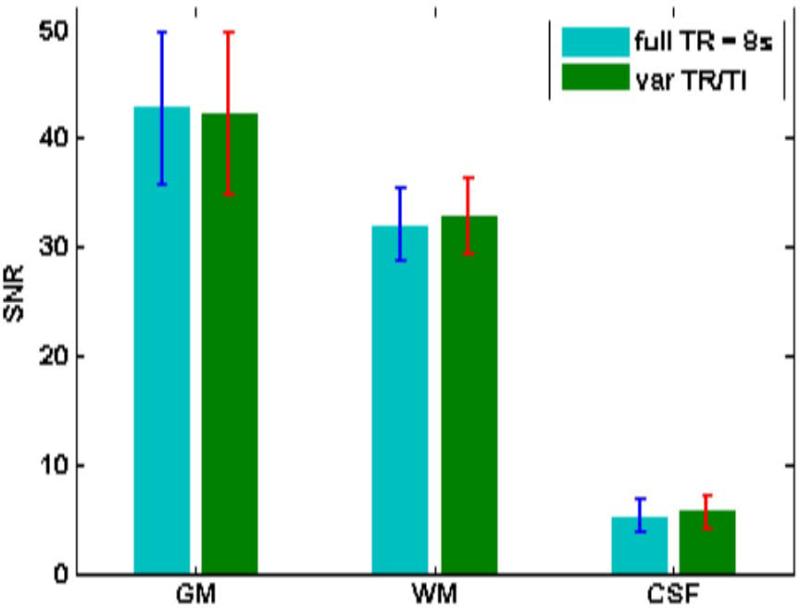
There was no statistically significant difference in the SNR measured in GM (P value = 0.5; mean SNR = 42.8 [CI]: 38.2-45.5 vs 42.2 [CI]: 38.3-46.1 for 3D FLAIR and 3D mFLAIR, respectively) and WM (P value = 0.25; mean SNR = 32.1 [CI]: 30.3-33.8 vs 32.9 [CI]: 31.1-34.7). Scan time reduction greater than 30% was achieved for the given parameter set with the 3D mFLAIR sequence.
Conclusion
Scan time for 3D FLAIR can be effectively reduced by modulating repetition and inversion time in a predetermined fashion while maintaining the SNR and CNR of a constant TR sequence.
Keywords: 3D FLAIR, modulated repetition time, modulated inversion time, scan time reduction, variable repetition time
INTRODUCTION
Fluid Attenuated Inversion Recovery (FLAIR) sequence is a frequently used sequence for detecting and diagnosing diseases of the central nervous system. By suppressing CSF and acquiring a T2 weighted image, lesions in grey and white matter can be seen as easily detectable signal hyperintensities (1,2). Furthermore, CSF flow artifacts are heavily attenuated and do not impact image quality in and around the ventricles, sulci and cisterna magna.
Conventional Fluid Attenuated Inversion Recovery (FLAIR) acquires multiple 2D slices and requires extended scan times. More recently, traditional FLAIR imaging has undergone rapid progress so that 3D imaging of the entire brain using an extended modulated refocusing pulse train is possible within a clinically reasonable time (3). The underlying 3D fast spin echo sequences go by names like VISTA (Philips), SPACE (Siemens) or CUBE (GE). These sequences use smaller refocusing angles which leads to increased effective T1 time and reduced SAR deposition making long refocusing trains possible. However, T1 weighting is increased while T2 weighting is reduced in such sequences. To counter this effect, magnetization can be prepared with T2 weighting pre-pulses (4). Isotropic high resolution 3D FLAIR with adequate SNR still requires the use of a relatively long repetition time (~8s) to allow adequate signal recovery.
The 3D FLAIR acquisition has an effective scan time of one repetition time per slice encoding step when ky is acquired in a non-segmented fashion. The scan time increases with increasing number of segments/shots as well as acquired slices. To reduce scan time, TRseq can be modulated from TRmin to TRmax along slice encoding using a predefined smooth function. (All shots for a particular slice encoding step would use the same TRmin ≤ TR ≤ TRmax.) Similar to the effective inversion time or an effective echo time being defined to the center of ky space, an effective repetition time can be defined for the center of kz space. Thus the center of 3D k-space sees a TR corresponding to full recovery of the inverted magnetization. A similar technique was previously used to reduce scan time for an inversion recovery Look Locker T1 mapping technique (5).
In this work, we evaluate a 3D FLAIR sequence where the repetition time (TR) and inversion time (TI) are both modified in a predetermined fashion. We compare this sequence with the unmodified version with full repetition time by measuring SNR in GM, WM and CSF. The scan time reduction resulting from the modulation was also measured.
MATERIALS AND METHODS
Motivation
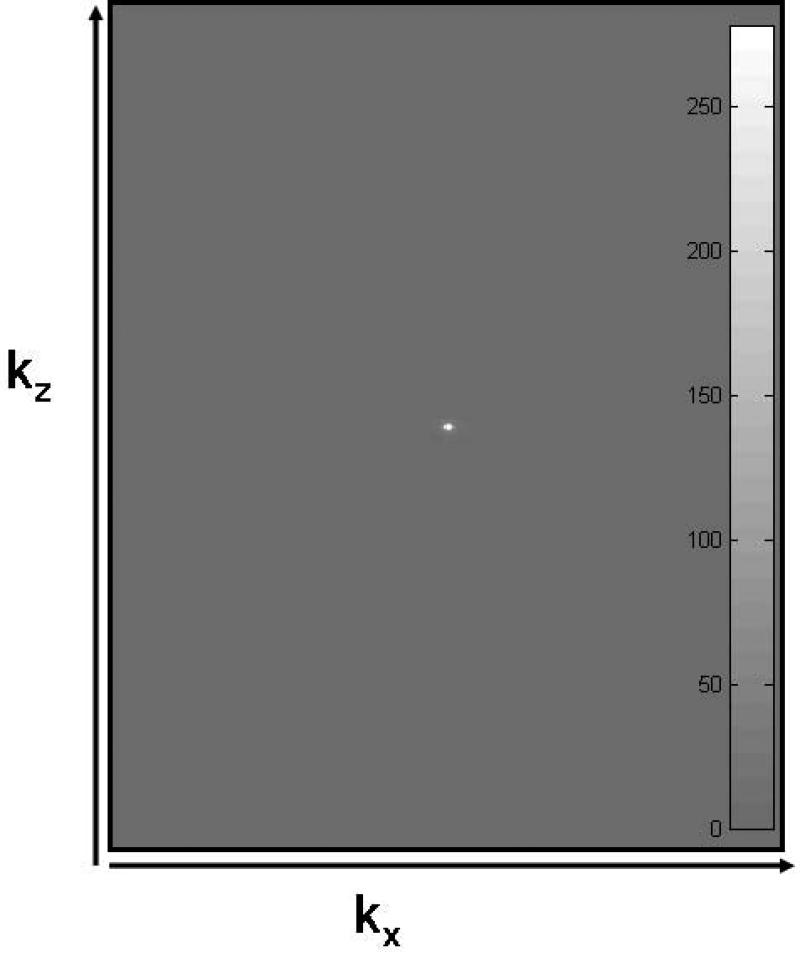
As discussed in the introduction above, the SNR and CNR of an image is captured mainly by data at the center of k-space. Figure 1 shows the signal in ky-kz space (after performing a maximum intensity projection along kx) of a 3D FLAIR data set of the human brain acquired with 321 slices. As can be easily seen, an overwhelming majority of the signal is confined close to the center of k-space. Thus by maintaining a full TR near the center and reducing the TR towards the edge of k-space, scan time can be reduced without appreciably affecting SNR and CNR of the image set.
Figure 1.
k-space data (absolute value) of a 321 slice acquisition of a human brain using a 3D FLAIR sequence. (Data along ky was MIPed to project the data in two dimensions.) kx has 256 steps while kz has 321 overcontiguous steps. Embedded gray scale bar shows that the window was adjusted to accomodate the entire range of data values (≥ 0).
Sequence design
The 3D FLAIR sequence was modified by varying the TR in a predetermined smooth fashion from TRmin to TRmax (both user defined) over the kz encoding space using a four term Blackman-Harris (B-H) window. Blackman-Harris is a good general purpose window that is easy to implement and shows a favorable response in the transformed (image) domain. The four term B-H window is given as (5):
| [1] |
where a1 = 0. 35875, a2 = 0.48829, a3 = 0.14128, a4 = 0.01168 and n = 0, .., N–1. Each repetition time begins with a T2 preparation scheme which consists of non-selective excitation (90°) and 180° refocusing pulses followed by a –90° pulse to restore transverse magnetization to the +z direction (Figure 2). Such a scheme results in Mxy (transverse magnetization) ≈ 0 for gray matter and white matter (if T2 Prep duration >> T2GM,WM) while CSF undergoes barely any decay (since T2CSF >> T2 Prep duration). As a result, restored longitudinal magnetization for CSF ≈ 1 while restored Mz for GM and WM << 1 after the –90° pulse. The inversion pulse following the magnetization preparation sequence inverts the CSF magnetization while GM and WM magnetization recover mostly along the saturation recovery curve, independent of the inversion pulse. This is followed by the turbo spin-echo acquisition train and dead time during which Mz recovers. To allow for sufficient recovery of brain tissue Mz, a TR on the order of 8 seconds is typically used, resulting in a relatively long scan time. Therefore, we introduced a modulation of the dead-time, so that the TR of each shot varies from a shorter TR (e.g. 2.9s) at the edges of kz-space to a long TR (e.g. 8s) at the center of kz space. Thus, the effective TR corresponds to full recovery of even long T1 species.
Figure 2.
Sequence diagram of the 3D FLAIR sequence. A preparation scheme introduces T2 weighting which is followed by inversion and the multi spin-echo low flip angle readout train. An optional fat saturation sequence can be introduced prior to the readout train.
Since TR varies with kz, the corresponding TI needs to be varied to correspond to the TR. This is calculated based on the equation for incomplete inversion recovery as (6)
| [2] |
In the above equation, Trecov is the time for recovery of the longitudinal magnetization. For the sequence used here, recovery time is reduced by the time spent by magnetization in the transverse plane. This recovery time is then given by (similar to (4))
| [3] |
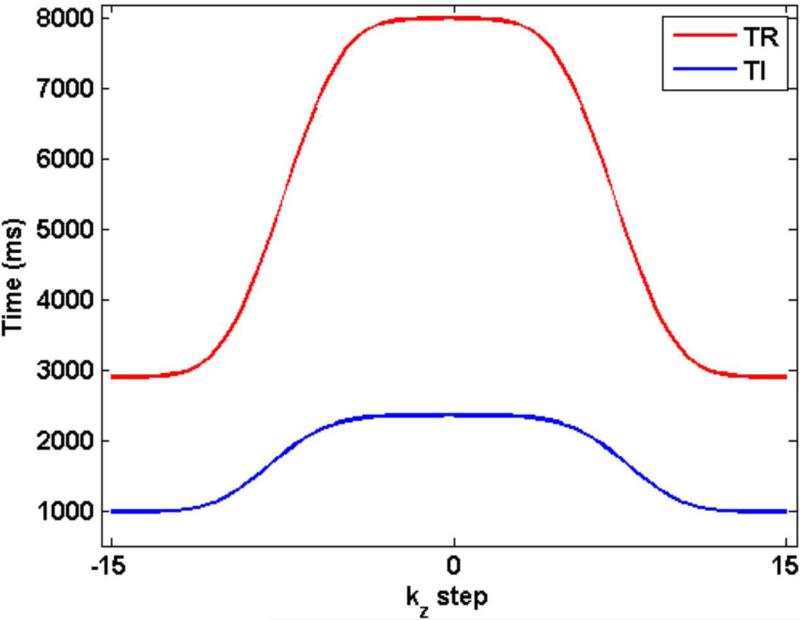
Figure 3 shows the variation in TR and TI as a function of the kz encoding step. While TR ranges from 2900 ms to 8000 ms, TI goes from 984 ms to 2357 ms.
Figure 3.
TR and TI are varied in a smooth manner based on the Blackman-Harris window. While TR varies from 2.9 s to 8 s, TI varies from 984 ms to 2357 ms.
Transverse magnetization for the sequence is given by
| [4] |
where
| [5] |
and
| [6] |
TEeff used in equation 4 reflects the effective echo time for the modulated RF train (7,8).
where Sr is the signal with T1 and T2 relaxation at refocusing pulse corresponding to the actual echo time while Spss is the pseudo steady state signal calculated at that pulse. Both signals are calculated using the extended phase graph (EPG) formulation of (9).
Note that longitudinal magnetization in equation 6 shows signal evolution akin to transverse magnetization. This is because transverse magnetization resulting from the 90° excitation pulse of the T2 preparation sequence undergoes decay based on T2 (due to the refocusing 180°s) before being restored to the longitudinal direction by the –90° pulse.
Simulations
Simulations were performed to determine magnetization in gray matter, white matter and CSF using [4]. Values for T1 of CSF, WM and GM were assumed to be 4680 ms (10), 830 ms and 1310 ms (5), respectively while T2 values in CSF, WM and GM were fixed at 2000 ms (11), 80 ms and 110 ms (12), respectively. First, the effect of TR and TI modulation on slab profile was checked. We considered the initial Mz = 1 for a slab containing 32 slices. Taking the Fourier transform provides the signal along kz. Transverse magnetization signal (eq. 4) was then calculated for the following cases: (a) full TR = 8 s, TI = 2.36 s (b) variable TR (using eq. 1) and variable TI (eq. 2). The signal so calculated was smoothed with a Tukey apodizing window (as is typically done prior to reconstruction) and Fourier transformed to produce the resultant slab profile for the transverse magnetization. The product 3D FLAIR sequence was altered by calculating TR values in real-time based on the four term B-H window and values for minimum TR and maximum TR. Corresponding TI were also calculated on the fly and stored in an array. Each kz encoding was then played out with the corresponding TI and TR.
A similar simulation was also carried out for the case which mimics the presence of a tiny hyperintense lesion in tissue by considering a 20% increase in signal intensity in just one pixel along the z direction.
Scanning
Fourteen volunteers were scanned on a Philips 3T scanner (Achieva TX, release 3.2.1) post IRB approval and informed consent after the nature of the procedure had been fully explained. For the tested 3D mFLAIR sequence, TR was modulated between TRmin = 2.9 s and TRmax = 8 s for a scan time of 2:41. The constant (full) TR comparison FLAIR sequence with matching contrast was specified with a TR of 8 s (identical to the TRmax of the 3D mFLAIR sequence) resulting in a scan time of 4:00; the corresponding TI for CSF suppression was 2357 ms. Other scan parameters were identical for the two sequences: FOV = 25 cm, TE ≈ 280-300 ms; TSE acquisition: echo spacing (esp) = 2.8-3 ms, single-shot ky echo train length (etl) = 182, min refocusing=18°, resolution ≈ 1 mm3, number of overcontiguous slices = 300-326, SENSE (ky, kz) = (2.6, 2); NSA = 1.
Measurement
In order to measure SNR reliably in the presence of parallel imaging, two sets of data were acquired for the two (3D FLAIR and 3D mFLAIR) sequences. The first set corresponded to the regular imaging set while the second set was played out exactly the same as the first set except all RF and gradients were turned off. SNR is then measured by placing ROIs in GM, WM and CSF to get the mean signal (S) from the first set while using the same ROIs in the “noise only” images gives the standard deviation of noise (δ).
In addition, two observers (NDG: 21 yrs MRI experience; JAB: 16 yrs MRI experience) scored images obtained from the two sequences for all 14 subjects based on a preference criterion. The two series were first stripped of all identifying parameters/markers and displayed in a random order for each subject. Native sagittal as well as reformatted coronal and axial slices were evaluated. An overall preference was determined for each set compared. Scoring was as follows: 0 = preference for 3D FLAIR over 3D mFLAIR; 1 = no perceptible difference between the two sets; 2 = 3D mFLAIR preferred over 3D FLAIR. (One hallmark of 3D imaging is that it eliminates slice to slice variation in image quality making overall assessment of image sets possible. In short, artifacts propagate through all slices unlike multislice 2D where variation in IQ can make an overall score difficult to assess.)
For all volunteer scans, the specific absorption rate as a percentage of maximum allowed in clinical mode was recorded. For the 3D mFLAIR sequence, the maximum SAR was calculated based on minimum TR while the average SAR was reflected using the mean TR. Similarly, the peripheral nerve stimulation was also recorded for the two sequences for all volunteers.
Scan time required for the two sequences post prescan was also measured using a stop watch.
Statistical analysis
All statistical analysis was performed in Matlab®. Paired Student's t-test was performed for SNR values in GM, WM and CSF between the two sequences to determine if the values were significantly different between images. A P value less than 0.05 was considered significant.
RESULTS
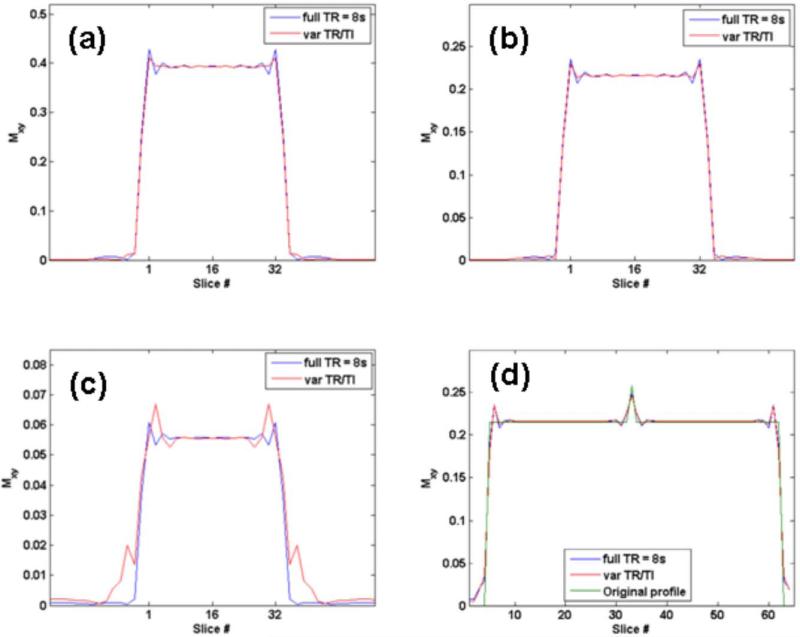
Figure 4 (a), (b) and (c) shows the simulated transverse magnetization along z for gray matter, white matter and CSF for the two sequences. Table 1 gives transverse magnetization values obtained for the two sequences for GM, WM and CSF. 3D mFLAIR with variable TR and variable TI performs as well as the full TR sequence but with reduced scan time. Figure 4(d) shows the original assumed profile and the profiles obtained after simulation for 3D FLAIR and 3D mFLAIR. The figure confirms that lesion conspicuity is maintained even after the modulation scheme.
Figure 4.
Change in slab profile for (a) gray matter (b) white matter and (c) CSF obtained with the two different 3D FLAIR implementations using full TR = 8s and variable TR and TI. Figure 4(d) shows the simulated case of a hyperintense (20% higher) signal in a single pixel (pixel 33) in white matter along the z direction. Equally good conspicuity for 3D FLAIR and 3D mFLAIR sequence can be seen. The original profile is also shown.
Table 1.
Simulated signal in GM, WM and CSF for the two sequences (a) full TR = 8s and (b) varying TR and TI sequence.
| Full TR = 8s | Var TR/TI | |
|---|---|---|
| GM | 0.3131 | 0.3129 |
| WM | 0.1722 | 0.1722 |
| CSF | 0.0443 | 0.0445 |
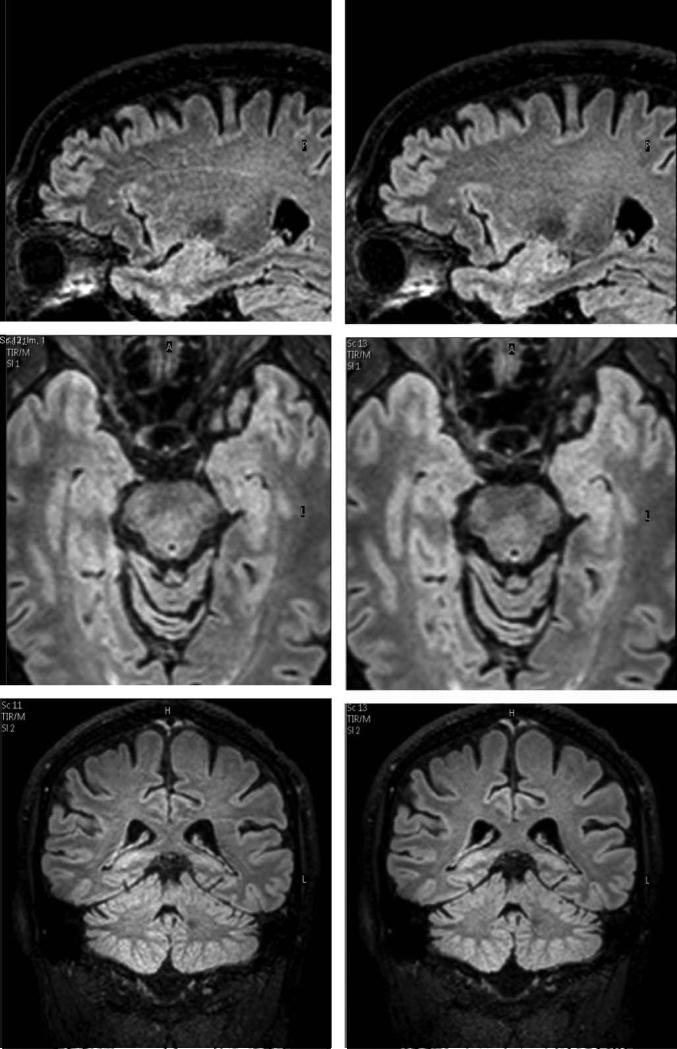
Figure 5 shows sample sagittal slices and reformatted transverse and coronal slices obtained with the two sequences. Figure 6 shows the measured mean SNR for WM, GM and CSF for the 14 volunteers with the two sequences. Table 2 provides the values and the percentage change between the two sequences. SNRs measured with the two sequences for GM, WM and CSF showed no statistically significant difference in SNR for GM and WM. P value was 0.5 for GM and [CI] for SNR was 38.2-45.5 for 3D FLAIR and SNR [CI] was 38.3-46.1 for 3D mFLAIR. For WM, P value = 0.25 while SNR [CI] was 30.3-33.8 for 3D FLAIR and 31.1-34.7 for 3D mFLAIR). SNR in CSF was statistically significant (P value = 0.032); [CI]: 4.4-6.1 and 4.9-6.5 for 3D FLAIR and 3D mFLAIR, respectively. Measured values follow predicted trends from simulations whereby SNR in GM and WM do not show any significant change for the 3D mFLAIR sequence (compared to the constant TR = 8s sequence) with measured GM and WM SNR showing a reduction of < 3% for 3D mFLAIR images. The CSF signal was elevated by about 9.9% for 3D mFLAIR compared with the full TR sequence. However, this is from a lower SNR base of just 5.1.
Figure 5.
Native sagittal slices and reformatted axial and coronal images for the full TR 3D FLAIR sequence (left) and the varying TR and TI, 3D mFLAIR sequence (right). Scan time for 3D mFLAIR sequence (2:50) was 33% lower than 3D FLAIR (4:16). Window/level was the same for all images.
Figure 6.
Mean SNR (and std) measured in GM, WM and CSF for (a) full TR = 8s and (b) 3D mFLAIR.
Table 2.
Mean SNR values (from 14 volunteers) measured in GM, WM and CSF for the two sequences : (a) full TR = 8s and (b) varying TR and varying TI sequence. P-values obtained using a paired Student's t-test between images from 3D FLAIR and 3D mFLAIR are provided in the third column.
| Full TR = 8s | Var TR/TI (% change) | Paired Student's t-test p-value | |
|---|---|---|---|
| GM | 42.8 | 42.2 | 0.5 |
| –1.5 | |||
| WM | 32.1 | 32.9 | 0.25 |
| 2.8 | |||
| CSF | 5.1 | 5.7 | 0.03 |
| 9.9 |
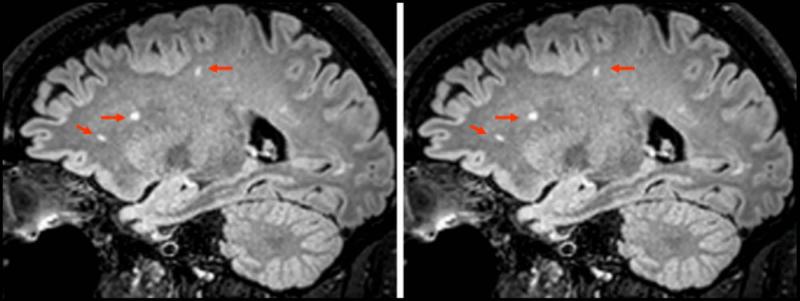
Subjective assessment of images by the two observers provided a mean score of 1.21 for both observers. In 11 subjects, both sets of images were deemed equivalent (score = 1) while for 3 subjects, both observers rated the 3D mFLAIR images to be superior to the 3D FLAIR images (score = 2) which were corrupted by motion artifacts. Furthermore, three subjects had benign WM lesions and lesion conspicuity was equivalent for both sequences. Figure 7 shows one such example of lesion conspicuity for the two sequences.
Figure 7.
Three subjects exhibited benign white matter lesions. One comparison image from 3D FLAIR and 3D mFLAIR is shown. No perceptible difference in lesion conspicuity was noticed between the two implementations although scan time for 3D mFLAIR was 2:56 compared with 4:24 for 3D FLAIR resulting in a 33% reduction in scan time.
For the scans performed, the specific absorption rate (SAR) and peripheral nerve stimulation (PNS) were always within FDA approved limits. Average SAR for 3D FLAIR sequence was ≤ 9% of maximum (clinical mode) while average SAR for 3D mFLAIR was ≤13% in all cases. Maximum SAR never exceeded 26% of SAR allowed in clinical mode (limit of 3.2 W/kg in head) for any subject. Since the gradients did not change between the two sequences, PNS recorded was the same for the two sequences and did not exceed 80% of the allowed in normal mode.
Scan time reduction achieved was greater than 30% in all cases.
DISCUSSION
A new technique for reducing scan time while maintaining SNR and contrast with 3D FLAIR is described. Savings in scan time will be proportional to the TR used, so that a longer TR with greater dead time is even more conducive to the technique. Note that the scheme can be typically employed with 3D imaging as it relies on the fact that the signal near the center of k-space determines SNR and contrast. Furthermore, modulation of the repetition time is symmetric (or near symmetric) about the center of k-space implying that the chosen direction (kz) is not partially Fourier encoded as can be done along the phase encoding (ky) direction in conjunction with homodyne reconstruction. This is typically true of SENSE along kz. Note that our modulation scheme works with and without the use of SENSE along the slice encoding direction.
SAR was a non-factor due to the low flip angle refocusing train used by 3D FLAIR and 3D mFLAIR where the lowest refocusing angle reached was 18°. PNS remained the same for the two sequences since gradients for the sequence were not modified.
Proton density for GM, WM and CSF was considered to be the same for simulations. GM and WM both have roughly the same proton density (0.106 g/cc) while density in CSF is only slightly higher at 0.112 g/cc. Consequently, simulation values derived for the relative signal of the three brain components should be accurate. Slight deviations in the accuracy of TI value derived theoretically (equation [2]) get reflected in differences between predicted and measured SNR and CNR values. For example, simulations predict a drop in GM signal by 0.06% (for 3D mFLAIR) while the measured decrease was 1.5%.
Although CSF SNR showed a statistically significant difference between 3D FLAIR and 3D mFLAIR images, the increase was < 10% of the suppressed signal in CSF. In addition, part of the increase in CSF SNR was attributable to lower noise level in the 3D mFLAIR CSF. Visual inspection by the observers did not find any perceptible change in CSF suppression or in lesion conspicuity between the two sequences. A more stratified scale for qualitative analysis was deemed unnecessary since the images from the two sets were equivalent except when corrupted by motion.
Calculations in eqn [4] and [6] assume perfect refocusing and negligible T1 relaxation of the T2 weighting sequence. The latter is true since typically TT2P << T1. For example, T1WM ≈ 830ms (at 3T) while TT2P = 125 ms. In addition, any longitudinal relaxation will not contribute to the Mz in (6) since the –90° tips the relaxed magnetization into the transverse plane where the signal is dephased away by large gradients.
Limitations of the Bloch simulation include the assumption of B1 homogeneity and no magnetization transfer effects. Note that both sequences would exhibit similar characteristics in relation to any violation of the assumptions. Foldover artifacts can be more pronounced with use of SENSE along two directions. Full brain coverage along the preferred SENSE directions (y and z in our case) is usually required. A sagittal orientation was used for imaging since it usually provides full coverage in the fewest number of slices and time. The coil design does not allow for SENSE in the feet-head direction. However, since isotropic 3D mFLAIR is used, reformatted slices in other orientations are easily available. When running parts of a sequence with reduced TR, care needs to be taken to ensure that gradient and rf duty cycles are not violated. In the modified sequence presented here, this was done by using the minimum TR to calculate these values and ensure compliance.
In conclusion, we have described a technique to reduce scan time in 3D FLAIR by about one-third using modulation of repetition and inversion time. Qualitative as well as quantitative assessment of the 3D mFLAIR images in 14 subjects showed no perceptible differences arising from the modulation scheme. Finally the method described here could be extended to other three dimensional imaging sequences which have relatively longer dead times.
Acknowledgments
This work was supported by the Intramural Research Program of the NIH Clinical Center.
REFERENCES
- 1.Hajnal JV, De Coene B, Lewis PD, Baudouin CJ, Cowan FM, Pennock JM, Young IR, Bydder GM. High signal regions in normal white matter shown by heavily T2-weighted CSF nulled IR sequences. J Comput Assist Tomogr. 1992;16(4):506–513. doi: 10.1097/00004728-199207000-00002. [DOI] [PubMed] [Google Scholar]
- 2.Hajnal JV, Bryant DJ, Kasuboski L, Pattany PM, De Coene B, Lewis PD, Pennock JM, Oatridge A, Young IR, Bydder GM. Use of fluid attenuated inversion recovery (FLAIR) pulse sequences in MRI of the brain. J Comput Assist Tomogr. 1992;16(6):841–844. doi: 10.1097/00004728-199211000-00001. [DOI] [PubMed] [Google Scholar]
- 3.Landman BA, Huang AJ, Gifford A, Vikram DS, Lim IA, Farrell JA, Bogovic JA, Hua J, Chen M, Jarso S, Smith SA, Joel S, Mori S, Pekar JJ, Barker PB, Prince JL, van Zijl PC. Multi-parametric neuroimaging reproducibility: a 3-T resource study. Neuroimage. 2011;54(4):2854–2866. doi: 10.1016/j.neuroimage.2010.11.047. [DOI] [PMC free article] [PubMed] [Google Scholar]
- 4.Visser F, Zwanenburg JJ, Hoogduin JM, Luijten PR. High-resolution magnetization-prepared 3D-FLAIR imaging at 7.0 Tesla. Magn Reson Med. 2010;64(1):194–202. doi: 10.1002/mrm.22397. [DOI] [PubMed] [Google Scholar]
- 5.Gai ND, Butman JA. Modulated repetition time look-locker (MORTLL): a method for rapid high resolution three-dimensional T1 mapping. J Magn Reson Imaging. 2009;30(3):640–648. doi: 10.1002/jmri.21842. [DOI] [PMC free article] [PubMed] [Google Scholar]
- 6.Rydberg JN, Riederer SJ, Rydberg CH, Jack CR. Contrast optimization of fluid-attenuated inversion recovery (FLAIR) imaging. Magn Reson Med. 1995;34(6):868–877. doi: 10.1002/mrm.1910340612. [DOI] [PubMed] [Google Scholar]
- 7.Alsop DC. The sensitivity of low flip angle RARE imaging. Magn Reson Med. 1997;37(2):176–184. doi: 10.1002/mrm.1910370206. [DOI] [PubMed] [Google Scholar]
- 8.Hennig J, Weigel M, Scheffler K. Multiecho sequences with variable refocusing flip angles: optimization of signal behavior using smooth transitions between pseudo steady states (TRAPS). Magn Reson Med. 2003;49(3):527–535. doi: 10.1002/mrm.10391. [DOI] [PubMed] [Google Scholar]
- 9.Hennig J. Multiecho Imaging Sequences with Low Refocusing Flip Angles. Journal of Magnetic Resonance. 1988;78(3):397–407. [Google Scholar]
- 10.Warntjes JB, Dahlqvist O, Lundberg P. Novel method for rapid, simultaneous T1, T*2, and proton density quantification. Magn Reson Med. 2007;57(3):528–537. doi: 10.1002/mrm.21165. [DOI] [PubMed] [Google Scholar]
- 11.Hopkins AL, Yeung HN, Bratton CB. Multiple field strength in vivo T1 and T2 for cerebrospinal fluid protons. Magn Reson Med. 1986;3(2):303–311. doi: 10.1002/mrm.1910030214. [DOI] [PubMed] [Google Scholar]
- 12.Wansapura JP, Holland SK, Dunn RS, Ball WS., Jr NMR relaxation times in the human brain at 3.0 tesla. J Magn Reson Imaging. 1999;9(4):531–538. doi: 10.1002/(sici)1522-2586(199904)9:4<531::aid-jmri4>3.0.co;2-l. [DOI] [PubMed] [Google Scholar]


