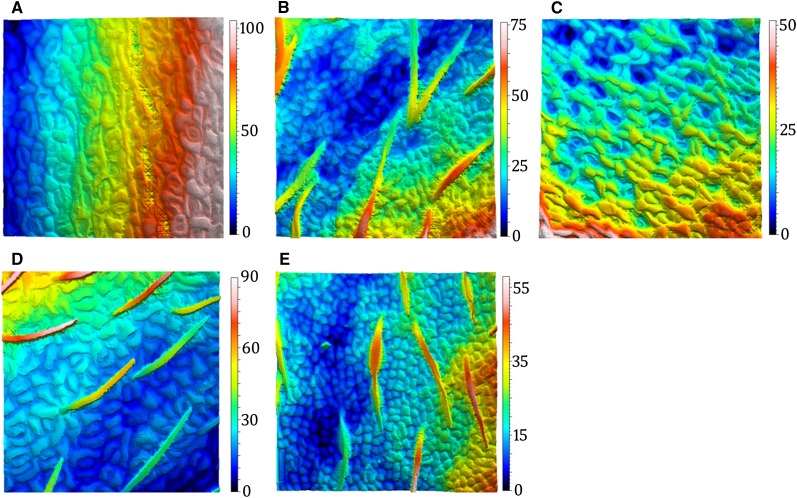
Optical topometry is a powerful, nondestructive method for rapid, quantitative, high resolution imaging of the plant epidermis, requiring no sample preparation.
Abstract
The plant epidermis regulates key physiological functions contributing to photosynthetic rate, plant productivity, and ecosystem stability. Yet, quantitative characterization of this interface between a plant and its aerial environment is laborious and destructive with current techniques, making large-scale characterization of epidermal cell parameters impractical. Here, we present our exploration of optical topometry (OT) for the analysis of plant organ surfaces. OT is a mature, confocal microscopy-based implementation of surface metrology that generates nanometer-scale digital characterizations of any surface. We report epidermal analyses in Arabidopsis (Arabidopsis thaliana) and other species as well as dried herbarium specimens and fossilized plants. We evaluate the technology’s analytical potential for identifying an array of epidermal characters, including cell type distributions, variation in cell morphology and stomatal depth, differentiation of herbarium specimens, and real-time deformations in living tissue following detachment. As applied to plant material, OT is very fast and nondestructive, yielding richly mineable data sets describing living tissues and rendering a variety of their characteristics accessible for statistical, quantitative genetic, and structural analysis.
High-throughput methodologies are enabling ever more precise and integrated analyses of plant genomes, transcriptomes, proteomes, and metabolomes. However, connecting such comprehensive molecular data sets to the higher orders of plant organization that they control depends upon capturing correspondingly precise and authentic quantitative depictions of plant cell biology, anatomy, and developmental features. High-throughput phenotyping techniques, enabling the speed and accuracy of data acquisition characteristic of omic technologies, are now needed if we are to forge mechanistic links between macroscopic plant phenotypes and their molecular underpinnings.
This report addresses the challenge of structurally phenotyping the plant epidermis. A widely used and cost-effective method for quantifying epidermal phenotypes employs nail polish and/or dental resin to create an impression of the tissue surface, followed by imaging under light microscopy (Geisler et al., 2000; Delgado et al., 2011). Resultant images are then manually quantified using image analysis software such as ImageJ or Cell Profiler, yielding outputs such as cell sizes, stomatal index (number of stomata per total cell number), or stomatal density (number of stomata per unit area). Methods appropriate for smaller scale studies involve tissue fixation and staining or transgenic marker lines (Dow et al., 2014; Lawson et al., 2014). These current methods share common disadvantages of tedious sample preparation and low throughput. More elaborate methods involving fluorescence and electron microscopy are encumbered by the additional disadvantage of higher imaging equipment costs (Salomon et al., 2010). Finally, nearly all of these methods are somewhat or completely destructive, allowing for but a single time point to be measured per sample.
Optical topometry (OT) is one of many technologies serving the field of surface metrology, the study of microscopic features of both natural and manufactured surfaces. Under the rubric of OT are found diverse methodologies for collecting data, all of which rely on a surface’s response to incident light. Other approaches to surface metrology rely on physical contact between the instrument’s probe and the surface (atomic force microscopy [AFM], for example). Unlike profilometry, which gathers data as a series of profiles, topometry gathers data as a series of planes. The instrument used in this study deploys multipinhole, spinning-disc confocal microscopy to measure the nanoscale topography of surfaces with high accuracy and reproducibility (Bullman, 2003; Weber, 2006, 2009; Ghazal and Kern, 2009; Pastorelli et al., 2013). Unlike many topometric instruments that rely on specular reflection, the instrument employed in this study collects data as a distribution of light intensities. This allows for finer resolution and faster data collection. Applied to biological materials, the method is nondestructive and yields information-rich data sets containing both topography and reflective intensity for each coordinate in the field of view. OT has as yet seen limited application in biology, revealing details of wear on grazing ungulate teeth in one of the few published applications (Schulz et al., 2010). Here, we apply OT technology to the analysis of the cellular makeup of the plant epidermis and, in so doing, demonstrate its high-throughput, wide spatiotemporal resolution and stunning dimensionality. While this report focuses on phenotypes of the plant epidermis, the technology is well suited and yet underexploited in other biological applications.
A plant’s epidermis represents the interface between its internal architecture and the surrounding substrate and atmosphere, with the aboveground portion regulating gas exchange: carbon dioxide uptake and transpirational water loss. The aerial epidermis in most plant tissues consists of pavement cells interspersed with trichomes and stomatal guard cells. Pavement cells provide mechanical support for the leaf and synthesize lipids that contribute to its epicuticular wax layer (Javelle et al., 2011). Gaseous flux between plant tissues and the atmosphere is controlled by the stomata, microscopic epidermal pores defined by the gap between two guard cells whose coordinated deformations alter pore aperture. The two-way passage of gasses through stomatal pores is known as stomatal conductance and is tightly regulated to balance the uptake of carbon dioxide with water loss under varying environmental conditions. On short, physiological timescales, plants adjust stomatal conductance by altering stomatal pore aperture within minutes of sensing an environmental cue, such as a change in humidity, light quality and level, and water availability (Creese et al., 2014). On longer, developmental timescales, plants alter stomatal conductance by changing the density, size, and depth of stomata during leaf ontogeny, again in response to the same environmental cues (Pillitteri and Torii, 2012).
Epidermal features also control a plant’s interaction with biotic components of its environment. For example, stomata act as gratuitous gateways to bacterial and fungal pathogen entry (Gudesblat et al., 2009). The epidermis of many plant species also includes trichomes, elongated cells that act primarily to protect organs from insect herbivory. In many cases, such as in the Bromeliaceae and Asteraceae families, trichomes increase the boundary layer near stomata, enhancing epidermal roughness and reducing stomatal conductance (Schreuder et al., 2001; Benz and Martin, 2006).
RESULTS
OT Provides High-Resolution Epidermal Measurements
OT is not an imaging technology but a measurement technology. Therefore, images obtained via OT are generated by software supplied with the instrument based on collected topometric measurements. With the instrument used for this study, OT measurements were routinely obtained in 30 s and returned both topography and reflective intensity, with no prior sample preparation or damage whatsoever (Fig. 1). Sampling rate varies across species and is dependent on tissue condition. Approximately 30 measurements per hour can be collected for Arabidopsis (Arabidopsis thaliana) samples, or 2 min per measurement. The movable stage of the instrument used in this study is programmable for capturing a grid of measurements. Stitching allows adjacent individual measurements to be assembled into a high-resolution topographic description of tissue across the leaf. Using the hardware and software employed in this study, 10,000 measurements can theoretically be stitched together as a 100 × 100 grid of individual measurements. However, computational limitations restrict the practical grid size to 10 × 10. This allows for gathering the topography for entire cotyledons or small leaves but only portions of large leaves. Automatic stitching is limited to a height range of 250 µm across the grid. Any data points outside this range must be gathered separately and manually stitched together (Nabity et al., 2013). Automatic stitching can require more time for the system to gather and align measurements. For example, gathering 10 grids of 4 × 1 each from leaves of the monocot Setaria viridis takes approximately 1 h, somewhat longer than the time required to manually acquire 40 individual measurements of the same species.
Figure 1.
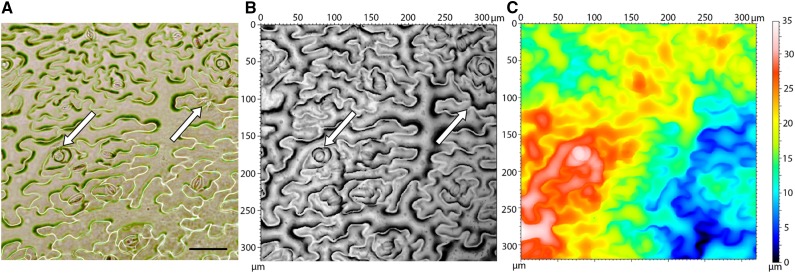
Comparison of nail polish and OT techniques. All figures have the same unit area and are from the same location on the same leaf. A, Traditional light microscopy image of Arabidopsis epidermis nail polish impression. Bar = 50 μm. B, Reflective intensity layer of OT measurement. The left arrow points to a recently divided cell in which clear cell boundaries can not easily be identified in the respective light microscopy image. The right arrow points to technical error made during the impression process that is not present in OT measurement. C, Topography layer of OT measurement. Color bar indicates height.
Using the software provided with the instrument, OT consistently outperformed the traditional nail polish impression technique in both data quality and throughput. The same sample field is shown in Figure 1, visualized by nail polish impression under bright-field light microscopy as well as reflective intensity and topography measurements from OT. The readability of the nail polish image for automated counting software suffers from cell boundaries occurring in and out of the focal plane, resulting in inconsistent colors and clarity of cell boundaries within and across images. Such irregularities and sample-to-sample variation confound automated cell-counting algorithms. It is difficult to resolve smaller and newly developing cells in nail polish impressions. Because OT measures the source material itself and not an impression thereof, boundaries between two recently divided pavement cells tend to be better defined (Fig. 1A). OT images also lack various extraneous artifacts that occur in images of nail polish impressions (Fig. 1A).
Separation of Cell and Leaf Level Features with the Form Removal Operator
A single topographic measurement of a plant’s epidermis consists of layered polynomials that, in the aggregate, fully describe the surface’s three-dimensional character. Considered individually, each polynomial defines a single profile (called a form), ranging from the overall gross leaf curvature down to individual cell morphologies. A form is a component of topography with a wavelength equal to the surface measured. With increasing polynomial order, a form will have a more complex contour that incorporates finer features of waviness and follows the relief of the surface more closely, ultimately defining the pillowed shapes of individual cells. Standard OT analytical software can mathematically remove selected forms from within a given measurement (Smith, 2002; Forbes, 2013). Form removal allows for better focused analyses of data sets (Fig. 2), akin to numerically flattening the saddle curvature of a potato chip to study its lower order ripples. Deconstructing OT measurements into discrete polynomial forms allows one to analyze the plant epidermis from multiple perspectives.
Figure 2.
Demonstration of form removal separating layers within the surface. All images are 319 × 319 μm, and each color bar indicates height of adjacent measurement. A, Raw, unaltered Arabidopsis epidermal topography. B, Linear, first-order polynomial to be removed from the original topography. C, Topography resulting from first-order, linear form removed from the original topography. D, The 12th-layer polynomial to be removed from the original topography. E, Topography resulting from the 12th-layer polynomial removed from the original topography. Removal of the 12th form highlights cell features not identifiable in the original topography. The raw topography (A) is subdivided into the combination of topographies B and C or a combination of topographies D and E.
An example of the power of form removal in surface analysis is illustrated in Figure 2. The first-order polynomial (Fig. 2B) is a linear function describing the incline between the central vein and the leaf margin. Removing the first-order polynomial from the raw topography (Fig. 2A) results in a partially flattened surface with a reoriented plane (Fig. 2C). Removal of the 12th-order polynomial form (Fig. 2D), which describes primarily organ-level effects, enables one to study only highest frequency wavelengths, features contributed by cell morphology alone (Fig. 2E). Comparison of the raw measurement (Fig. 2A) with the result of having removed the 12th- order polynomial (Fig. 2E) highlights how forms removal enables the analysis of cell-level features.
Monitoring Leaf Volume and Cell Anisotropy over Time
The nondestructive nature of OT technology enables repeated measurements of an unperturbed patch of live epidermal tissue over an extended time period. We assessed this capability in a simple analysis of changes in cellular anisotropy during leaf wilting, but this can be applied to leaf development over longer timescales.
Mechanical support for plant cells arises from two fundamental structural features: the vacuole and the cell wall (Wolf et al., 2012). When pressure within the cell vacuole declines due to water loss, primary and secondary cell walls provide residual cell support. Cells tend to become more anisotropic as the omnidirectional drive of vacuolar turgor pressure declines. While cellular anisotropy is easily evident in monocot leaves, it can be comparatively obscure and less easily quantified in eudicot leaves with their irregular cell architecture. Arabidopsis is a particularly challenging case owing to its jigsaw puzzle-like epidermal cell patterns (Wolf et al., 2012).
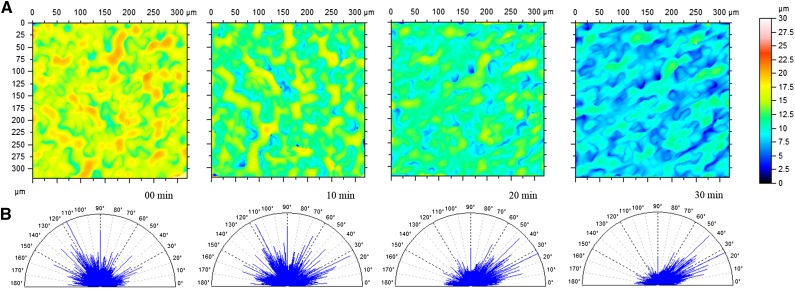
Established methods for measuring plant cell growth anisotropy rely on inference from clonal analysis, manual cell marking, transposable element activation, or irradiation and cell tracking over time to discern strain rates (Poethig and Sussex, 1985; Rolland-Lagan et al., 2005). Each of these methods requires considerable preparation before the experiment, followed by days of data collection. We assessed the capacity of OT to discern changes in Arabidopsis cell anisotropy by measuring a single patch of a leaf periodically after removal from the rosette. Arabidopsis leaf cells display little readily apparent directionality, but OT can detect a shift in their primary axes soon after detachment. After 30 min, surface anisotropy decreased by 42%, developing an angular bias of 20° to 50° from perpendicular to the midvein (Fig. 3; Supplemental Table S1). The directionality of cell anisotropy detected with OT is comparable to that reported in previous studies (Poethig and Sussex, 1985; Elsner et al., 2012). OT therefore provides a facile method for parsing and quantifying subtle morphological transitions in leaf surfaces.
Figure 3.
Cell anisotropy captured in wilted leaf surface. A, Topographies of Arabidopsis epidermis at four different time points after initial abscission from the rosette (time, 0–30 min; 12 forms removed; n = 3; P = 0.05). Color bar indicates height within the measurements. B, Corresponding angles for cell patterning within topographies. The relative frequency an angle occurs within a measurement is indicated by the amplitude on the spectrum. As isotropy increases, angles near 26.5° and 45° increase in amplitude, while the amplitude of all other angles on the spectrum decrease.
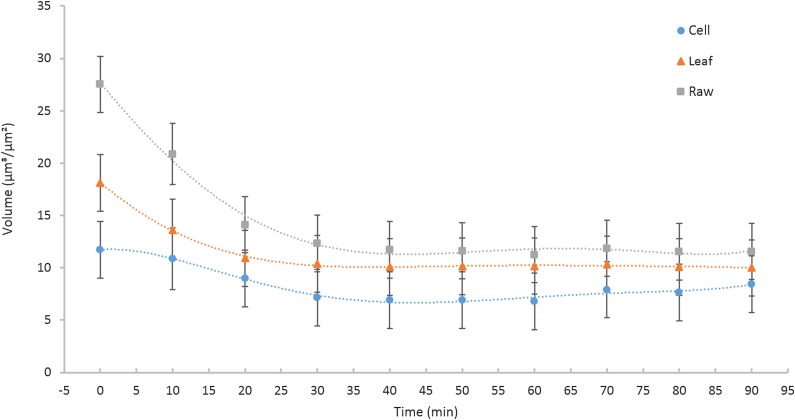
Independent analyses of successive polynomial layers identify the contributions of each to changes in leaf topography during wilting. The volume of the surface with the first form removed (Fig. 4, Leaf) was 35% less than the volume of the surface with the 12th form removed (Fig. 4, Cell). Comparison of initial volumes among the transformed layers demonstrates how each layer contributes independently to overall surface volume. Significant leaf volume is lost within the first 20 min following detachment from the rosette, after which there is no significant difference between the raw, first, and all-but-one form removed measurements. Polynomial layers are statistically indistinguishable after 30 min of wilting due to flattening of leaf and cell architecture. Three-dimensional surface area followed a similar temporal pattern during wilting (Supplemental Fig. S1). Species with more substantial leaves than Arabidopsis (e.g. maize [Zea mays] and Miscanthus giganteus) demonstrate different kinetics of deformation after abscission (data not shown).
Figure 4.
Change in water volume of a wilting leaf over time. Material volume was calculated as the total volume of space taken up by the material. The data include Arabidopsis plants transformed into three different sets: Raw (original and unaltered) topography, Leaf (remaining topography when the first form is removed) topography, and Cell (remaining topography when the 12th form is removed) topography (P = 0.025; error bars, se of the mean). Results highlight that each layer within the leaf contributes independently to the total volume and further suggest that the leaf has already lost significant volume after only 10 min (n = 3, P < 0.001).
Automated Cell Counting
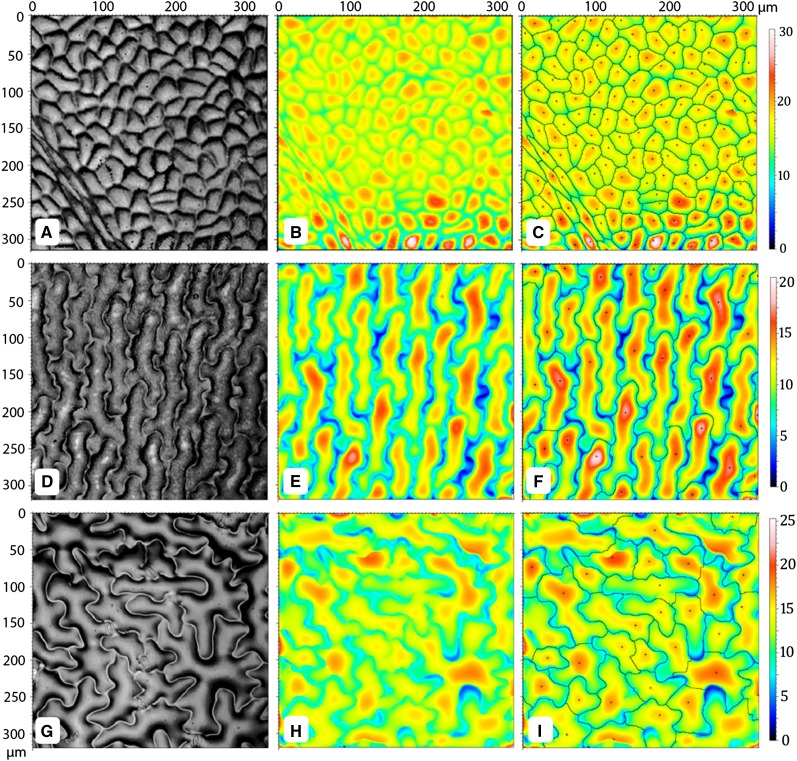
An attractive feature of OT is its potential to facilitate automated enumeration of cells on the surface of a sampled tissue. Using the software provided with the instrument used in this study, a motif operator can be applied to identify segments (these usually being cells, in leaf samples) within a measurement, based on selected thresholds for peak distributions, minimum segment size, and height. Batch processing of the motif operator exports total cell number, average cell size, average cell height, and total three-dimensional surface area for each measurement. The ability of the motif operator to accurately identify cell boundaries declines as cell shape complexity increases across species. Figure 5 shows that as cell lobing increases, counting accuracy suffers for Arabidopsis pavement cells compared with simpler celled grape (Vitis vinifera) or maidenhair fern (Adiantum tenerum). Erroneous counts arise from the software improperly splitting a single cell into multiple cells, grouping part of one cell with an adjacent cell, or counting multiple cells as a single cell. Motif segmentation of grape leaf cells produced no errors, owing to that species’ simple, crisp epidermal topography (Fig. 5, A–C). Maidenhair fern displays cell profiles intermediate between those of grape and Arabidopsis, and motif analysis in this species yielded few segmentation errors (Fig. 5, D–F).
Figure 5.
Automated counting of cells across species. A to C, V. vinifera reflective intensity, topography, and cell automated count, respectively. D to F, A. tenerum reflective intensity, topography, and cell automated count, respectively. G to I, Arabidopsis reflective intensity, topography, and cell automated count, respectively. The + identifies the peak used to define the motif. Color bars indicate heights in micrometers.
While the heavily lobed morphology of Arabidopsis leaf cells increased error rates compared with simpler celled species, error rates remained nonetheless relatively low (with respect to manual counts; Fig. 5, G–I). Most of the errors from automated counting arise from either the software’s inability to distinguish between partial cells and lobes of cells on the outermost periphery of the sample field or between lobes with especially pronounced height. Importantly, the motif operator could not distinguish between stomata and pavement cells in Arabidopsis and thus returned the sum of stomata and pavement cells. Distinguishing between cell types is an important objective for the future full exploitation of the numerical output of OT.
Analysis of Cell Interdigitation Phenotypes
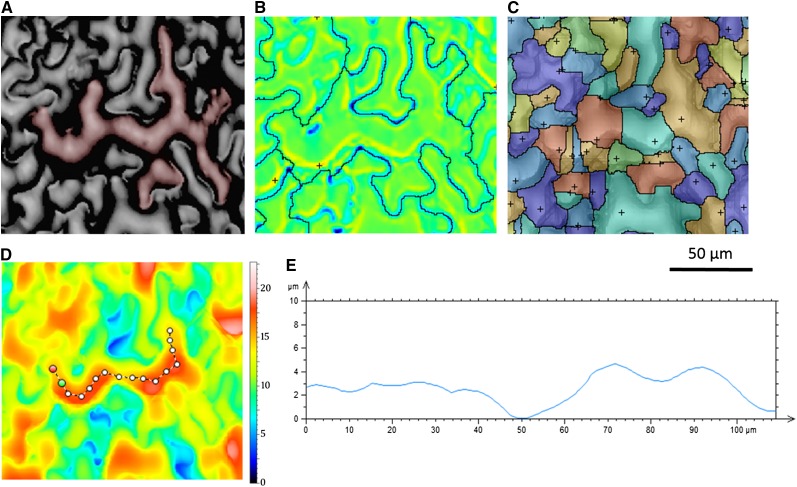
The motif operator’s flexible segmentation parameters enable the analysis of features on a finer scale than entire cells (Fig. 6). Relaxed segmentation settings identify whole cells (Fig. 6B), whereas more conservative, restrictive settings identify lobes within individual cells (Fig. 6C). A digital transect displays cell height along the axis used to set boundaries between adjacent motifs (Fig. 6, D and E). In the instance illustrated, a height change of 2 µm represents the threshold selected for declaring a new motif.
Figure 6.
Motif operator identifies both cells and lobes. A, Reflective intensity of Arabidopsis epidermis with false color of a single cell. B, Motif operator identification of the cell using relaxed parameters. C, Motif operator identification of lobes within the cell using conservative parameters. D, Transect measuring height across the cell. Color bar indicates height in micrometers. E, Graph of difference in height along transect. The motif analysis for rop2 can be found in Supplemental Figure S2.
We compared OT’s ability to identify cell morphology motifs with that of conventional light microscopy in the test case of the wild type versus the Rho-related small G protein2 (rop2) mutant of Arabidopsis. ROP2 is a member of a plant-specific Rho GTPase family that regulates interdigitation of leaf pavement cells. In rop2 mutants, pavement cells are reported to form fewer and smaller lobes compared with the wild type (Fu et al., 2005). Using OT, lobe parameters in rop2 and wild-type epidermal cells were determined from local height maxima as well as a minimum area of 0.1% of the surface area. Motif analysis confirms a decrease in lobe number in the mutant but no difference in total pavement cell numbers from the ecotype Columbia (Col-0) wild type (Supplemental Fig. S3, A and B). These results concur with ROP2’s role in microtubule and microfilament control of pavement cell morphology (Fu et al., 2005). Motif analysis further revealed that average lobe height and total three-dimensional epidermal surface area in rop2 leaves are lower than in the wild type (Supplemental Fig. S3, C and D). OT can therefore reveal unique features of this and presumably other mutant phenotypes in the z-dimension that have not been previously appreciated through observation with conventional microscopy.
One significant limitation to this method is that the operator algorithm is formulated to account for every pixel in the measurement, including regions between but not part of lobes. Because the rop2 mutants had fewer lobes, a slight bias occurred in the rop2 data set in which the average two-dimensional areas for each lobe were inflated for the mutant line (data not shown). This bias precludes determination of relative lobe sizes, but not numbers, between mutant and wild-type leaf cells.
Measurements of Stomatal Depth
A common objective of ecosystem modeling is an estimation of plant productivity and its feedback on future climate parameters. Stomatal conductance, the rate of water loss and carbon dioxide uptake through the stomatal pore, plays a key role in these processes and therefore must be accurately represented in models. Some recent efforts to improve the Ball-Berry-Leuning model have focused on refining assumptions regarding stomatal conductance itself (Damour et al., 2010; Buckley and Mott, 2013; Bonan et al., 2014). More accurate modeling will require better representation of leaf- and cell-level parameters such as stomatal number, size, and depth (Konrad et al., 2008; Roth-Nebelsick et al., 2009). Current methods for determining stomatal depth entail tissue fixation, staining, and sectioning, followed by measurement under bright-field microscopy. This laborious process requires days to obtain an adequately representational data set.
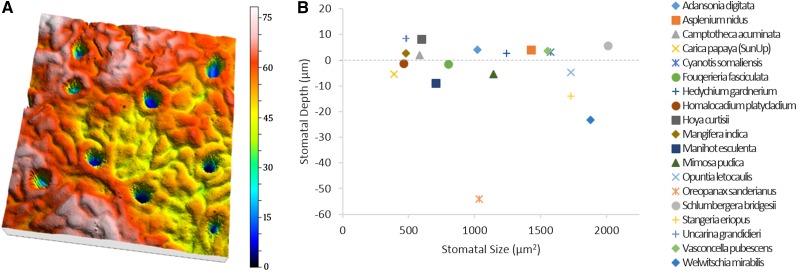
OT can capture the depths and areas of multiple stomata over a leaf’s surface to nanometer precision in fresh tissue in a matter of minutes. We evaluated this application of OT in 19 plant species. Leaf surfaces were measured, and 10 stomata were chosen from each for depth analysis. The included software’s study function, Measurement of a Wrinkle, returns the depth and area of stomata with respect to surrounding pavement cells. The accuracy of OT in these measurements was supported by favorable comparisons with published data on stomatal depth in Welwitschia mirabilis (embedded approximately 30 µm below the epidermis; Gibson, 1996) and in Oreopanax sanderianus (48.3 µm deep; Supplemental Table S2). OT analysis further demonstrated that stomatal depth and size are not necessarily correlated and that statistically significant variation occurs for both parameters across species (Fig. 7; Supplemental Table S2).
Figure 7.
Measuring stomatal depth across species. A, Three-dimensional topography of O. sanderianus highlighting stomatal depth. Dimensions are 319 × 319 μm. Color bar indicates height in micrometers. B, Graph comparing stomatal depth (F = 545.53, P < 0.001) with stomatal two-dimensional area (F = 38.51, P < 0.001) for 19 different species. Stomatal depth is not correlated with stomatal area (R2 = 0.0004). Corresponding values for each species can be found in Supplemental Table S2.
Stomatal depth analysis by OT is not without procedural limitations. Because the Wrinkle study identifies depth and not height, an epidermis with protruding stomata must first be inverted in the z-dimension, in silico, such that the protrusion now appears as a stomatal crypt.
Quantification of Epicuticular Wax Distribution
The plant epidermis is covered by an epicuticular wax layer that helps conserve water and impede insect herbivory. Under elevated CO2 partial pressures, an increased portion of carbon allocation is invested in epicuticular wax synthesis, suggesting that such wax accumulation is advantageous, given ample resources (Zhou et al., 2015). A high-throughput method for small-sample quantification of epicuticular wax has yet to be reported. Visual rating of organ waxiness has been used to screen for mutants in Arabidopsis (Koornneef et al., 1989; Bourdenx et al., 2011). Chemical quantification of epicuticular wax involves chloroform extraction followed by gas chromatography or sulfuric acid-based colorimetry (Ebercon et al., 1977; Hatterman-Valenti et al., 2011; Nadakuduti et al., 2012). Scanning electron microscopy (SEM) is an alternative option, yet costly and cumbersome for extensive studies (Tomaszewski and Zieliński, 2014). None of these approaches captures the potentially uneven distribution of wax across the surface of a single leaf or other organ.
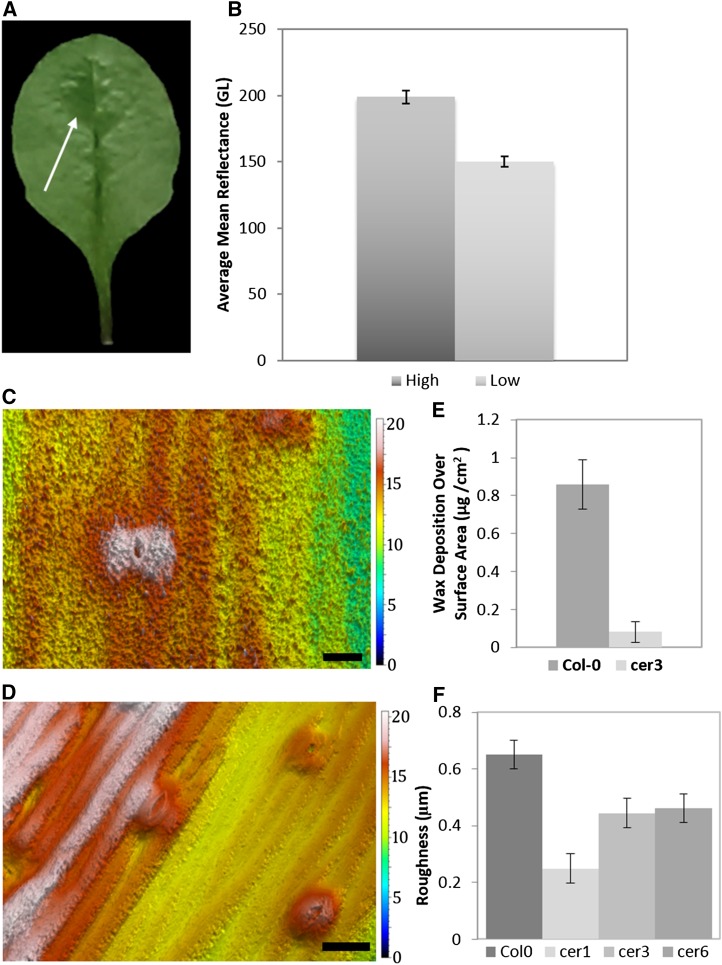
Epidermal glossiness is an established quantitative indicator of surface wax in fruit and stems (Mizrach et al., 2009; Bourdenx et al., 2011). Glossiness can be precisely quantified by OT, and we explored this application again on Arabidopsis leaves. Epicuticular wax is unevenly distributed on some Arabidopsis leaves. In some cases, epidermal leaf wax appears thicker near the leaf midvein (Fig. 8) than at the margins (Fig. 8, A and B). Two patches of epidermal tissue, one on either side of the edge of the wax pool, were measured for luminance. When comparing the adjacent waxy and nonwaxy regions, the average luminance captured by OT differs significantly (P = 0.0008; Fig. 8B). Glossy portions near the midvein have one-third higher reflective intensity than the peripheral zone.
Figure 8.
Quantification of wax deposition. A, Abaxial side of an Arabidopsis leaf demonstrating wax pooling variation across leaf surface. Contrast was altered to highlight waxy and nonwaxy regions. Waxy regions are indicated by the arrow. B, Average reflectance is 50 Gloss Units (GL) lower in leaf areas with less wax (n = 6, P = 0.0008; error bars, se of the mean). C, Wax distribution in a three-dimensional topography of Col-0 stem. Color bar indicates height in micrometers. D, Wax distribution in a three-dimensional topography of cer3 stem. Color bar indicates height in micrometers. E, Difference in total wax mass per surface area between Col-0 and cer3 plants (n = 12, P = 0.03; error bars, se of the mean). F, Roughness measurements for three wax mutants compared with the wild type (n = 5, P = 0.0005; error bars, se of the mean). Bars = 20 μm.
Epicuticular waxes create epidermal surface layers of varying textures, depending upon the chemical composition of a particular species’ waxes. Wax deposits can protrude subtly or abruptly from the surface, creating rough or smooth topographies, precisely quantifiable by OT as a roughness parameter. Roughness is defined as the high-frequency patterns that can be filtered separately from low-frequency wavelets using a function similar to forms removal. Mathematically, roughness is the root mean square height deviation from the mean of the surface topography. In Arabidopsis, wild-type stems have wax globules that form a visibly rough, uneven surface compared with that of smoother, loss-of-function wax synthesis mutant genotypes (Koornneef et al., 1989; Littlejohn et al., 2015). The images in Figure 8, C and D, highlight the contrasting stem roughness of the wild type (Col-0) and eceriferum3 (cer3) mutants. OT resolves wax globules as well as previously reported SEM images (Koornneef et al., 1989; Bourdenx et al., 2011; Littlejohn et al., 2015). To produce a roughness surface from a raw topography, we applied a 25-µm Gaussian filter to OT measurements and then calculated the root mean square for height deviation (International Organization of Standardization [ISO] 25178, Sq) using the parameters table. Roughness was significantly higher in Col-0 stems compared with cer1, cer3, and cer6 mutants (P = 0.0005; Fig. 8F). Independent spectrophotometric quantification of Col-0 and cer3 accessions confirms a significant difference in wax deposition (Fig. 8E). Because wax composition directly affects the epicuticular structure of the globules, it is important to recognize that OT can mathematically identify morphological properties present in a roughness surface that are dependent upon the chemical composition of the wax. Example properties include the characterization of peak distribution, skewness, kurtosis, and average area (data not shown).
This application of OT provides, to our knowledge, an unprecedentedly quick and quantitative method for measuring wax, not only on the whole-organ level, but also among adjacent sections of the same tissue.
Nondestructive Analyses of Rare and Challenging Samples
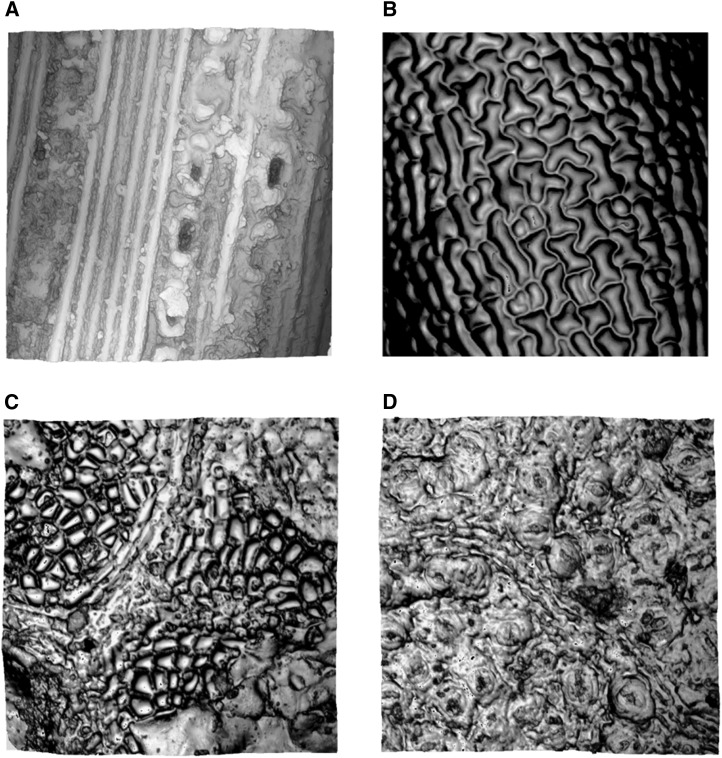
OT enables access to materials for which nail polish, AFM, and SEM are either ineffective or inappropriate: intractable, scarce, or delicate samples such as immature, waxy, succulent, and needle-like fresh materials or fossils and herbarium specimens. Pine (Pinus strobus) needles, for example, are a challenging material in which to study stomatal patterning, requiring both field emission SEM and white-light scanning interferometry to best resolve surface features (Kim et al., 2011). OT, on the other hand, provides both a topography and intensity measurement for a given sample (Fig. 9), with no prior preparation required (Fig. 9A). Likewise, epidermal measurements of delicate, immature tissues, such as an imbibed but ungerminated Arabidopsis cotyledon, are easily and accurately obtained by OT (Fig. 9B).
Figure 9.
Nondestructive measurements allow for sample preservation. A, A three-dimensional topography from P. strobus. B, Intensity measurements of an Arabidopsis ungerminated cotyledon imbibed in 50% (v/v) glycerol for 3 d and dissected out of the seed. C and D, The adaxial and abaxial leaf surfaces of fossilized Q. agrifolia, respectively.
The uniqueness of herbarium specimens makes their nondestructive analysis preferable if not essential. One attractive application of OT might be to provide an alternative, nondestructive, and yet informative means by which to identify and differentiate closely related species collected and preserved on herbarium sheets (Slippers et al., 2004). DNA isolation can be difficult, and is always destructive, from herbarium sheet specimens (Ribeiro and Lovato, 2007). We assessed OT’s capability to enable differentiation between two challenging herbarium specimens. Five species within the genus Acacia have been divided into two phylogenetically distinct subgroups based on DNA analysis. However, archival herbarium specimens representing the five species cannot be differentiated by conventional imaging techniques, hampering determination of the subgroups’ historic geographical distribution. Epidermal microfeatures of the five species revealed by OT could be used to nondestructively identify members of the two Acacia subgroups Mariosousa and Senegalia (Fig. 10). The newly applied criteria included cell morphology, presence and location of trichomes, and stomatal geometry (Supplemental Table S3).
Figure 10.
Abaxial topographies of five herbarium specimen within the Acacia subfamily. Color bars indicate height in micrometers. A, Mariososa centralis. B, Mariososa mannifera. C, Mariososa willardiana. D, Senegalia berlandiara. E, Senegalia visco.
Fossilized plants provide data for studies of not only morphological evolution, but also climate change (Rothwell et al., 2014). Epidermal stomatal density of certain indicator species is sufficiently sensitive to the partial pressure of CO2 in the surrounding atmosphere as to have become a proxy for past atmospheric CO2 levels (McElwain et al., 1999; Beerling and Royer, 2002; Steinthorsdottir et al., 2011). Its nanometer-scale resolution makes OT a valuable tool for nondestructively analyzing the surfaces of fossilized plant tissues. Figure 9, C and D, shows the adaxial and abaxial leaf surfaces of Pleistocene era Quercus agrifolia. Venation and distinct pavement and stomata cells are readily apparent and quantifiable with no damage to these rare samples.
DISCUSSION
The epidermis represents every plant’s immediate interface with the environment. Comprehensive and quantitative analysis of this tissue will require precisely measuring epidermal features at the tissue, cell, and subcellular levels. Current methods rely on confocal microscopy, membrane staining using propidium iodide or FM4-64, fluorescence-enabled imaging, AFM, SEM, and nail polish or dental resin impressions. These methods, while established and reliable, require varying levels of destructive sample processing and, with the exception of AFM and SEM, are ill suited to quantifying cell size, height, or surface topography. Destructive sample preparation can be costly and invariably precludes time lapse measurements or other repeated sampling of a tissue. OT is a high throughput, highly precise, and nondestructive method for measuring surface characteristics at the nanometer scale.
Ease, Accuracy, and Breadth of OT
OT systems are routinely bundled with powerful analysis software, empowering each instrument’s utility in a variety of primarily industrial and manufacturing applications. While analysis of the plant epidermis has been the focus of this report, OT has a variety of practical uses across biological research, including analyses of pollen, insect wings, and silk (Supplemental Fig. S4). OT’s nondestructive nature enables access to rare and delicate samples. In addition, mobile OT systems allow repeated measurements to be taken on living plant material in the field. OT’s numerical output enables the calculation of previously unobtainable topographical parameters, such as three-dimensional surface area and the mean height of a sample field. Topography and intensity measurements provide data that should enable the automated measurement of a variety of cellular phenotypes, including cell number, type, size, depth, brightness, and anisotropy.
By reexamining epidermal patterning mutant genotypes with OT, we found the technology to be sensitive enough to corroborate and expand upon previous studies reporting aberrant lobing of epidermal cells in rop2 mutants of Arabidopsis. OT further yielded the unprecedented insight that the rop2 mutant phenotype extends into the z-dimension of the leaf epidermis. Finally, OT confirmed previously reported stomatal depth measurements in W. mirabilis and other species.
Limitations, Improvements, and Extensions
OT instruments, owing to their origins and routine use in fabrication and manufacturing settings, offer intuitive and highly capable user interfaces, generating measurements (and images rendered therefrom) in far less time than essentially all conventional forms of biological microscopy. One powerful yet substantially underexploited aspect of biological OT is the mineability of the output data sets. Bundled OT analytical software, for all its industrial sophistication, flexibility, and ease of use, was not written to analyze biological specimens or necessarily answer the sorts of questions biologists pose. Our promising results notwithstanding, appropriate and versatile pattern recognition software could be developed with the objective of automating the determination of cell type and size distributions in botanical samples. The available parameters of the bundled motif operator used in this study are inadequate to achieve the cell type discrimination that botanical OT practitioners require. For example, the bundled software tended to merge measurements of stomata and smaller pavement cells with larger pavement cells, biasing estimates of average cell size.
Given that both stomatal size and depth contribute to stomatal conductance, and that these parameters vary widely across species, OT’s ability to quickly and accurately quantify these features suggests that modeling stomatal conductance in a species-specific manner is not only a possibility, but also a realistic goal for modeling future ecosystem water use. When determining surface features of fresh tissue, however, wilting can interfere with parameter accuracy if samples are not measured in a timely manner. OT data sets could be further analyzed by engineering software designed to simulate fluid dynamics of gas flow across surfaces, affording unprecedented analyses of the leaf boundary layer.
The data presented in this report were gathered using a standard installation of a single OT instrument, without additional hardware options such as fluorescence image analysis, a mobile unit for field studies, or serially measured rack-mounted samples. Further exploration with such options may reveal additional uses for OT technology in botanical, or broader biological, research. We learned in the course of this study that, while the mature technology of OT is represented by a diverse selection of instruments in the current marketplace, the instrument used is this study was the only one among devices tested from six different manufacturers that could routinely read botanical surfaces. Many instruments cannot successfully accommodate the varying transparency and reflectivity of plant surfaces, owing to their designs’ slight or substantial differences from that of the instrument used here.
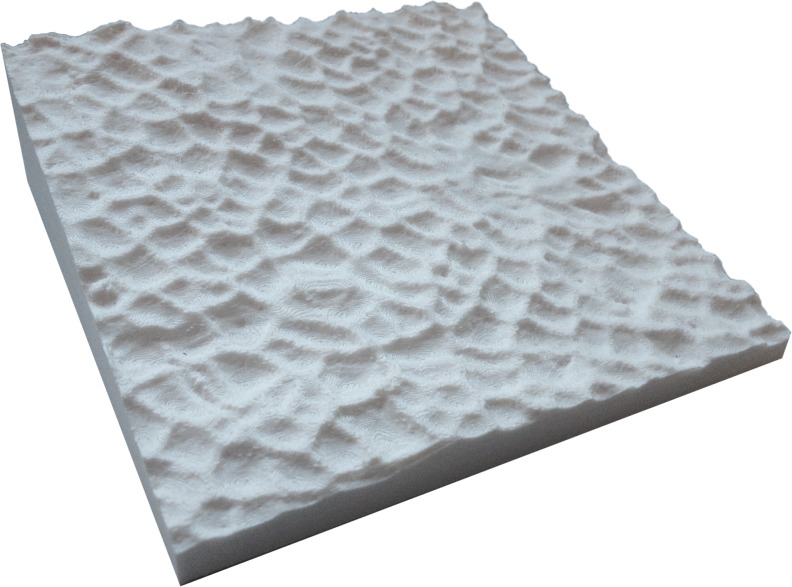
Finally, it should be noted that OT data sets are readily convertible into formats appropriate to drive three-dimensional printers and Computer Numerical Control machines (Fig. 11). This feature of biological OT, absent from conventional forms of microscopy, offers unique educational and even artistic opportunities in providing the means by which to amplify microscopic landscapes into authentic handheld or larger models in a variety of solid media.
Figure 11.
Three-dimensional plastic resin print of inverted epidermis of Burr oak (Quercus macrocarpa), made from an OT data set converted into stereolithography format (STL). Actual size of print is 12 cm × 12 cm × 2 cm.
CONCLUSION
The results of our exploration of botanical OT suggest that this technology has significant, unexploited potential to enable measurements of nanometer-scale plant epidermal phenotypes in a high-throughput manner. An obvious application is quantitative genetics, where very large sample sizes must be assessed with a minimum of human error. OT technology also enables the collection of microepidermal phenotypes from difficult or scarce specimens such as herbarium sheets and fossils, relieving sample number limitation in some studies. Importantly, OT also provides information-rich data sets, ripe for numerical analyses, both novel and those provided by the bundled software. Finally, many of these analyses can be automated, removing user bias and reducing throughput time and labor demand.
MATERIALS AND METHODS
Plant Materials and Growth Conditions
Accession Col-0 was used for all Arabidopsis (Arabidopsis thaliana) measurements, with the exception of the epidermal cell-lobing determinations in which rop2 mutant lines (SALK_055328C) were used. Both are available from the Arabidopsis Biological Resource Center. Arabidopsis seeds were imbibed at 4°C in the dark for 3 to 5 d and then sown onto autoclaved soil prepared as a 3:1 (v:v) mixture of Sunshine LC1:vermiculite (approximately 100 cm3 of soil per plant) prewetted with a 1.2 g L–1 Gnatrol-water solution to control fungus gnat (Bradysia coprophila) infestation. After 7 d, each of 36 pots in 4- × 9-cell Compak trays were thinned to one plant. Trays were positioned under 48” T8 cool-white, high-output fluorescent lamps (32 W, 4,100 K) positioned 30 cm above the soil surface of the pots on the shelf below. Growing conditions were 18°C to 20°C (day and night), with 12-h days (100–120 μE m–2 s–1)/12-h nights. Trays were watered from beneath and fertilized each week from 14 d after germination with Miracle-Gro 15-30-15 (N-P-K) fertilizer. OT data sets for the Arabidopsis epidermis were collected from the sixth fully mature leaf, on both sides of the central vein, at the organ’s proximal-distal midpoint. Tissues from native trees were collected from the University of Illinois campus. All tissues from nonnative species other than Arabidopsis were collected from plants grown in the Plant Biology Conservatory collections at the University of Illinois. Preserved leaf samples from the Acacieae tribe were provided by the University of Illinois herbarium. The Chicago Natural History Museum provided fossil specimens, including Quercus agrifolia.
Data Collection, Software, and Computations
All surface topographies were measured using a Nanofocus µsurf explorer optical topometer at 50× magnification with a 0.8 numerical aperture (unless another objective is noted). All measurements are 320 × 320μm (x-y) with a lateral resolution of 0.7 μm and a theoretical vertical resolution of 2 nm (ISO/NP25178-600, http://www.iso.org/iso/home/store/catalogue_tc/catalogue_detail.htm?csnumber=67651). Data acquisition takes 5 to 30 s, depending on the topographic complexity of the surface being measured. All samples were measured directly on the instrument’s stage with no prior sample preparation. Although upper and lower z-scale limits were set manually for each sample in our study, this can be automated for an entire session. Especially curly leaves were flattened by adhering to double-stick tape on a glass slide prior to measurement. Measurements were saved in an .nms file format and z-stacks were saved as .set files. All data were analyzed using µsoft Analysis Premium software.
ISO three-dimensional surface parameters are calculated by the Nanofocus instrument’s included software and batch processed to output a single spreadsheet file of a data set (ISO27158-2:2012; http://www.iso.org/iso/iso_catalogue/catalogue_tc/catalogue_detail.htm?csnumber=42785). Parameters used in this study include the average peak height, the mean surface roughness, and the material volume. All parameters are measured based on the data points within the measurement, not across the entire leaf.
Sequence data from this article can be found in the GenBank/EMBL data libraries under accession numbers ROP2 [AT1G20090], CER1 [AT1G02205], CER3 [AT5G57800], and CER6 [AT1G68530].
Supplemental Data
The following supplemental materials are available.
Supplemental Figure S1. Change in surface area of a wilting leaf over time.
Supplemental Figure S2. Motif operator identifies both cells and lobes in rop2 mutants.
Supplemental Figure S3. Confirmation of cell morphology rop2 mutant phenotypes using OT.
Supplemental Figure S4. Application of OT to pollen, silk, and insect wings.
Supplemental Table S1. Values of isotropy and most significant directions from wilting leaves.
Supplemental Table S2. Stomatal depth measured by OT in 19 plant species.
Supplemental Table S3. Physiological features for characterizing Mariosousa and Senegalia herbarium specimens.
Supplementary Material
Acknowledgments
We thank Christian Wichern (Nanofocus), Ian Glasspool (Field Museum of Natural History), David Siegler, Debbie Black, Andrew Leakey, Dan Xie, and Robert VanBuren (Department of Plant Biology, University of Illinois), Elissa Sledz (School of Molecular Cellular Biology, University of Illinois), David Forsyth (Department of Computer Science, University of Illinois), and Daniel Jacobs (SHoP Architects PC).
Glossary
- OT
optical topometry
- AFM
atomic force microscopy
- Col-0
ecotype Columbia
- SEM
scanning electron microscopy
Footnotes
This work was supported by the Research Board of the University of Illinois, Urbana-Champaign.
References
- Beerling DJ, Royer DL (2002) Reading a CO2 signal from fossil stomata. New Phytol 153: 387–397 [DOI] [PubMed] [Google Scholar]
- Benz BW, Martin CE (2006) Foliar trichomes, boundary layers, and gas exchange in 12 species of epiphytic Tillandsia (Bromeliaceae). J Plant Physiol 163: 648–656 [DOI] [PubMed] [Google Scholar]
- Bonan GB, Williams M, Fisher RA, Oleson KW (2014) Modeling stomatal conductance in the Earth system: linking leaf water-use efficiency and water transport along the soil-plant-atmosphere continuum. Geoscientific Model Development 7: 3085–3159 [Google Scholar]
- Bourdenx B, Bernard A, Domergue F, Pascal S, Léger A, Roby D, Pervent M, Vile D, Haslam RP, Napier JA, et al. (2011) Overexpression of Arabidopsis ECERIFERUM1 promotes wax very-long-chain alkane biosynthesis and influences plant response to biotic and abiotic stresses. Plant Physiol 156: 29–45 [DOI] [PMC free article] [PubMed] [Google Scholar]
- Buckley TN, Mott KA (2013) Modelling stomatal conductance in response to environmental factors. Plant Cell Environ 36: 1691–1699 [DOI] [PubMed] [Google Scholar]
- Bullman V. (2003) Automated three-dimensional analysis of particle measurements using an optical profilometer and image analysis software. J Microsc 211: 95–100 [DOI] [PubMed] [Google Scholar]
- Creese C, Oberbauer S, Rundel P, Sack L (2014) Are fern stomatal responses to different stimuli coordinated? Testing responses to light, vapor pressure deficit, and CO2 for diverse species grown under contrasting irradiances. New Phytol 204: 92–104 [DOI] [PubMed] [Google Scholar]
- Damour G, Simonneau T, Cochard H, Urban L (2010) An overview of models of stomatal conductance at the leaf level. Plant Cell Environ 33: 1419–1438 [DOI] [PubMed] [Google Scholar]
- Delgado D, Alonso-Blanco C, Fenoll C, Mena M (2011) Natural variation in stomatal abundance of Arabidopsis thaliana includes cryptic diversity for different developmental processes. Ann Bot (Lond) 107: 1247–1258 [DOI] [PMC free article] [PubMed] [Google Scholar]
- Dow GJ, Berry JA, Bergmann DC (2014) The physiological importance of developmental mechanisms that enforce proper stomatal spacing in Arabidopsis thaliana. New Phytol 201: 1205–1217 [DOI] [PubMed] [Google Scholar]
- Ebercon A, Blum A, Jordan WR (1977) A rapid colorimetric method for epicuticular wax contest of sorghum leaves. Crop Sci 17: 179–180 [Google Scholar]
- Elsner J, Michalski M, Kwiatkowska D (2012) Spatiotemporal variation of leaf epidermal cell growth: a quantitative analysis of Arabidopsis thaliana wild-type and triple cyclinD3 mutant plants. Ann Bot (Lond) 109: 897–910 [DOI] [PMC free article] [PubMed] [Google Scholar]
- Forbes A. (2013) Areal form removal. In Leach R, ed, Characterisation of Areal Surface Texture. Springer, Berlin, pp 107–128 [Google Scholar]
- Fu Y, Gu Y, Zheng Z, Wasteneys G, Yang Z (2005) Arabidopsis interdigitating cell growth requires two antagonistic pathways with opposing action on cell morphogenesis. Cell 120: 687–700 [DOI] [PubMed] [Google Scholar]
- Geisler M, Nadeau J, Sack FD (2000) Oriented asymmetric divisions that generate the stomatal spacing pattern in Arabidopsis are disrupted by the too many mouths mutation. Plant Cell 12: 2075–2086 [DOI] [PMC free article] [PubMed] [Google Scholar]
- Ghazal M, Kern M (2009) The influence of antagonistic surface roughness on the wear of human enamel and nanofilled composite resin artificial teeth. J Prosthet Dent 101: 342–349 [DOI] [PubMed] [Google Scholar]
- Gibson AC. (1996) Structure-Function Relations of Warm Desert Plants. Springer, Berlin. [Google Scholar]
- Gudesblat GE, Torres PS, Vojnov AA (2009) Stomata and pathogens: warfare at the gates. Plant Signal Behav 4: 1114–1116 [DOI] [PMC free article] [PubMed] [Google Scholar]
- Hatterman-Valenti H, Pitty A, Owen M (2011) Environmental effects on velvetleaf (Abutilon theophrasti) epicuticular wax deposition and herbicide absorption. Weed Sci 59: 14–21 [Google Scholar]
- Javelle M, Vernoud V, Rogowsky PM, Ingram GC (2011) Epidermis: the formation and functions of a fundamental plant tissue. New Phytol 189: 17–39 [DOI] [PubMed] [Google Scholar]
- Kim KW, Lee IJ, Kim CS, Lee DK, Park EW (2011) Micromorphology of epicuticular waxes and epistomatal chambers of pine species by electron microscopy and white light scanning interferometry. Microsc Microanal 17: 118–124 [DOI] [PubMed] [Google Scholar]
- Konrad W, Roth-Nebelsick A, Grein M (2008) Modelling of stomatal density response to atmospheric CO2. J Theor Biol 253: 638–658 [DOI] [PubMed] [Google Scholar]
- Koornneef M, Hanhart CJ, Thiel F (1989) A genetic and phenotypic description of eceriferum (cer) mutants in Arabidopsis thaliana. J Hered 80: 118–122 [Google Scholar]
- Lawson SS, Pijut PM, Michler CH (2014) Comparison of Arabidopsis stomatal density mutants indicates variation in water stress responses and potential epistatic effects. J Plant Biol 57: 162–173 [Google Scholar]
- Littlejohn GR, Mansfield JC, Parker D, Lind R, Perfect S, Seymour M, Smirnoff N, Love J, Moger J (2015) In vivo chemical and structural analysis of plant cuticular waxes using stimulated Raman scattering (SRS) microscopy. Plant Physiol 168: 18–28 [DOI] [PMC free article] [PubMed] [Google Scholar]
- McElwain JC, Beerling DJ, Woodward FI (1999) Fossil plants and global warming at the Triassic-Jurassic boundary. Science 285: 1386–1390 [DOI] [PubMed] [Google Scholar]
- Mizrach A, Lu R, Rubino M (2009) Gloss evaluation of curved-surface fruits and vegetables. Food Bioprocess Technol 2: 300–327 [Google Scholar]
- Nabity PD, Haus MJ, Berenbaum MR, DeLucia EH (2013) Leaf-galling phylloxera on grapes reprograms host metabolism and morphology. Proc Natl Acad Sci USA 110: 16663–16668 [DOI] [PMC free article] [PubMed] [Google Scholar]
- Nadakuduti SS, Pollard M, Kosma DK, Allen C Jr, Ohlrogge JB, Barry CS (2012) Pleiotropic phenotypes of the sticky peel mutant provide new insight into the role of CUTIN DEFICIENT2 in epidermal cell function in tomato. Plant Physiol 159: 945–960 [DOI] [PMC free article] [PubMed] [Google Scholar]
- Pastorelli G, Shashoua Y, Richter J (2013) Surface yellowing and fragmentation as warning signs of depolymerisation in Baltic amber. Polym Degrad Stabil 98: 2317–2322 [Google Scholar]
- Pillitteri LJ, Torii KU (2012) Mechanisms of stomatal development. Annu Rev Plant Biol 63: 591–614 [DOI] [PubMed] [Google Scholar]
- Poethig RS, Sussex IM (1985) The cellular parameters of leaf development in tobacco: a clonal analysis. Planta 165: 170–184 [DOI] [PubMed] [Google Scholar]
- Ribeiro RA, Lovato MB (2007) Comparative analysis of different DNA extraction protocols in fresh and herbarium specimens of the genus Dalbergia. Genet Mol Res 6: 173–187 [PubMed] [Google Scholar]
- Rolland-Lagan AG, Coen E, Impey SJ, Bangham JA (2005) A computational method for inferring growth parameters and shape changes during development based on clonal analysis. J Theor Biol 232: 157–177 [DOI] [PubMed] [Google Scholar]
- Roth-Nebelsick A, Hassiotou F, Veneklaas EJ (2009) Stomatal crypts have small effects on transpiration: a numerical model analysis. Plant Physiol 151: 2018–2027 [DOI] [PMC free article] [PubMed] [Google Scholar]
- Rothwell GW, Wyatt SE, Tomescu AMF (2014) Plant evolution at the interface of paleontology and developmental biology: an organism-centered paradigm. Am J Bot 101: 899–913 [DOI] [PubMed] [Google Scholar]
- Salomon S, Grunewald D, Stüber K, Schaaf S, MacLean D, Schulze-Lefert P, Robatzek S (2010) High-throughput confocal imaging of intact live tissue enables quantification of membrane trafficking in Arabidopsis. Plant Physiol 154: 1096–1104 [DOI] [PMC free article] [PubMed] [Google Scholar]
- Schreuder MDJ, Brewer CA, Heine C (2001) Modelled influences of non-exchanging trichomes on leaf boundary layers and gas exchange. J Theor Biol 210: 23–32 [DOI] [PubMed] [Google Scholar]
- Schulz E, Calandra I, Kaiser TM (2010) Applying tribology to teeth of hoofed mammals. Scanning 32: 162–182 [DOI] [PubMed] [Google Scholar]
- Slippers B, Crous PW, Denman S, Coutinho TA, Wingfield BD, Wingfield MJ (2004) Combined multiple gene genealogies and phenotypic characters differentiate several species previously identified as Botryosphaeria dothidea. Mycologia 96: 83–101 [PubMed] [Google Scholar]
- Smith GT. (2002) Industrial Metrology: Surfaces and Roundness. Springer, London [Google Scholar]
- Steinthorsdottir M, Jeram AJ, McElwain JC (2011) Extremely elevated CO2 concentrations at the Triassic/Jurassic boundary. Palaeogeogr Palaeoclimatol Palaeoecol 308: 418–432 [Google Scholar]
- Tomaszewski D, Zieliński J (2014) Epicuticular wax structures on stems and comparison between stems and leaves: a survey. Functional Ecology of Plants 209: 215–232 [Google Scholar]
- Weber MA, inventor. March 2, 2006. Device and method for measuring surfaces on the internal walls of cylinders, using confocal microscopes. US Application No. 20060043275 [Google Scholar]
- Weber MA, inventor. January 28, 2009. Method for generating a universal pinhole pattern for use in confocal microscopes. EP Application No. 2018586 A1 [Google Scholar]
- Wolf S, Hématy K, Höfte H (2012) Growth control and cell wall signaling in plants. Annu Rev Plant Biol 63: 381–407 [DOI] [PubMed] [Google Scholar]
- Zhou Y, Stuart-Williams H, Grice K, Kayler ZE, Zavadlav S, Vogts A, Rommerskirchen F, Farquhar GD, Gessler A (2015) Allocate carbon for a reason: priorities are reflected in the ¹³C/¹²C ratios of plant lipids synthesized via three independent biosynthetic pathways. Phytochemistry 111: 14–20 [DOI] [PubMed] [Google Scholar]
Associated Data
This section collects any data citations, data availability statements, or supplementary materials included in this article.


