Abstract
Deciphering how neural circuits are anatomically organized with regard to input and output is instrumental in understanding how the brain processes information. For example, locus coeruleus norepinephrine (LC-NE) neurons receive input from and send output to broad regions of the brain and spinal cord, and regulate diverse functions including arousal, attention, mood, and sensory gating1–8. However, it is unclear how LC-NE neurons divide up their brain-wide projection patterns and whether different LC-NE neurons receive differential input. Here, we developed a set of viral-genetic tools to quantitatively analyze the input–output relationship of neural circuits, and applied these tools to dissect the LC-NE circuit in mice. Rabies virus-based input mapping indicated that LC-NE neurons receive convergent synaptic input from many regions previously identified as sending axons to the LC and suggested novel presynaptic partners, including cerebellar Purkinje cells. The TRIO (tracing the relationship between input and output) method enables trans-synaptic input tracing from specific subsets of neurons based on their projection and cell type. We found that LC-NE neurons projecting to diverse output regions receive mostly similar input. Projection-based viral labeling revealed extensive output divergence: LC-NE neurons projecting to one output region also project to all brain regions we examined. Thus, the LC-NE circuit overall integrates information from, and broadcasts to, many brain regions, consistent with its primary role in regulating brain states. At the same time, we uncovered several levels of specificity in certain LC-NE sub-circuits. These viral-genetic tools for mapping output architecture and input–output relationship are applicable to other neuronal circuits and organisms. More broadly, our viral-genetic approaches provide an efficient intersectional means to target neuronal populations based on cell type and projection pattern.
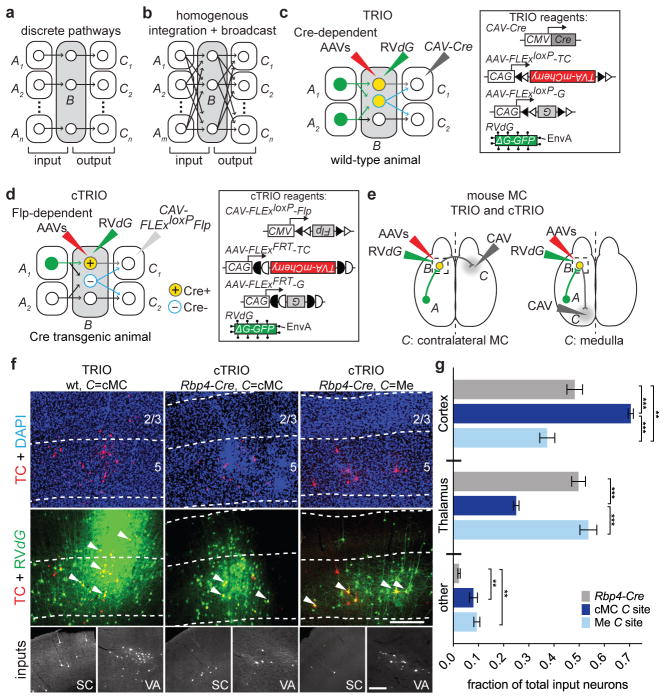
Fig. 1a–b illustrates two extreme connectivity models for input–output relationships of projection neurons. At one extreme, neurons from each input A region connect to a subtype of B neurons that send output to a unique C region (Fig. 1a); this model segregates information into discrete pathways. At the other extreme, B neurons are homogeneous in receiving input from all A regions and sending output to all C regions with a common probability distribution (Fig. 1b); this model allows an overall indiscriminate integration and broadcast of information. The input–output relationship for most neural circuits is not known (Supplementary Note 1).
Figure 1. Strategy and proof-of-principle of TRIO and cTRIO.
a, b, Schematic of two extreme connection patterns of region B neurons with inputs from A regions and outputs to C regions. c, d, Strategies for trans-synaptic input tracing from B neurons based on their outputs. TRIO (c) does not distinguish between region B cell types projecting to the selected C region (two different cell types are outlined in grey and blue). cTRIO (d) avoids labeling promiscuous projections from Cre− cells (blue). Open and filled triangles, incompatible loxP sites; open and filled half circles, incompatible FRT sites. e, Schematic of TRIO and cTRIO in mouse motor cortex (MC). CAV was injected into contralateral MC (cMC) or medulla (Me) along with AAVs expressing Cre- or Flp-dependent TVA-mCherry (TC)/rabies glycoprotein (G) into MC, followed by RVdG. Experiments were performed in wt (TRIO) or Rbp4-Cre (cTRIO) mice. f, Example coronal sections of MC starter cells in TRIO and cTRIO. Cortical layers are separated by dotted lines based on the DAPI stain (blue). Starter cells (yellow, a subset indicated by arrowheads) can be distinguished from input cells labeled only with GFP from RVdG (green). TC+ cells in MC spanned layers 2/3 and 5 for TRIO (left), but were restricted to L5 with cTRIO. Bottom inset, example images of input neurons from the somatosensory cortex (SC) and ventral anterior thalamus (VA), derived from larger composites (see Methods). g, Average fraction of total input neurons in Rbp4-Cre-based input tracing and cTRIO of MC L5 pyramidal neurons. Values represent the average fraction of input in each category (n=4 for Rbp4-Cre input tracing and cMC cTRIO; n=3 for Me cTRIO). 2-way ANOVA determined that inputs to Rbp4-Cre+ MC starter cells generated by input tracing or cTRIO (C=cMC or C=Me) are significantly different in brain regions from which they receive input (interaction p<0.0001). 1-way ANOVA and post hoc Tukey’s multiple comparison tested the significance within each input region. Error bars, s.e.m. **, p<0.01; ***, p<0.001. Scale, 250 μm (f, middle row), 100 μm (f, bottom row).
To determine the input–output organization of neural circuits, we have developed TRIO (tracing the relationship between input and output) and cTRIO (cell-type-specific TRIO) methods. TRIO identifies neurons in A regions that synapse onto B neurons projecting to a specific C region. A→B connections are determined by rabies virus-mediated retrograde trans-synaptic tracing9, which relies on monosynaptic spread of EnvA-pseudotyped, glycoprotein deleted, and GFP-expressing rabies viruses (RVdG hereafter) from starter cells in the B region. Starter cells express rabies glycoprotein (G) and the TVA receptor for EnvA fused with mCherry (TC)10,11, which allow RVdG infection and complementation, enabling trans-synaptic spread to presynaptic neurons in A regions. In TRIO (Fig. 1c), TC and G expression are Cre-dependent and are delivered by adeno-associated viruses (AAVs) in region B. Cre is delivered at a specific C region by canine adenovirus type 2 (CAV hereafter) that efficiently transduces axon terminals12,13. Thus, TRIO does not distinguish between different cell types within region B. In cTRIO (Fig. 1d), TRIO is performed in transgenic mice in which Cre recombinase is expressed in a specific cell type in the B region. Expression of TC and G delivered in the B region depends on Flp recombinase from CAV-FLExloxP-Flp, which is injected at a specific C region. Thus, only B neurons that express Cre and project to a specific C region can become starter cells for RVdG-mediated trans-synaptic tracing.
As a proof-of-principle, we applied TRIO and cTRIO to the mouse motor cortex (MC, Fig. 1e). In TRIO experiments, we injected CAV-Cre in contralateral MC (cMC) and AAV-FLExloxP-TC/G into MC of wild-type (wt) mice; this resulted in starter cells in MC layers 2/3 (L2/3), L5, (Fig. 1f, left; arrowheads) and L6. In cTRIO experiments, we injected CAV-FLExloxP-Flp in cMC or medulla (Me) of Retinol binding protein 4 (Rbp4)-Cre mice to target intracortical- or subcortical-projecting L5 neurons, respectively, and AAV-FLExFRT-TC/G into MC; this resulted in starter cells that were restricted to MC L5 (Fig. 1f, middle and right), as predicted by the Rbp4-Cre expression pattern14. For comparison, we also performed trans-synaptic tracing in MC of Rbp4-Cre mice, where starter cells were not selected based on output projections. A vast majority of GFP+ input neurons to MC were from the cortex or thalamus (Fig. 1f, bottom). Interestingly, cMC-projecting L5 neurons received proportionally more input from the cortex, whereas Me-projecting L5 neurons received more input from the thalamus. Almost all “other” inputs came from the globus pallidus, a recently identified direct input to the cortex15 (Fig. 1g; Supplementary Table 1). Control experiments indicated that rabies-mediated labeling of most local and all long-range input neurons were dependent on CAV-Cre for TRIO, and CAV-FLExloxP-Flp and Rbp4-Cre for cTRIO (Extended Data Fig. 1). These experiments demonstrated that cTRIO can restrict starter cells to a more specific population than TRIO, and suggested that subcortical- and callosal-projecting L5 neurons receive differential thalamic vs. cortical input. TRIO also identified presynaptic partners of callosal- or striatal-projecting MC neurons in rat (Extended Data Fig. 2).
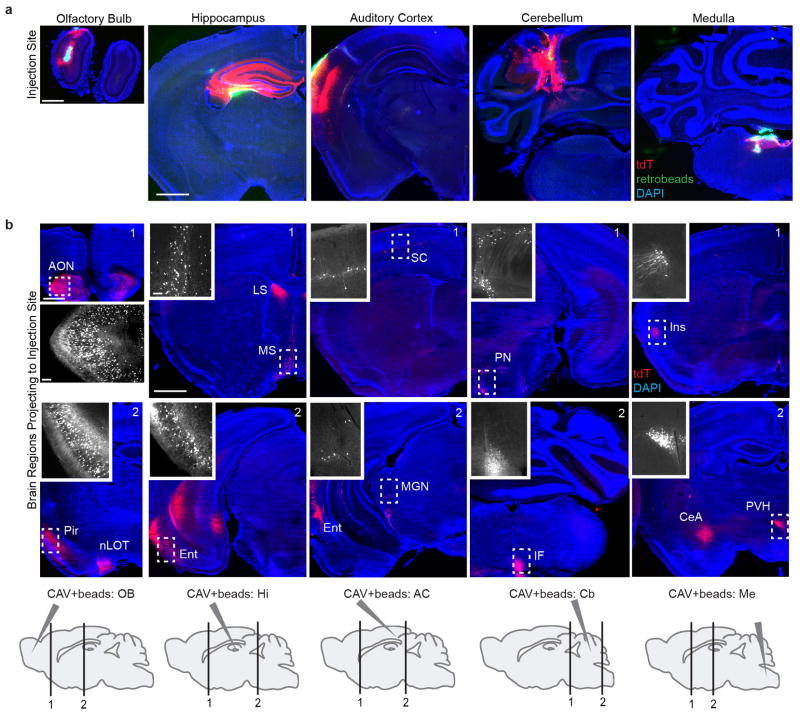
Since the precision of TRIO/cTRIO analysis is defined by CAV-mediated transduction from axons and presynaptic terminals, we characterized its spread by injecting CAV-Cre and retrobeads into the Ai14 Cre-reporter mice16 in the piriform cortex at varied distances from the mitral cell axon layer and quantifying labeled mitral cells. We found that CAV spread mostly within 200 μm from the injection site, and could also infect axons-in-passage (Extended Data Fig. 3; Supplementary Note 2). CAV tropism was examined by injecting CAV-Cre into five diverse brain regions of Ai14 mice. Neurons known to project to these brain regions, some of which are >1 cm away from the injection sites, were efficiently labeled (Extended Data Fig. 4). Thus, CAV can infect axons and terminals of diverse neuronal types across long distances.
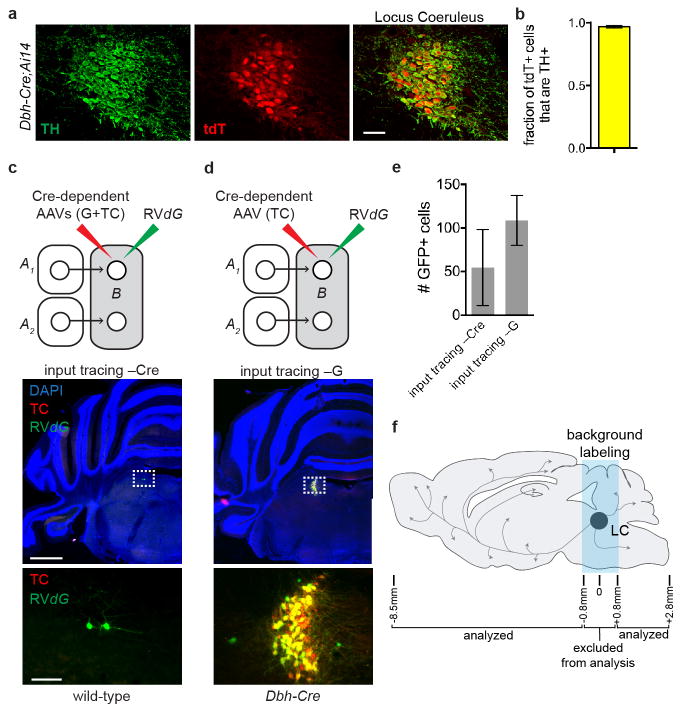
We next applied out viral-genetic tools to the norepinephrine (NE) neurons in the locus coeruleus (LC), a small bilateral nucleus in the brainstem (~1500 NE neurons per LC) that collectively project axons throughout the brain1–4. It is unclear whether different LC-NE neurons receive differential input, how LC-NE neurons divide up their brain-wide projection patterns17, and what their input-output relationships are. We first identified synaptic inputs received by these neurons using RVdG-mediated retrograde trans-synaptic tracing in Dopamine β-hydroxylase (Dbh)-Cre mice (Fig. 2a), where Cre-dependent TC and G expression was restricted to LC-NE neurons that express the NE biosynthetic enzyme Dbh (Fig. 2b). Control experiments validated that Cre recombination occurred almost exclusively in LC neurons expressing tyrosine hydroxylase (TH), another LC-NE neuron marker, and that long-range trans-synaptic tracing depended on Dbh-Cre and AAV-delivered G (Extended Data Fig. 5).
Figure 2. Presynaptic input to locus coeruleus norepinephrine (LC-NE) neurons revealed by rabies-mediated trans-synaptic tracing.
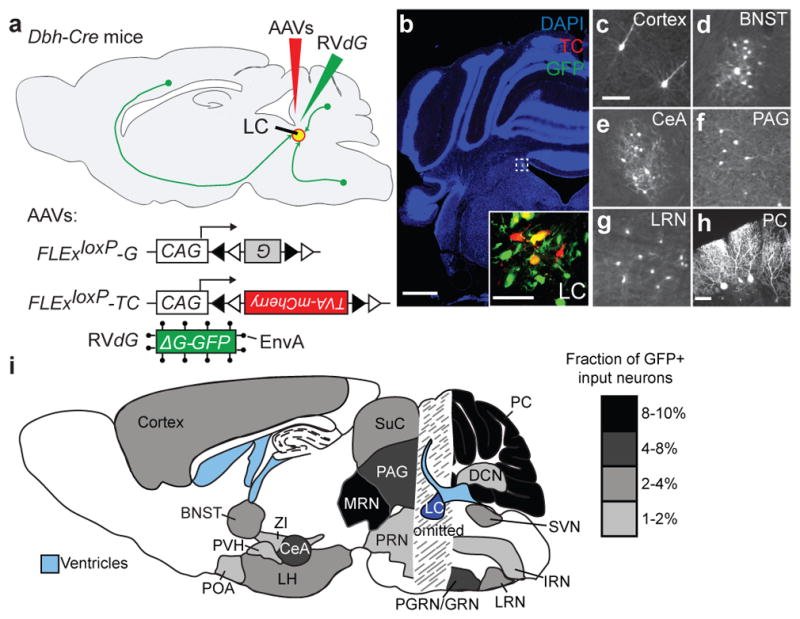
a, Strategy for trans-synaptic tracing of input to LC-NE neurons. b, Coronal section of a mouse brain at the LC (dotted square) stained with DAPI (blue). A region within the square is magnified in the inset. LC-NE starter cells (yellow) can be distinguished from cells receiving only TC from AAV (red) or only GFP from RVdG (green) at the injection site. c–g, Coronal sections showing representative input neurons in diverse brain regions. h, Sagittal section of the cerebellum showing trans-synaptically labeled Purkinje cells. Images in b–h were derived from larger composites. i, Schematic summary of brain regions that provide the largest average fractional inputs to LC-NE neurons (n=9). Scale, 1 mm (b), 50 μm (b, inset; c–h). Abbreviations: BNST, bed nucleus of the stria terminalis; CeA, central amygdala; DCN, deep cerebellar nuclei; IRN, intermediate reticular nucleus; LH, lateral hypothalamus; LRN, lateral reticular nucleus; LC, locus coeruleus; MRN, midbrain reticular nucleus; PVH, paraventricular hypothalamic nucleus; PGRN/GRN, paragigantocellular/gigantocelluar nucleus; PAG, periaqueductal gray; PRN, pontine reticular nucleus; POA, preoptic area; PC, Purkinje cells; SVN, spinal vestibular nucleus; SuC, superior colliculus; ZI, zona incerta.
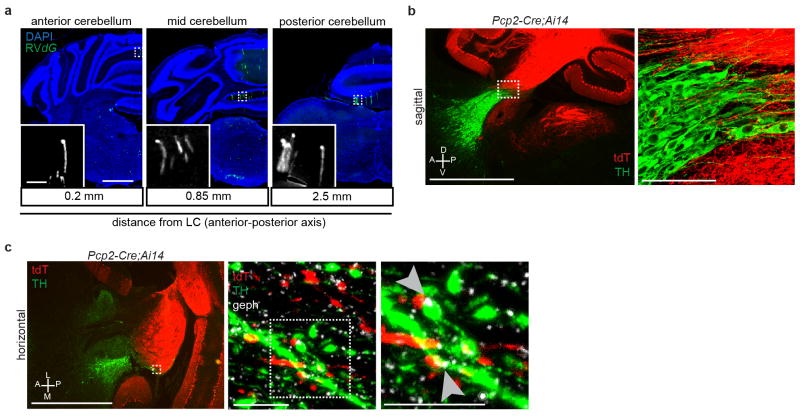
We counted all input neurons to LC-NE starter cells from the anterior forebrain to posterior medulla (Fig. 2c–h) except in coronal sections immediately surrounding the LC as non-specific viral labeling of neurons can occur locally at the AAV/RVdG injection site (Extended Data Fig. 5c–f). We assigned each input neuron to one of 111 brain regions according to the Allen Brain Atlas to categorize brain regions ipsi- or contra-lateral to the injected LC (Supplementary Table 2). Regions that contributed more than 1% of total input from nine Dbh-Cre tracing brains are summarized in Fig. 2i. Although most brain regions we identified as presynaptic to LC-NE neurons are consistent with previous retrograde tracing studies6–8, our experiment validated that these neurons directly synapse onto LC-NE neurons rather than just projecting axons to LC. We also found that deep cerebellar nuclei and cerebellar Purkinje cells contributed a significant fraction of direct synaptic input to LC-NE neurons (Fig. 2h, i), which to our knowledge has not been previously reported. Labeled Purkinje cells were enriched in the ipsilateral medial zones throughout the cerebellum, at distances up to 2.5 mm away from the LC (Extended Data Fig. 6a). Consistent with a direct connection between Purkinje cells and LC-NE neurons, we found that an inhibitory postsynaptic marker, gephyrin, was present in TH+ LC-NE dendrites apposing GABAergic Purkinje cell axons (Extended Data Fig. 6b–c).
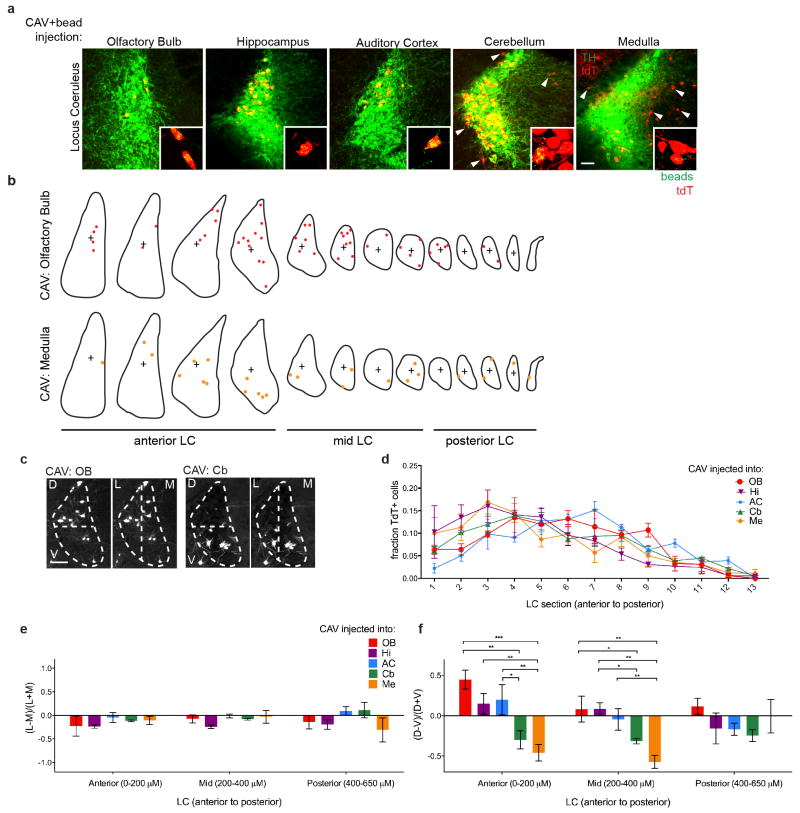
We next applied TRIO and cTRIO to test if populations of LC-NE neurons, defined by their output targets, received distinct input. We selected five diverse brain regions known to receive LC-NE projections: the olfactory bulb, auditory cortex, hippocampus, cerebellum, and medulla (Fig. 3a). CAV-Cre injection into these regions in Ai14 mice confirmed labeling of NE neurons throughout the LC (Extended Data Fig. 7a). We did not observe significant differences in the spatial distribution along the anterior–posterior or medial–lateral axes for LC-NE neurons that projected to these brain regions. However, forebrain-projecting LC-NE neurons were more dorsally biased compared to the hindbrain-projecting ones (Extended Data Fig. 7b–f), consistent with a previous observation in the rat18. We applied TRIO to olfactory bulb, auditory cortex, and hippocampus, and cTRIO to cerebellum and medulla, since LC projections to the former group predominately came from TH+ neurons, whereas the latter group contained TH− neurons (Extended Data Fig. 7a). Control experiments indicated that the labeling of input neurons depended on CAV-Cre in the case of TRIO (Extended Data Fig. 5c, e), and on both Dbh-Cre and CAV-FLExloxP-Flp in the case of cTRIO (Extended Data Fig. 8).
Figure 3. Input–output relationship of LC-NE neurons revealed by TRIO and cTRIO.
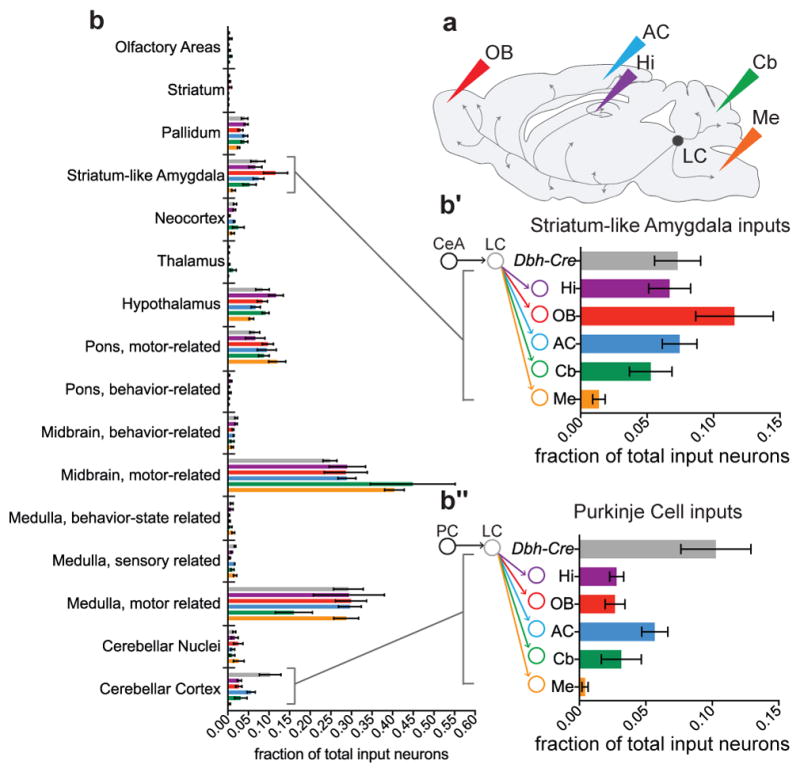
a, Schematic of CAV injections into LC output regions for TRIO and cTRIO. OB, olfactory bulb; AC, auditory cortex; Hi, hippocampus; Cb, cerebellum; Me, medulla. b, Average fractional inputs in Dbh-Cre-based input tracing (gray, n=9), TRIO (Hi, purple; OB, red; AC, blue; n=4 each), and cTRIO (Cb, green; Me, orange; n=4 each). Input neurons were grouped into 16 broader categories. Magnified insets highlight the average fraction of input from striatum-like amygdala (>98% from the central amygdala) (b′) or from Purkinje cells (b″) to LC-NE neurons that project to the 5 output regions or in Dbh-Cre-based input tracing. Error bars, s.e.m.
We analyzed inputs for the TRIO and cTRIO experiments analogous to Dbh-Cre-based input tracing (Supplementary Table 2). We observed that LC-NE neurons received inputs from all input regions regardless of their diverse output, with a grossly similar proportional distribution (Fig. 3b). These data suggest that the LC-NE circuit is largely indiscriminate with respect to its input–output relationships. However, region-by-region one-way ANOVA (Supplementary Table 3, top) rejected the overall null hypothesis that input distribution is independent of output conditions (combined p = 0.002), indicating that the input–output relationships were not entirely homogeneous. Of the individual input that exhibited the smallest p values (Supplementary Table 3, bottom), LC-NE neurons projecting to the medulla received less input from the central amygdala (Fig. 3b′). In addition, the fraction of Purkinje cell inputs in Dbh-Cre-based tracing was higher than any of the TRIO/cTRIO conditions (Fig. 3b″), suggesting that Purkinje cells contribute input to an LC-NE population that do not project axons extensively to any of the output sites we examined.
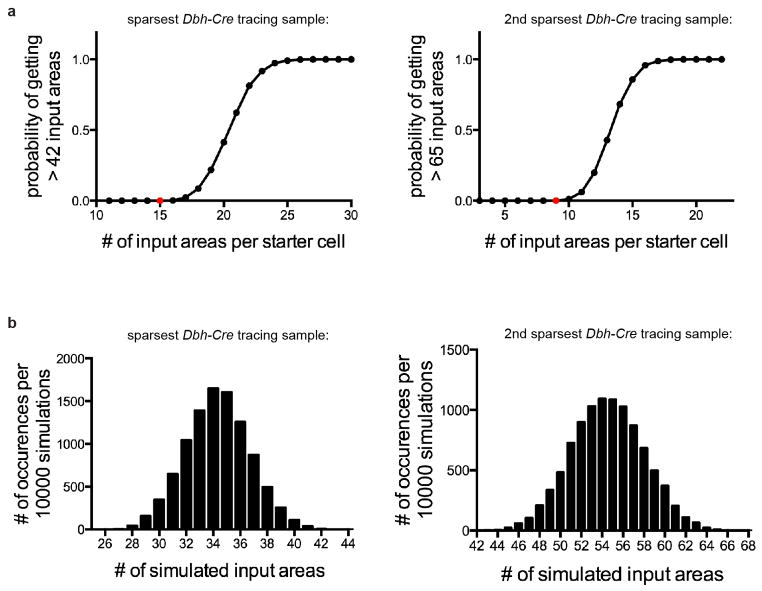
The largely indiscriminant input–output relationship revealed by TRIO can in principle be accounted for by input convergence (Fig. 1b, left), output divergence (Fig. 1b, right), or both. A simulation analysis of the two sparsest input tracing samples (Supplementary Table 2) suggested that individual LC-NE neurons must receive input from more than 15 or 9 brain regions, respectively (Extended Data Fig. 9). This is most likely a lower bound as rabies tracing efficiency is far from 100%. However, such extensive integration is not entirely homogenous (Supplementary Table 4). Thus, individual LC-NE neurons integrate inputs from many regions, yet exhibit heterogeneity with respect to brain regions from which they receive input.
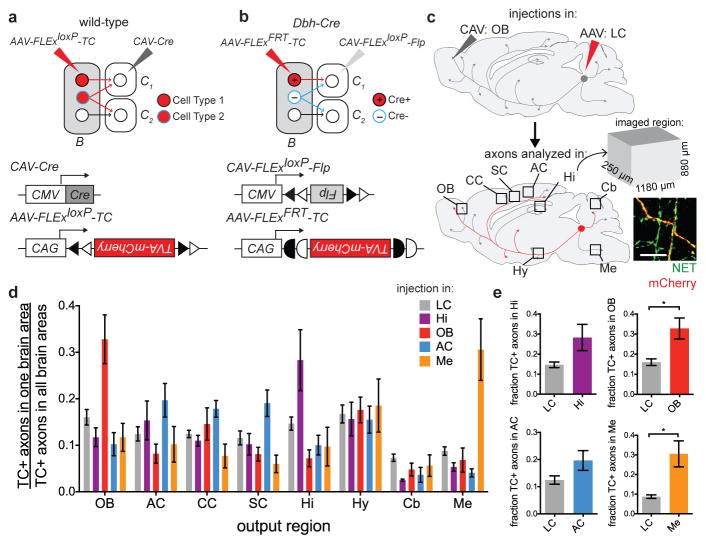
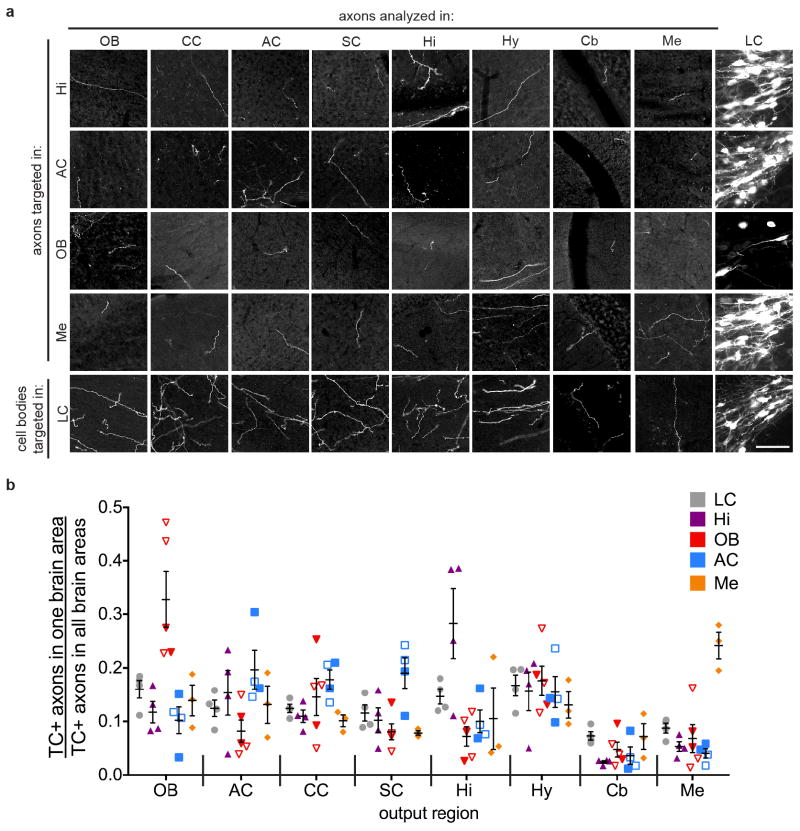
We next explored the output architecture of LC-NE neurons (Fig. 1a–b, right). Previous dual-retrograde-tracer experiments indicated that individual LC-NE neurons could project to two brain regions far apart19–21, but did not examine collateralization between more than two output regions in a given experiment. We devised a general method for tracing output divergence of specific neuronal populations based on their projection to one output site (Fig. 4a, 4b). We found that populations of LC-NE neurons projecting to the olfactory bulb, auditory cortex, hippocampus, or medulla also projected to all 7 additional brain regions analyzed (Fig. 4c, 4d, Extended Data Fig. 10). Thus, the output of LC-NE neuronal populations is highly divergent, resembling the broadcast model (Fig. 1b, right) much more than the discrete output model (Fig. 1a, right). We nevertheless found a general trend of increased axon density when labeling was initiated in output regions compared to labeling initiated from the LC, with the bias from olfactory bulb- or medulla-initiated labeling reaching statistical significance (Fig. 4e). This suggests that LC-NE neurons projecting to the olfactory bulb or medulla contain populations with biased output to these regions, consistent with the observation that LC-NE neurons projecting to these regions have a biased distribution along the dorsoventral axis in the LC (Extended Data Fig. 7a).
Figure 4. Broad output divergence of LC-NE neurons revealed by projection-based viral-genetic labeling.
a, In this strategy, neurons in region B projecting to the C region where CAV-Cre is delivered are labeled, including their collaterals to other output regions (e.g., blue neurons to C2). b, In this strategy, only Cre+ neurons in region B projecting to the C region where CAV-FLExloxP-Flp is delivered are labeled. c, Schematic for data in (d). In this example, CAV was injected in the OB and TC was injected in the LC. TC+ LC-NE axons were imaged in the designated brain regions. All TC+ axons were co-stained with anti-norepinephrine transporter (NET; inset), confirming their NE identity. d, Average normalized fraction of TC+ LC-NE axons in each brain region when CAV was injected into four output sites, or Cre-dependent TC was injected directly into the LC of Dbh-Cre mice (color code on top right). LC: n=4 (Dbh-Cre); Hi: n=4 (Dbh-Cre); AC: n=4 (2 wt, 2 Dbh-Cre); OB: n=5 (3 wt, 2 Dbh-Cre); Me: n=4 (Dbh-Cre). LC-NE neurons labeled in each condition were: 855±102 (LC, n=4); 235±35 (Hi, n=4); 80±31 (OB, n=5); 114±31 (AC, n=4); 202±63 (Me, n=4). e, Comparison of the fraction of TC+ axons at CAV injection sites between projection-based and direct LC labeling methods. Unpaired two-tail t-tests. *, p<0.05. Error bars, s.e.m. Scale, 10 μm. Abbreviations: AC, auditory cortex; CC, cingulate cortex; Cb, cerebellum; Hi, hippocampus; Hy, hypothalamus; LC, locus coeruleus; Me, medulla; OB, olfactory bulb; SC, somatosensory cortex.
Our study provides the first whole-brain quantitative analysis of synaptic input onto LC-NE neurons (Fig. 2i, Fig. 3b, Supplementary Table 2). While the total input encompasses brain regions that control cognitive, autonomic, endocrine, and somatic motor activities22, LC-NE neurons receive abundant input from motor-related nuclei in the midbrain, pons, medulla, and cerebellum (Fig. 3b). Our viral-genetic tools also revealed a highly extensive output divergence (Fig. 4d). Together with input convergence, this likely explains the largely indiscriminate input–output relationship of LC-NE neurons (Fig. 3b). This property fits well with a primary function of the LC-NE neurons in regulating states of the entire brain during sleep/wake cycles and arousal3,23–25.
Despite the overall integrative nature, however, our data also revealed specificity in the input–output relationships of LC-NE sub-circuits. Medulla-projecting LC-NE neurons receive disproportionally smaller input from the central amygdala than LC-NE neurons projecting to other regions (Fig. 3b). Input from the central amygdala to the LC is an important component for initiating stress response26. Our observation implies that modulation of medulla by LC-NE neurons is preferentially immune to this type of stress input. While our output studies demonstrated the broad projection pattern of LC-NE neurons, they also highlighted specificities both in regard to biased cell body distribution within the LC (Extended Data Fig. 7a) and biased projections (Fig. 4e). The existence of such input–output specificity, along with differential distribution of adrenergic receptors in target neuronal populations4, enables the LC-NE circuit to selectively modulate specific targets.
The viral-genetic tools we described here can be applied to other circuits in the mammalian brain, such as motor cortex (Fig. 1, Extended Data Fig. 2). TRIO and particularly cTRIO have extended previous projection-selective targeting methods27–29 for analyzing complex circuits in the CNS. Furthermore, intersecting projection and cell type using CAV-FLExloxP-Flp and numerous Cre transgenic mice can refine genetic access to specific populations of neurons to record and functionally manipulate their activity30.
METHODS
Animals
Dbh-Cre mice31 and Rbp4-Cre transgenic mice14 were obtained from the Mutant Mouse Regional Resource Center. Purkinje cell protein 2 (Pcp2)-Cre32 and the ROSA26Ai14 Cre-dependent tdTomato reporter (Ai14)16 were obtained from the Jackson Laboratories. Mice were housed on a 12-hour light/dark cycle with food and water ad libitum. Transgenic mice were of a mixed genetic background, and there was a similar distribution of male and female mice included in all experiments. Wister Rats were purchased from Japan SLC (Hamamatsu, Japan). All rats used for experiments were female. All procedures for mice followed animal care guidelines approved by Stanford University’s Administrative Panel on Laboratory Animal Care (APLAC). All rat experiments were performed in accordance with the animal care and use committee guidelines of the University of Tokyo.
DNA Constructs
CAG-FLExloxP-G and CAG-FLExloxP-TC (same as CAG-FLEx-TCB) have been described previously10. CAG-FLExFRT-G and CAG-FLExFRT-TC were constructed using standard molecular cloning methods with enzymes from New England Biolabs (Ipswich, USA). The custom DNA fragment (389bp) shown below was synthesized by DNA 2.0 (Menlo Park, USA). This DNA fragment contained restriction enzyme sites and two heterospecific pairs of FRT (shown by underline) and FRT5 (shown by bold italic) in the following order: 5′-NotI-MluI-KpnI-FRT-FRT5-SalI-AscI-FRT(complementary)-FRT5(complementary)-HindIII-SpeI-NotI, with the sequence as follows: 5′-GCGGCCGCACGCGTACGTGGTACCGAAGTTCCTATTCCGAAGTTCCTATTCTCTAGAAAGTATAGGAACTTCATCAAAATAGGAAGACCAATGCTTCACCATCGACCCGAATTGCCAAGCATCACCATCGACAGAAGTTCCTATTCCGAAGTTCCTATTCTTCAAAAGGTATAGGAACTTCGTCGACAATTGGCGCGCCGAAGTTCCTATACTTTCTAGAGAATAGGAACTTCGGAATAGGAACTTCCGTTGGGATTCTTCCTATTTTGATCCAAGCATCACCATCGACCCTCTAGTCCAGATCTCACCATCGACCCGAAGTTCCTATACCTTTTGAAGAATAGGAACTTCGGAATAGGAACTTCAAGCTTAATTACTAGTGCGGCCGC
This DNA fragment was cloned into the modified pBluescript II SK vector that contains only a NotI recognition sequence in the cloning site. We serially inserted into this pBluescript the following DNA fragments by using the unique restriction sites. (1) HindIII-SpeI fragment containing the WPRE and human growth hormone polyA signal obtained from pAAV-TRE-HTG (addgene#27437)33. (2) MluI/KpnI fragment containing the CAG promoter. To make this fragment, we sub-cloned PstI-XmaI flanked CAG promoter from pCA-T-int-G (addgene# 36887)34 into a modified pBluescript II SK vector that only contains MluI-PstI-XmaI-KpnI recognition sequence in the cloning site. (3) AscI/SalI fragment containing coding sequence of G or TC cassette, obtained from pAAV CAG-FLExloxP-G (addgene#48333) or pAAV CAG-FLExloxP-TC (addgene# 48332)10. The assembled cassettes were sub-cloned into pAAV-MCS (AAV helper free system, Stratagene, Cat# 240071-12) using the NotI sites. Flp-dependent mCherry expression from CAG-FLExFRT-TC was confirmed by transient transfection into cultured HEK293 cells by using a Flp expressing plasmid (data not shown). To generate CAV-FLExloxP-Flp, we first constructed the CAV targeting vector pCAV-FLExloxP-Flp. AscI-SalI flanking Flpo coding sequence was PCR amplified by using pBT340 (addgene# 52549) as a template and sub-cloned into SalI-AscI site of a precursor of pAAV CAG-FLExloxP-TCB (ref. 10) that does not contain WPRE-polyA signal. XmaI-NotI fragment containing FLExloxP-Flp was then subcloned into KpnI-NotI site of pCL20c lentivirus vector35 by using blunt end ligation. EcoRI-SpeI fragment containing FLExloxP-Flp was then subcloned into EcoRI-EcoRV site of pTCAV-12vk (description available upon request to E.J.K.) by using one side (SpeI site) blunt end ligation, resulting in pCAV-FLExloxP-Flp.
Virus Preparations
All viral procedures followed the Biosafety Guidelines approved by the Stanford University Administrative Panel on Laboratory Animal Care (A-PLAC), Administrative Panel of Biosafety (APB), and equivalent committees of the University of Tokyo. Recombinant AAV vectors (serotype 5 for TC and serotype 8 for G) were produced in the Stanford University or University of North Carolina Viral Core. The AAV titer was estimated to be 2.6 and 1.3 × 10¹² viral particles/ml for CAG-FLExFRT-TC and CAG-FLExFRT-G, based on quantitative PCR analysis. RVdG was prepared as previously described36. The pseudotyped RVdG titer was estimated to be ~5 × 10⁹ infectious particles/ml based on serial dilutions of the virus stock followed by infection of the 293-TVA800 cell line. The recombinant CAV-Cre and CAV-FLExloxP-Flp were generated, expanded, and purified by previously described methods37. The final titer of CAV-Cre and CAV-FLExloxP-Flp were 2.5 × 10¹² and 5 × 10¹² viral particle/ml, respectively. All handling of CAV and rabies virus followed procedures approved by Stanford University’s Administrative Panel on Biosafety (APB) for Biosafety Level 2, and the equivalent committees of the University of Tokyo (P2/P2A).
Locus Coeruleus (LC) Trans-synaptic Input Tracing
Experiments in Fig. 2 were performed in Dbh-Cre mice at 8–12 weeks of age following procedure as described previously10,38. Mice were anesthetized with 65 mg/kg ketamine and 13 mg/kg xylazine (Vedco/Lloyd Laboratories) via intra-peritoneal injection. ~0.5 μl of a 1:1 mixture of AAV8 CAG-FLExloxP-G and AAV5 CAG-FLExloxP-TC were injected into the left LC of the mouse using stereotaxic equipment (Kopf). The coordinates were 0.8 mm lateral from midline, 0.8 mm posterior from Lambda, and 3.2 mm ventral from the surface of the brain. Two weeks later, 0.3–0.5 μl RVdG was injected into the same area of the LC using the procedure described above. After recovery, mice were housed in a biosafety-level-2 (BSL2) facility for 4 days before sacrificing.
Assessment of LC Terminal Infectivity by CAV-Cre
Experiments in Extended Data Fig. 4 and 7 were performed in Ai14 mice 6–8 weeks of age. Mice were anesthetized and injected, as described above, with 0.25–0.5 μl CAV-Cre plus 0.02 μl green retrobeads (Lumofluor, USA) into predicted LC output sites: olfactory bulb (OB), auditory cortex (AC), hippocampus (Hi), medulla (Me), or cerebellum (Cb). The coordinates used for CAV-Cre injection sites are listed as measurements from Bregma for OB, AC, and Hi, and from Lambda for Me and Cb. Ventral measurements are from the surface of the brain. OB: 0.75 mm lateral, 4.0 mm anterior, 1 mm ventral; AC: 4.2 mm lateral, 2.5 mm posterior, 0.8 mm ventral; Hi: 1.5 mm lateral, 2 mm posterior, 1.5 mm ventral; Me: 0.75 mm lateral, 3.3 mm posterior, 3.5 mm ventral; Cb: 2.0 mm lateral, 3.0 mm posterior, 1.5 mm ventral. After recovery, mice were housed in a BSL2 facility for 5–7 days before being sacrificed.
Locus Coeruleus Projection-based Viral Labeling
Experiments in Fig. 4 and Extended Data Fig. 10 were performed in wild-type (wt) or Dbh-Cre mice 8–12 weeks of age. Mice were anesthetized and injected with ~0.25 μl AAV5-expressing TC (CAG-FLExloxP-TC for wt or CAG-FLExFRT-TC for Dbh-Cre mice) into the left LC as described above. Mice were also injected with ~0.5 μl CAV-Cre (wt mice) or CAV-FLExloxP-Flp (Dbh-Cre mice) at LC output sites in the ipsilateral hemisphere (OB, AC, Hi, Me; coordinates listed above). After recovery, mice were housed in a BSL2 facility for 3–4 weeks before sacrificing.
Locus Coeruleus TRIO and cTRIO
Experiments shown in Fig. 3 were performed in wt (TRIO) or Dbh-Cre (cTRIO) mice at 8–12 weeks of age. For TRIO, mice were anesthetized and injected with ~0.5 μl of a 1:1 mixture of AAV8 CAG-FLExloxP-G and AAV5 CAG-FLExloxP-TC into the left LC, and also injected with ~0.5 μl CAV-Cre into ipsilateral OB, Hi, or AC using coordinates described above. For cTRIO, mice were anesthetized and injected with ~0.5 μl of a 1:1 mixture of AAV8 CAG-FLExFRT-G and AAV5 CAG-FLExFRT-TC into the left LC, and also injected with ~0.5 μl CAV-FLExloxP-Flp into either ipsilateral Cb or Me using coordinates described above. After recovery, mice were housed in a BSL2 facility. Two weeks later, 0.3–0.5 μl RVdG was injected into the LC using the procedure described above. After recovery, mice were housed in a BSL2 facility for 4 days before sacrificing.
Motor Cortex TRIO and cTRIO
Experiments in Fig. 1 were performed in wt (TRIO) or Rbp4-Cre (cTRIO) mice at 8–12 weeks of age. For TRIO, mice were anesthetized and injected with ~0.5 μl of a 1:1 mixture of AAV8 CAG-FLExloxP-G and AAV5 CAG-FLExloxP-TC into the left motor cortex (MC), and also injected with ~0.5 μl CAV-Cre into contralateral MC using the following coordinates from Bregma: 1.5 mm lateral, 1.5 mm anterior, 0.8 mm ventral from the surface of the brain. For cTRIO, Rbp4-Cre mice were anesthetized and injected with ~0.5 μl of a 1:1 mixture of AAV8 CAG-FLExFRT-G and AAV5 CAG-FLExFRT-TC into the coordinates described above (for cMC), or the following coordinates for medulla (from Lambda): 1 mm lateral, 3 mm posterior, 4 mm ventral from the surface of the brain. After recovery, mice were housed in a BSL2 facility. Two weeks later, 0.3–0.5 μl RVdG was injected into MC. After recovery, mice were housed in a BSL2 facility for 4 days before sacrificing.
Rat MC TRIO
For TRIO experiments in rat (Extended Data Fig. 2), ~0.4 μl of a 1:1 mixture of AAV2 CAG-FLExloxP-G and AAV2 CAG-FLExloxP-TC was injected into the brain of ~5 week old Wister rat using stereotaxic equipment (Narishige, Japan). During surgery, animals were anesthetized with 65 mg/kg ketamine and 13 mg/kg xylazine. For MC injections, the needle was placed 2.5 mm anterior and 2.3 mm lateral from the Bregma, and 0.9 mm ventral from the brain surface. ~0.5 μl CAV-Cre was injected subsequently into either the ipsilateral striatum (1.0 mm posterior and 4.0 mm lateral from the Bregma, and 4.0 mm ventral from the brain surface) or the contralateral MC. After recovery, animals were housed in a BSL2 room. Two weeks later, 0.3 μl RVdG was injected into the AAV injection site under anesthesia. After recovery, animals were housed in a BSL2 room for 4 days before sacrificing.
Control TRIOs
Control experiments (Extended Data Fig. 1, 2, 5, and 8) were performed using conditions described above for LC and MC experiments.
Characterizing CAV-Cre Spread in the Piriform Cortex
To test the extent of local spread of CAV-Cre in the injection site (Extended Data Fig. 3), ~0.3 μl CAV-Cre plus ~0.025 μl green retrobeads (Lumofluor, USA) were injected into the anterior piriform cortex or surrounding areas of adult mice heterozygous for the Ai14 Cre reporter. During surgery, animals were anesthetized with 65 mg/kg ketamine and 13 mg/kg xylazine. The stereotactic coordinates were anterior 1.7 mm from the Bregma; lateral 1.7–2.8 mm from the midline; ventral 2.5–4.0 mm from the surface of the brain. One week after the injection, animals were perfused and brain tissue was processed and sectioned as described in Histology and Imaging. 60-μm coronal sections through the olfactory bulb until the end of anterior piriform cortex (APC) were collected. The needle location was visualized by the presence of concentrated retrobeads. The distance between the needle tip and the nearest layer 1 of anterior piriform cortex or lateral olfactory tract was measured. In the main and accessory olfactory bulb, the number of tdTomato+ cells was counted either in every section (when total number of labeling < ~1000 cells) or in every other section (when total the number of labeling > ~1000 cells).
Histology and Imaging
For all tracing analyses and CAV-Cre infectivity analyses (Fig. 1–4, Extended Data Fig. 1–5, 6a, 7, 8, and 10) animals were perfused transcardially with phosphate-buffered saline (PBS) followed by 4% paraformaldehyde (PFA) in PBS. Brains were dissected, post-fixed in 4% PFA for 24 hours, and placed in 30% sucrose in PBS for 24–48 hours. After embedding in Optimum Cutting Temperature (OCT, Tissue Tek), samples were stored at −80°C until sectioning. For Fig. 1–3, Extended Data Fig. 1–6a, and 8, consecutive 60-μm coronal sections were collected onto Superfrost Plus slides, washed 2 × 20 min with PBS, and stained with DAPI (1:10,000 of 5 mg/mL, Sigma-Aldrich), which was included in the last PBS wash. Slides were coverslipped with Fluorogel (Electron Microscopy Sciences). Samples were imaged using a Leica Ariol slide scanner with the SL200 slide loader. Briefly, the scanner first imaged slides using a 1.25X objective and the ‘TissueFind’ function to generate composite brightfield images of the entire slide. Then, the scanner automatically detected individual tissue sections from these brightfield images (~15–20 coronal tissue sections per slide), and performed automated tiled imaging of each tissue section on the slide in two channels (DAPI and Spectrum Green filters) using a 5X objective. Each tile was approximately 1.2 mm by 1.2 mm, and included ~20-μm overlap between tiles. Leica Ariol software automatically stitched together individual tiles during image collection to generate a composite SCN file of the entire slide. For analysis of LC output (Fig. 4, Extended Data Fig. 10), every 50-μm sagittal section within the brain regions designated for analysis were collected sequentially into PBS. Sections were washed 2 × 10 min in PBS and blocked for 2–3 hours at room temperature (RT) in 10% normal donkey serum (NDS) in PBS with 0.3% Triton-X100 (PBST). Primary antibodies (mouse anti-norepinephrine transporter (NET), PhosphoSolutions, 1447-NET, 1:10000; rat anti-mCherry, M11217, Invitrogen, 1:2000) were diluted in 5% NDS in PBST and incubated for four nights at 4°C. After 3 × 10 min washes in PBST, secondary antibodies were applied for 2–3 hours at room temperature (donkey anti-mouse, Alexa-488, and donkey anti-rat Cy3, Jackson ImmunoResearch), followed by 3 × 10min washes in PBST. Sections were additionally stained with DAPI. For immunostaining of LC neuron cell bodies (Extended Data Fig. 5 and 7), 50-μm coronal sections through the LC were collected into PBS. Sections were washed, immunostained, and mounted as described above, using a primary antibody for tyrosine hydroxylase (rabbit anti-tyrosine hydroxylase (TH), Millipore, AB152, 1:2000). All images were processed using NIH ImageJ software. For gephyrin immunostaining (Extended Data Fig. 6), fresh tissue was processed and 14-μm horizontal sections were collected through the LC following ‘Method B’ in a previously published protocol39. Sections were immunostained with primary antibodies for gephyrin (mouse anti-gephyrin, Synaptic Systems, 147011, 1:700), and tyrosine hydroxylase (Millipore, 1:2000). Representative images in Fig. 1f (top and middle), Extended Data Fig. 1, Extended Data Fig. 4, Extended Data Fig. 5c, d, Extended Data Fig. 6b, c (left), Extended Data Fig. 7a, c, Extended Data Fig. 8a, b (bottom), and Extended Data Fig. 10a were obtained on a Zeiss epifluorescence microscope with a Nikon CCD camera. Representative images in Fig. 2b (inset), Fig. 4c (inset), Extended Data Fig. 5a, Extended Data Fig. 6b (right), c (middle and right), and Extended Data Fig. 7a (inset) were obtained on a Zeiss LSM 780 confocal microscope. Representative images in Fig. 1f (bottom), Fig. 2b–h, and Extended Data Fig. 6a were obtained on a Leica Ariol slide scanner with the SL200 slide loader. Representative images in Extended Data Fig. 2 and 3 were obtained by cooled CCD camera (ORCA-R2, Hamamatsu Photonics) connected with a upright fluorescent microscope (4x or 10x objective, BX53, Olympus).
Data Analysis for trans-synaptic tracing and TRIO
Because each brain differed in total numbers of input neurons, we normalized neuronal number in each region by the total number of input neurons counted in the same brain. For trans-synaptic tracing and TRIO/cTRIO analyses (Fig. 1–3, and Supplementary Tables 1 and 2), GFP+ input neurons were manually counted from every 60-μm section through the entire brain, except near the starter cell location (MC or LC), as specified in Extended Data Fig. 1 and Extended Data Fig. 5. GFP+ input neurons were assigned to specific brain regions based on classifications of the Allen Brain Atlas (atlas-brain-map.org), using anatomical landmarks in the sections visualized by DAPI counterstaining and autofluorescence of the tissue itself. In a small minority of cases, assignment of input neurons to specific brain nuclei may be approximate if GFP+ cell bodies were located on borders between regions, or when anatomical markers were lacking between directly adjacent regions (such as hypoglossal nucleus/nucleus prepositus or lateral reticular nucleus/gigantocelluar reticular nucleus). However, quantitative analyses of input tracing results (Fig. 1–3) were performed on anatomical classifications (specified by the Allen Brain Atlas) that were at least one hierarchical level broader than the discrete brain regions in which GFP+ cells were originally assigned to. For instance, the fraction of GFP+ cells designated to “paraventricular hypothalamic nucleus” and “lateral hypothalamic nucleus” were grouped into a broader category of “hypothalamus”. In almost all cases where individual GFP+ cells were difficult to classify, their location was within brain regions that belonged to the same broad group. Also, some brain regions partially overlapped with the region excluded from analysis, such as motor and somatosensory cortex for the MC tracing/cTRIO analyses (Fig. 1g, Supplementary Table 1), and the dorsal raphe, periaqueductal gray, and pontine reticular nucleus for the LC tracing/TRIO/cTRIO analyses (Fig. 2i, Fig. 3b, and Supplementary Table 2). Therefore, the inputs reported for these regions are likely under-representations of their contribution to MC or LC input. We did not adjust for the possibility of double-counting cells in any of our quantifications, which likely results in slight over-estimates, with the amount of over-estimation depending on the size of the cell in each region quantified. Nearly all starter cells were TH+ for TRIO experiments with the CAV injection site being hippocampus (98.6%±0.8%, n=4), olfactory bulb (96.0%±2.7%, n=4), or auditory cortex (98.8%±1.2%, n=4), consistent with our observation that cells at the LC projecting to these target areas are predominantly NE neurons (Extended Data Fig. 7a). All starter cells were confirmed to be TH+ in cTRIO experiments with the CAV injection site in Cb (100%, n=4) or Me (100%, n=4).
Data Analysis for LC output
For LC output quantification (Fig. 4, Extended Data Fig. 10), images were taken from 5 consecutive sections in each of the 8 brain regions (OB, AC, CC, SC, Hi, Hy, Cb, Me) on a Zeiss epifluorescence microscope with a 10X objective. We attempted to image from identical volumes within each brain region between samples, based on predetermined coordinates for these regions and the section number, since sections were collected sequentially and kept in order. The field of view for each image was located based solely on DAPI staining so the experimenter was blind to the level of TC+ LC axons before imaging. An image was also taken of the norepinephrine transporter (NET) immunostaining in the same field of view to confirm that all TC+ axons were also NET+. For analysis, the TC channels for each image were made binary in ImageJ, after performing background subtraction and thresholding to a value ~4X greater than mean background intensity. The pixel densities of these binary images were measured and averaged (5 images per brain region) to determine the fraction of TC+ axons resulting from LC-NE neurons in each brain region, as a fraction of the total TC+ axons quantified from all of the imaged regions in that brain.
Analysis of spatial distribution in the LC
To assess the distribution of discrete LC-NE neurons within the LC dependent on their output (Extended Data Fig. 7), 50-μm coronal sections were collected in order through the LC of experimental mice and processed as described above in Histology and Imaging. The experimenter was blind to the location of the output injection site when imaging and quantifying LC sections. The outlines of the digital model were manually drawn using TH immunostaining of LC-NE cell bodies as a guide. A cross (+) marks the approximate center of each LC section following the procedure below. (1) Measure the maximal height (Hmax) of the LC (based on the shape of TH immunostaining); (2) Measure the maximum width (Wmax) of the LC at the ½ Hmax height level; (3) Place a cross at the ½Wmax position. This cross was used to align each LC image with its corresponding digital LC section, before designating the location of the tdTomato+ LC-NE cell bodies with colored dots on the digital section. Before quantifying experimental sections, two independent sets of TH-immunostained LC sections were found to fit within the boundaries of the digital model using this method of alignment. The distribution of tdTomato+ LC-NE dots from each digital section were counted and assigned to dorsal/ventral and medial/lateral sub-regions using horizontal and vertical lines drawn through the center cross of each digital section, respectively (Extended Data Fig. 7).
Input simulation
We simulated the number of input areas for the two sparsest Dbh-Cre tracing with Matlab. For each starter cell, when assuming it receives inputs from N areas, we randomly sampled N areas from the 111 input areas without replacement, weighted by the total counts of cells in each area derived from all the Dbh-Cre brains. The simulated input areas to the 4 (sparsest sample) or 22 (2nd sparsest sample) starter cells were then consolidated to generate the final number of input areas. 10000 rounds of simulations were performed for each N between 11 and 30.
Statistical Methods
No statistical methods were used to predetermine sample size. Animals were excluded from certain experiments using the following pre-established criteria. For all trans-synaptic tracing, TRIO, and cTRIO experiments in MC and LC, samples were excluded if less than 50 GFP+ neurons were observed in the brain outside of the area designated as local background. For projection-based viral genetic labeling, samples were excluded if less than 10 LC-NE neurons were observed to be TC+. No method of randomization was used in any of the experiments. For ANOVA analyses, the variances were similar as determined by Brown-Forsythe test.
Extended Data
Extended Data Figure 1. Controls for TRIO and cTRIO at the motor cortex (MC).
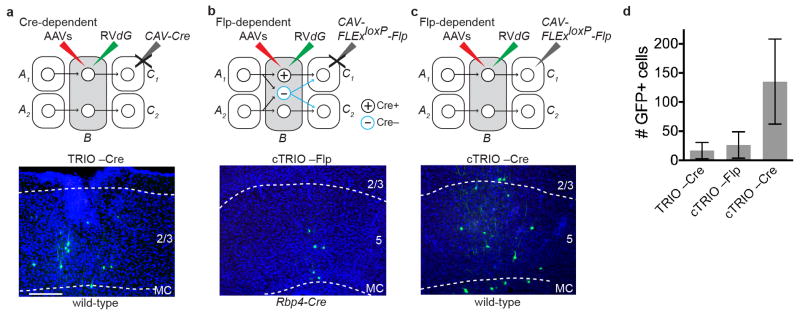
a–c, Negative control experiments omitting CAV-Cre for TRIO (a), and omitting CAV-FLExloxP-Flp (b) or the Rpb4-Cre transgene (c) for cTRIO showed only local non-specific infection of RVdG. This background labeling is likely due to Cre- or Flp-independent leaky expression of a small amount of TVA-mCherry (TC), too low for mCherry to be detected but still capable of permitting infection by EnvA-pseudotyped RVdG due to the high sensitivity of TVA10. d, Quantification for three controls (n=4, 4, 7, respectively). (By comparison, 672 GFP+ neurons were counted in the same region for an experimental brain that has the lowest starter cells among the 11 brains whose data were used for quantitative analysis of MC TRIO input tracing.) These background cells were restricted within ~500 μm of the injection site. Because of these observations, GFP+ cells on sections within ~600 μm of the injection site were excluded from the input analysis in Fig. 1g. Scale, 100 μm. Error bars, s.e.m.
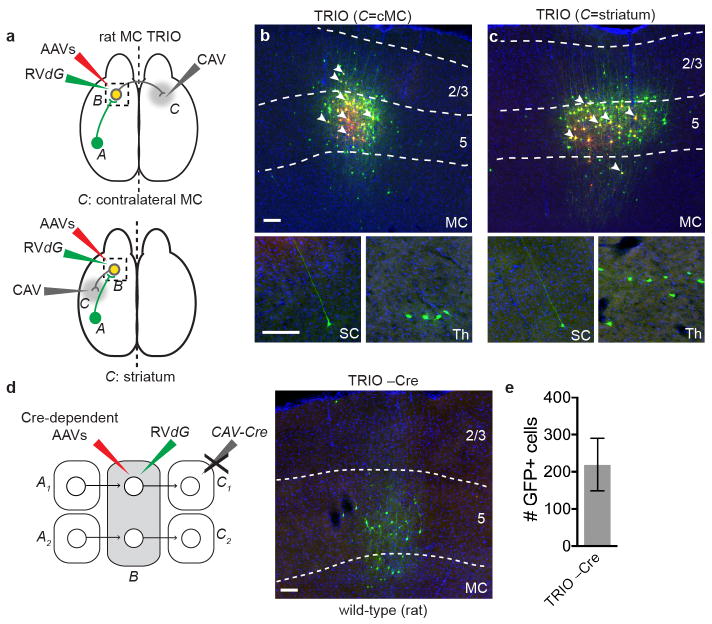
Extended Data Figure 2. TRIO applied to rat primary motor cortex.
a, Schematic of injection sites used for TRIO in rat MC (see Fig. 1c for details of the viruses). Two different C regions were tested: striatum or contralateral MC (cMC). b, c, Coronal section of rat MC stained with DAPI (blue). Starter pyramidal neurons projecting to contralateral MC (b) or striatum (c) (yellow, a subset indicated by arrowheads) can be distinguished from neurons receiving CAV-Cre and AAV-FLExloxP-TC (red) or GFP from RVdG (green). Bottom insets, coronal sections showing representative presynaptic GFP+ cells in somatosensory cortex (SC) or thalamus (Th). These data indicate that callosal-projecting neurons and striatum-projecting neurons in rat MC both receive direct synaptic input from somatosensory cortex and thalamus (n=2 for cMC C region; n=3 for striatum C region). d, e, Omitting CAV-Cre for TRIO in the rat also resulted in local non-specific infection of RVdG. On average ~200 cells were observed (n=4) within 800 μm from the injection site in these control experiments. By comparison, 1392 GFP+ neurons were counted in the same region of a TRIO sample that has the lowest starter cells among the 5 brains analyzed. Scale, 100 μm. Error bars, s.e.m.
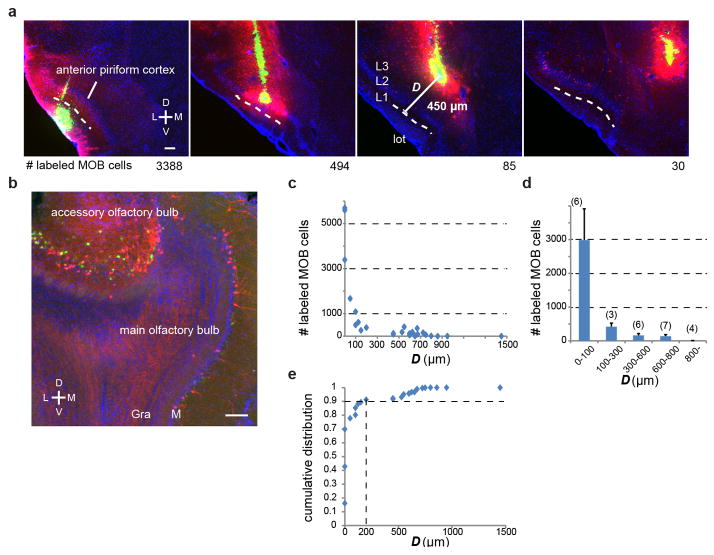
Extended Data Figure 3. Evaluation of CAV-Cre spread by using the OB→APC projection.
a, Four representative 60-μm coronal sections of the CAV-Cre injection site in the anterior piriform cortex (APC) of four Ai14 Cre reporter mice. Red, tdTomato; green, retrobeads; blue, DAPI. The location of the injection site was readily visualized by concentrated retrobeads. L, lateral; M, medial; D, dorsal; V, ventral. In each mouse, we determined the minimal distance (D) between the injection site and layer 1a of the piriform cortex, where mitral cell axons terminate, or lateral olfactory tract, where mitral cell axon bundles are present. Dashed lines represent the boundary between layer 1a and layer 1b. For each sample, we counted the number of tdTomato-labeled mitral cells (numbers below each image) from serial OB sections. b, An example 60-μm coronal section of the OB. Both tdTomato and retrobead signals were found to be mostly restricted to the mitral cell layer (M) of the main olfactory bulb (MOB) and accessory olfactory bulb (AOB) with minor labeling in the granule cell layer (Gra). As AOB mitral cells do not form synapses in the APC, this observation indicates that CAV-Cre can infect axons-in-passage. c, Distribution of D among 26 injections (x-axis) and relationship between D and the numbers of labeled cells in the MOB (y-axis). d, Histogram based on (c). Dense labeling (over 1000) was obtained only when D < 100 μm. CAV-Cre injections with D > 800 μm rarely labeled the OB (2.8±1.9 cells/bulb, n=4). e, Cumulative distribution plot of MOB cell counts. A sample of the 9th smallest D (D = 200μm) reached 90% of the labeling (indicated by vertical dotted line) detected in all 26 samples, suggesting that given our sample distribution, ~90% of axonal transduction occurred within 200 μm from the CAV-Cre injection site. Scale, 100 μm. Error bars, s.e.m.
Extended Data Figure 4. Evaluation of retrograde infection by CAV-Cre.
a, Representative images of the injection sites where CAV-Cre plus retrobreads were delivered into the olfactory bulb, dorsal hippocampus, auditory cortex, cerebellum, or medulla of the Ai14 Cre reporter mice (see Methods for coordinates). Red, tdTomato; green, retrobeads; blue, DAPI. tdTomato labeling was densest at the injection site, and corresponded with the presence of retrobeads. We did not observe dense tdTomato or retrobeads labeling in other brain regions adjacent to the injection site unless these sites sent direct projections to the injection site, indicating that for our experiments, CAV-Cre was efficiently and specifically delivered to the targeted brain regions. n=4 per injection site. b, Representative coronal sections of brain regions that contained tdTomato+ labeling of specific cell populations known to project to CAV-Cre injection sites. Below is a partial list: neurons projecting to OB (1st column): ipsi- and contralateral anterior olfactory nucleus (AON), piriform cortex (Pir), nucleus of the lateral olfactory tract (nLOT), but not contralateral OB; to dorsal hippocampus (2nd column): lateral and medial septum (LS, MS) and entorhinal cortex (Ent); to auditory cortex (3rd column): somatosensory cortex (SC), entorhinal cortex (Ent), and medial geniculate nucleus (MGN); to cerebellum (4th column): contralateral pontine nuclei (PN) and inferior olive (IF); to medulla (5th column): insular cortex (Ins), central amygdala (CeA), and paraventricular hypothalamic nucleus (PVH). Coronal images are composites generated from two overlapping tiled images. Insets show high magnification images of boxed regions. Bottom, sagittal schematic of the CAV-Cre injection sites (a) and the approximate location of the two representative coronal sections above. Scale, 1 mm; inset, 100 μm.
Extended Data Figure 5. Controls for Dbh-Cre-based trans-synaptic tracing and TRIO analysis in LC.
a, A Representative coronal section of the LC from a mouse heterozygous for Dbh-Cre and Ai14 Cre reporter transgenes. Sections were labeled with an antibody against tyrosine hydroxylase (TH), an enzyme in the biosynthetic pathway for norepinephrine (green), while cells expressing Cre recombinase are visible by expression of tdTomato (red). b, Quantification of the number of tdTomato+ neurons in the LC that were also labeled by TH antibody (n=3). Every 50-μm section through the LC was collected for quantification. Qualitatively, all TH+ cells expressed tdTomato; however, we cannot determine quantitatively because we could not accurately count TH+ cells due to dense process staining. c, Top, schematic for negative control where AAVs that express Cre-dependent TC and G were injected into the LC of wild-type mice, followed by injection of RVdG. Middle, coronal section of the LC stained with DAPI (blue) shows a small number of GFP+ neurons at the injection site. The dotted rectangle highlights GFP+ neurons magnified in the bottom panel. d, Top, in this negative control, Dbh-Cre mice received Cre-dependent TC (without G) via AAV injection into the LC, followed by RVdG. Middle, a coronal section of the LC stained with DAPI (blue) shows infection of Cre+ LC neurons with TC (red) or TC and RVdG (yellow) at the injection site. The dotted rectangle highlights infected LC neurons magnified in the bottom panel. Most green cells are also red. No GFP+ cells were observed outside the region immediately adjacent to the injection site, indicating that trans-synaptic tracing depends on G. e, Quantification of the number of GFP+ cells (c), or GFP+ cells that did not colocalize with TC (d), that were observed in the experiments described in (c, n=8) and (d, n=6). By comparison, 1381 GFP+ neurons were counted in the same region for an experimental brain that has the median number of starter cells among the 9 brains. For explanation of background labeling, see Extended Data Fig. 1a–c. In either case, no GFP+ neurons were visible > 800 μm away from the injection site. f, Schematic of brain regions quantified for presynaptic GFP+ neurons. Regions approximately 800 μm anterior and posterior to the center of the LC were excluded from analysis due to local background labeling from TC and GFP. Scale, 50 μm (a), 1 mm (c, d, middle panels), 100 μm (c, d, bottom panels). Error bars, s.e.m.
Extended Data Figure 6. Purkinje cell axons contact NE processes in the LC.
a, Coronal sections counterstained with DAPI (blue) showing representative GFP+ Purkinje cells (green) from Dbh-Cre trans-synaptic tracing experiments described in Fig. 2. Labeled Purkinje cells span the anterior-posterior axis, but are enriched in the medial portion of the ipsilateral cerebellum. b, Sagittal section through the LC of mice heterozygous for the transgenes Pcp2-Cre and Ai14, in which tdTomato (tdT) expression was restricted to cerebellar Purkinje cells and their processes (red). Sections were labeled with DAPI (blue) and anti-TH antibody (green) to label LC-NE neurons. The right panel is a maximum-projection confocal stack taken with a 40X objective of the boxed region in the left panel. Purkinje cell axons are intermingled with TH+ LC neurons and their processes. c, Left, Representative image of a horizontal section collected through the LC of a mouse heterozygous for the transgenes Pcp2-Cre and Ai14. Sections were stained with anti-TH antibody (green) to label LC-NE neurons and their processes, and anti-gephyrin (geph) antibody (white) to label inhibitory post-synaptic densities. Middle, maximum-projection confocal stack taken with a 40X objective of the dashed box of the left panel showing the overlap between tdTomato+ Purkinje cell axons and TH+ LC processes. Right, high magnification of the dashed box of the middle panel, showing that several of these contact points also contained gephyrin+ puncta (arrowheads) within green processes apposing the red processes, consistent with GABAergic Purkinje cell axons forming synapses onto dendrites of TH+ LC-NE neurons. Images in (a) were derived from larger composite images generated by a Leica Ariol Slide Scanner. D, dorsal; V, ventral; A, anterior; P, posterior; L, lateral; M, medial.
Extended Data Figure 7. Spatial distribution of LC-NE neurons projecting to distinct output brain regions.
a, Representative images of individual LC-NE neurons labeled within the LC by injection of CAV-Cre at specific output sites (see Extended Data Fig. 4a) in Ai14 Cre reporter mice. Coronal sections through the LC were collected in order and stained with anti-TH antibody (pseudocolored in green). All tdTomato+ neurons within the LC were also TH+, and many of these cells also contained retrobeads (green in inset). Injection of CAV-Cre into the olfactory bulb, hippocampus, or auditory cortex resulted in high tdTomato expression in NE+ neurons within the LC, while tdTomato labeling was almost completely absent in adjacent brain regions, indicating that regions next to the LC contribute minimal projections to these output sites. However, CAV-Cre injected into the cerebellum or medulla labeled NE+ LC neurons as well as adjacent, NE− cell populations (a subset of which are highlighted by arrowheads). b, The locations of tdTomato+ LC-NE neurons from sequential 50-μm coronal sections collected through the entire LC were transferred to corresponding sections of a digital LC model and are represented by colored dots (see Methods). c, Schematic of the dorsal/ventral and medial/lateral classifications used with tdTomato+ LC-NE neurons occurring from CAV-Cre injections into the olfactory bulb (left) or cerebellum (right) of Ai14 mice. These classifications were made by drawing horizontal and vertical lines through the cross (b) designating the middle of each LC section. d, Quantification of the fraction of tdTomato+ LC-NE cells in each LC section along the anterior–posterior axis of the LC. No significant differences were observed for the anterior–posterior distribution of tdTomato+ LC-NE neurons projecting to different output sites. e, Quantification of the medial–lateral distribution of LC-NE neurons projecting to different output sites. LC-NE neurons showed no bias in the medial vs. lateral portion of the LC, regardless of where they sent projections. f, Quantification of the dorsal–ventral distribution of tdTomato+ LC-NE neurons projecting to different output sites. While no bias was observed in the posterior LC, significant differences were observed in the anterior- and mid-LC. Specifically, LC-NE neurons projecting to the forebrain showed a dorsal bias for tdTomato+ cell labeling within the anterior LC, whereas LC-NE neurons projecting to the cerebellum and medulla were located in more ventral portions of the anterior- and mid-LC. n=4 samples per CAV injection site. Data in (d) was analyzed with 1-way ANOVA. Data in (e, f) were analyzed by first performing 2-way ANOVA, which did not uncover any significance in the medial/lateral bias of tdTomato+ LC-NE neurons. Two-way ANOVA determined that 1) the location of the CAV injection site contributes to the dorsal/ventral bias of tdTomato+ LC-NE neurons within the LC (p < 0.0001), 2) there is interaction between the CAV injection site and the location (anterior, mid, posterior) of tdTomato+ NE neurons within the LC (p = 0.0389), and 3) the LC subdivisions themselves did not significantly contribute to the variance observed in tdTomato+ LC-NE neurons. 1-way ANOVA and post hoc Tukey’s multiple comparison were then performed to test the significance of dorsal/ventral bias in each LC region based on CAV injection sites. Scale, 50 μm. Error bars=s.e.m. *, p<0.05; **, p<0.01, ***, p<0.001.
Extended Data Figure 8. Controls for LC cTRIO.
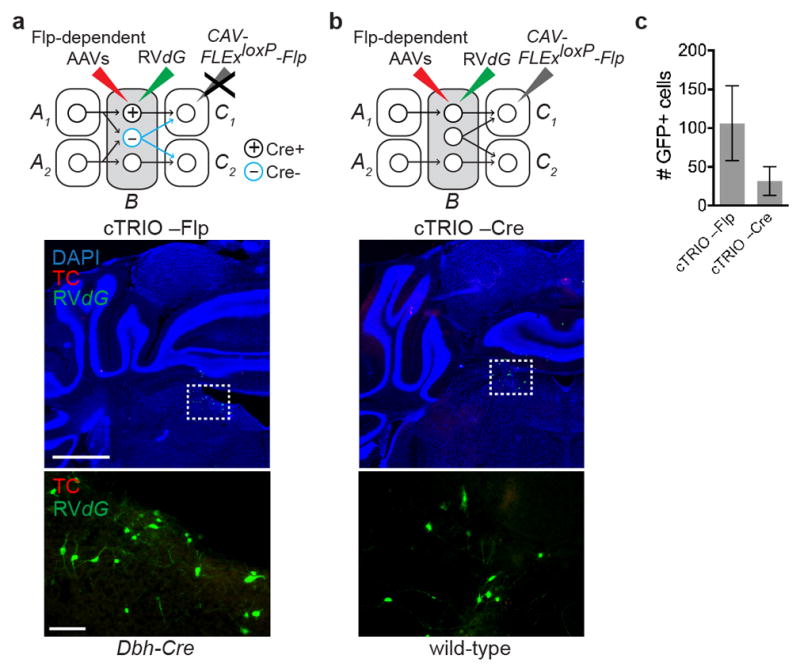
a, Top, schematic for negative controls where AAVs expressing Flp-dependent TC and G were injected into the LC of Dbh-Cre mice, followed by RVdG injection into the LC, but the CAV-FLExloxP-Flp injection was omitted. Middle, coronal section of the LC stained with DAPI (blue) shows a small number of GFP+ neurons at the injection site. The dotted rectangle highlights GFP+ neurons magnified in the lower panel. b, Top, schematic for negative control where CAV-FLExloxP-Flp was injected into the olfactory bulb and AAVs expressing Flp-dependent TC and G were injected into the LC of wild-type mice, followed by RVdG injection; hence there was no Cre to mediate Flp expression in LC cells. Middle, coronal section of the LC stained with DAPI (blue) shows a small number of GFP+ neurons at the injection site. The dotted rectangle highlights GFP+ neurons magnified in the lower panel. c, Quantification of GFP+ background labeling in the LC (n=4 and 8). This labeling is likely caused by leaky TVA expression as discussed in Extended Data Fig. 1. In none of these control experiments did we observe GFP+ or TC+ neurons > 800 μm away from the injection site. Scale, 1 mm (middle panels), 100 μm (lower panels). Error bars, s.e.m.
Extended Data Figure 9. Simulation of input convergence in Dbh-Cre tracing experiments.
In the sparsest Dbh-Cre trans-synaptic tracing brain, 4 starter cells received input from 43 distinct input regions (309 input neurons, see Supplementary Table 2, Sample #8). In the second sparsest sample, 22 starter cells received input from 66 distinct input regions (756 input neurons; see Supplementary Table 2, Sample #9). a, The relation between the number of input regions for each LC-NE starter cell and the probability of observing > 42 (left) or > 65 (right) input regions in simulation, assuming that each starter cell receives input from a given region with the same probability. As the number of input regions per starter cell increases, the probability of observing inputs from > 42 or > 65 regions also increases. Based on a threshold of p value < 0.001, these simulations suggest that, to account for the total number of observed input areas in each brain sample, there must be individual LC-NE neurons that receive input from more than 15 regions for the sparsest sample (red dot, left) or more than 9 regions for 2nd sparsest sample (red dot, right). b, Detailed view of the distribution of simulation results corresponding to the red dots in (a). Assuming that each cell receives input from 15 (left) or 9 (right) distinct regions, only 5 (left) or 6 (right) out of 10,000 simulations label > 42 (left) or > 65 (right) input regions. Note that if the assumption that each starter cell receives input from the same number of regions does not apply, then there must be at least one cell receiving input from more regions than the number specified in the simulation.
Extended Data Figure 10. Representative images and distribution of individual samples for projection-based viral-genetic labeling experiments.
a, Representative images from sagittal sections of TC+ LC-NE axons in 8 brain regions indicated at the top of each column (the last column shows cell bodies for LC-NE neurons) resulting from CAV injections at four projection sites indicated on the left (top four rows), or AAV-FLExloxP-TC injection at the LC of Dbh-Cre animals (bottom row). All TC+ processes were confirmed to contain norepinephrine transporter (NET, an NE neuron marker) by anti-NET immunostaining (not shown; see Fig. 4 inset). b, The normalized fraction of TC+ LC-NE axons for individual experiments for five conditions are color coded on the top right. Filled symbols represent experiments where Dbh-Cre mice were used along with CAV-FLExloxP-Flp; open symbols represent experiments where wt mice were used along with CAV-Cre. The distribution of individual samples with regards to the fraction of TC+ axons observed at output sites was similar between wt and Dbh-Cre mice. Collectively, the samples for each condition were averaged to quantify the normalized fraction of TC+ LC-NE axons in each brain region as reported in Fig. 4d. Scale, 50 μm. Error bars, s.e.m. Abbreviations: AC, auditory cortex; CC, cingulate cortex; Cb, cerebellum; Hi, hippocampus; Hy, hypothalamus; LC, locus coeruleus; Me, medulla; OB, olfactory bulb; SC, somatosensory cortex.
Supplementary Material
Acknowledgments
We thank N. Makki for initiating the LC project, Stanford and UNC Viral Cores for producing AAVs, K. Touhara for support, members of the Luo lab, L. de Lecea and S. Hestrin for critiques. L.A.S. is supported by a Ruth L. Kirschstein National Service Research Award from NIMH, X.J.G. is supported by a Stanford Bio-X Enlight Foundation Interdisciplinary Fellowship, B.W. is supported by a Stanford Graduate Fellowship and an NSF Graduate Research Fellowship, E.J.K. is supported by EU FP7 BrainVector (# 286071), K.M. was a Research Specialist and L.L. is an investigator of HHMI. This work is supported by an HHMI Collaborative Innovation Award.
Footnotes
The authors declare no competing financial interests.
Author Contributions L.A.S. performed all the experiments on LC input, output, and TRIO analysis, as well as MC TRIO experiments and analysis. K.M. designed the TRIO and cTRIO methods, made all the constructs, performed proof-of-principle experiments for TRIO along with B.W., and performed rat TRIO and mitral cell experiments. X.J.G. performed statistical analysis together with L.A.S. K.T.B. participated in testing TRIO and cTRIO conditions and is co-supervised by R.C.M. and L.L. K.E.D. and J.R. provided technical support. S.I. and E.J.K. produced CAV-FLExloxP-Flp. L.L. supervised the project and wrote the paper together with L.A.S., with contributions from all authors, in particular K.M. and X.J.G.
References
- 1.Dahlström A, Fuxe K. Evidence for the existence of monoaminecontaining neurons in the central nervous system. I. demonstration of monoamines in the cell bodies of brain stem neurons. Acta Physiol Scand. 1964;62:1–55. [PubMed] [Google Scholar]
- 2.Swanson LW, Hartman BK. The central adrenergic system. An immunofluorescence study of the location of cell bodies and their efferent connections in the rat utilizing dopamine-beta-hydroxylase as a marker. J Comp Neurol. 1975;163:467–505. doi: 10.1002/cne.901630406. [DOI] [PubMed] [Google Scholar]
- 3.Sara SJ, Bouret S. Orienting and reorienting: the locus coeruleus mediates cognition through arousal. Neuron. 2012;76:130–141. doi: 10.1016/j.neuron.2012.09.011. [DOI] [PubMed] [Google Scholar]
- 4.Szabadi E. Functional neuroanatomy of the central noradrenergic system. J Psychopharmacology. 2013;27:659–693. doi: 10.1177/0269881113490326. [DOI] [PubMed] [Google Scholar]
- 5.Robertson SD, Plummer NW, de Marchena J, Jensen P. Developmental origins of central norepinephrine neuron diversity. Nat Neurosci. 2013;16:1016–1023. doi: 10.1038/nn.3458. [DOI] [PMC free article] [PubMed] [Google Scholar]
- 6.Cedarbaum JM, Aghajanian GK. Afferent projections to the rat locus coeruleus as determined by a retrograde tracing technique. J Comp Neurol. 1978;178:1–16. doi: 10.1002/cne.901780102. [DOI] [PubMed] [Google Scholar]
- 7.Aston-Jones G, et al. Afferent regulation of locus coeruleus neurons: anatomy, physiology and pharmacology. Prog Brain Res. 1991;88:47–75. doi: 10.1016/s0079-6123(08)63799-1. [DOI] [PubMed] [Google Scholar]
- 8.Luppi PH, Aston-Jones G, Akaoka H, Chouvet G, Jouvet M. Afferent projections to the rat locus coeruleus demonstrated by retrograde and anterograde tracing with cholera-toxin B subunit and Phaseolus vulgaris leucoagglutinin. Neuroscience. 1995;65:119–160. doi: 10.1016/0306-4522(94)00481-j. [DOI] [PubMed] [Google Scholar]
- 9.Wickersham IR, et al. Monosynaptic restriction of transsynaptic tracing from single, genetically targeted neurons. Neuron. 2007;53:639–647. doi: 10.1016/j.neuron.2007.01.033. [DOI] [PMC free article] [PubMed] [Google Scholar]
- 10.Miyamichi K, et al. Dissecting local circuits: parvalbumin interneurons underlie broad feedback control of olfactory bulb output. Neuron. 2013;80:1232–1245. doi: 10.1016/j.neuron.2013.08.027. [DOI] [PMC free article] [PubMed] [Google Scholar]
- 11.Watabe-Uchida M, Zhu L, Ogawa SK, Vamanrao A, Uchida N. Whole-brain mapping of direct inputs to midbrain dopamine neurons. Neuron. 2012;74:858–873. doi: 10.1016/j.neuron.2012.03.017. [DOI] [PubMed] [Google Scholar]
- 12.Soudais C, Laplace-Builhe C, Kissa K, Kremer EJ. Preferential transduction of neurons by canine adenovirus vectors and their efficient retrograde transport in vivo. FASEB J. 2001;15:2283–2285. doi: 10.1096/fj.01-0321fje. [DOI] [PubMed] [Google Scholar]
- 13.Salinas S, et al. CAR-associated vesicular transport of an adenovirus in motor neuron axons. PLoS pathogens. 2009;5:e1000442. doi: 10.1371/journal.ppat.1000442. [DOI] [PMC free article] [PubMed] [Google Scholar]
- 14.Gerfen CR, Paletzki R, Heintz N. GENSAT BAC cre-recombinase driver lines to study the functional organization of cerebral cortical and basal ganglia circuits. Neuron. 2013;80:1368–1383. doi: 10.1016/j.neuron.2013.10.016. [DOI] [PMC free article] [PubMed] [Google Scholar]
- 15.Saunders A, et al. A direct GABAergic output from the basal ganglia to frontal cortex. Nature. 2015;521:85–89. doi: 10.1038/nature14179. [DOI] [PMC free article] [PubMed] [Google Scholar]
- 16.Madisen L, et al. A robust and high-throughput Cre reporting and characterization system for the whole mouse brain. Nat Neurosci. 2010;13:133–140. doi: 10.1038/nn.2467. [DOI] [PMC free article] [PubMed] [Google Scholar]
- 17.Chandler DJ, Gao WJ, Waterhouse BD. Heterogeneous organization of the locus coeruleus projections to prefrontal and motor cortices. Proc Natl Acad Sci U S A. 2014;111:6816–6821. doi: 10.1073/pnas.1320827111. [DOI] [PMC free article] [PubMed] [Google Scholar]
- 18.Mason ST, Fibiger HC. Regional topography within noradrenergic locus coeruleus as revealed by retrograde transport of horseradish peroxidase. J Comp Neurol. 1979;187:703–724. doi: 10.1002/cne.901870405. [DOI] [PubMed] [Google Scholar]
- 19.Room P, Postema F, Korf J. Divergent axon collaterals of rat locus coeruleus neurons: demonstration by a fluorescent double labeling technique. Brain Res. 1981;221:219–230. doi: 10.1016/0006-8993(81)90773-3. [DOI] [PubMed] [Google Scholar]
- 20.Nagai T, Satoh K, Imamoto K, Maeda T. Divergent projections of catecholamine neurons of the locus coeruleus as revealed by fluorescent retrograde double labeling technique. Neuroscience letters. 1981;23:117–123. doi: 10.1016/0304-3940(81)90027-6. [DOI] [PubMed] [Google Scholar]
- 21.Steindler DA. Locus coeruleus neurons have axons that branch to the forebrain and cerebellum. Brain Res. 1981;223:367–373. doi: 10.1016/0006-8993(81)91149-5. [DOI] [PubMed] [Google Scholar]
- 22.Swanson LW. Brain Architecture: Understanding the Basic Plan. Oxford University Press; 2011. [Google Scholar]
- 23.Aston-Jones G, Bloom FE. Activity of norepinephrine-containing locus coeruleus neurons in behaving rats anticipates fluctuations in the sleep-waking cycle. J Neurosci. 1981;1:876–886. doi: 10.1523/JNEUROSCI.01-08-00876.1981. [DOI] [PMC free article] [PubMed] [Google Scholar]
- 24.Gompf HS, et al. Locus ceruleus and anterior cingulate cortex sustain wakefulness in a novel environment. J Neurosci. 2010;30:14543–14551. doi: 10.1523/JNEUROSCI.3037-10.2010. [DOI] [PMC free article] [PubMed] [Google Scholar]
- 25.Carter ME, et al. Tuning arousal with optogenetic modulation of locus coeruleus neurons. Nat Neurosci. 2010;13:1526–1533. doi: 10.1038/nn.2682. [DOI] [PMC free article] [PubMed] [Google Scholar]
- 26.Van Bockstaele EJ, Colago EE, Valentino RJ. Corticotropin-releasing factor-containing axon terminals synapse onto catecholamine dendrites and may presynaptically modulate other afferents in the rostral pole of the nucleus locus coeruleus in the rat brain. J Comp Neurol. 1996;364:523–534. doi: 10.1002/(SICI)1096-9861(19960115)364:3<523::AID-CNE10>3.0.CO;2-Q. [DOI] [PubMed] [Google Scholar]
- 27.Stepien AE, Tripodi M, Arber S. Monosynaptic rabies virus reveals premotor network organization and synaptic specificity of cholinergic partition cells. Neuron. 2010;68:456–472. doi: 10.1016/j.neuron.2010.10.019. [DOI] [PubMed] [Google Scholar]
- 28.Pivetta C, Esposito MS, Sigrist M, Arber S. Motor-circuit communication matrix from spinal cord to brainstem neurons revealed by developmental origin. Cell. 2014;156:537–548. doi: 10.1016/j.cell.2013.12.014. [DOI] [PubMed] [Google Scholar]
- 29.Kinoshita M, et al. Genetic dissection of the circuit for hand dexterity in primates. Nature. 2012;487:235–238. doi: 10.1038/nature11206. [DOI] [PubMed] [Google Scholar]
- 30.Luo L, Callaway EM, Svoboda K. Genetic dissection of neural circuits. Neuron. 2008;57:634–660. doi: 10.1016/j.neuron.2008.01.002. [DOI] [PMC free article] [PubMed] [Google Scholar]
- 31.Gong S, et al. Targeting Cre recombinase to specific neuron populations with bacterial artificial chromosome constructs. J Neurosci. 2007;27:9817–9823. doi: 10.1523/JNEUROSCI.2707-07.2007. [DOI] [PMC free article] [PubMed] [Google Scholar]
- 32.Zhang XM, et al. Highly restricted expression of Cre recombinase in cerebellar Purkinje cells. Genesis. 2004;40:45–51. doi: 10.1002/gene.20062. [DOI] [PubMed] [Google Scholar]
- 33.Miyamichi K, et al. Cortical representations of olfactory input by trans-synaptic tracing. Nature. 2011;472:191–196. doi: 10.1038/nature09714. [DOI] [PMC free article] [PubMed] [Google Scholar]
- 34.Tasic B, et al. Site-specific integrase-mediated transgenesis in mice via pronuclear injection. Proc Natl Acad Sci U S A. 2011;108:7902–7907. doi: 10.1073/pnas.1019507108. [DOI] [PMC free article] [PubMed] [Google Scholar]
- 35.Hanawa H, et al. Efficient gene transfer into rhesus repopulating hematopoietic stem cells using a simian immunodeficiency virus-based lentiviral vector system. Blood. 2004;103:4062–4069. doi: 10.1182/blood-2004-01-0045. [DOI] [PubMed] [Google Scholar]
- 36.Osakada F, Callaway EM. Design and generation of recombinant rabies virus vectors. Nat Protoc. 2013;8:1583–1601. doi: 10.1038/nprot.2013.094. [DOI] [PMC free article] [PubMed] [Google Scholar]
- 37.Kremer EJ, Boutin S, Chillon M, Danos O. Canine adenovirus vectors: an alternative for adenovirus-mediated gene transfer. Journal of virology. 2000;74:505–512. doi: 10.1128/jvi.74.1.505-512.2000. [DOI] [PMC free article] [PubMed] [Google Scholar]
- 38.Weissbourd B, et al. Presynaptic partners of dorsal raphe serotonergic and GABAergic neurons. Neuron. 2014;83:645–662. doi: 10.1016/j.neuron.2014.06.024. [DOI] [PMC free article] [PubMed] [Google Scholar]
- 39.Schneider Gasser EM, et al. Immunofluorescence in brain sections: simultaneous detection of presynaptic and postsynaptic proteins in identified neurons. Nat Protoc. 2006;1:1887–1897. doi: 10.1038/nprot.2006.265. [DOI] [PubMed] [Google Scholar]
Associated Data
This section collects any data citations, data availability statements, or supplementary materials included in this article.


