

Abstract
Dogs consuming a hypercaloric high-fat and -fructose diet (52 and 17% of total energy, respectively) or a diet high in either fructose or fat for 4 wk exhibited blunted net hepatic glucose uptake (NHGU) and glycogen deposition in response to hyperinsulinemia, hyperglycemia, and portal glucose delivery. The effect of a hypercaloric diet containing neither fructose nor excessive fat has not been examined. Dogs with an initial weight of ≈25 kg consumed a chow and meat diet (31% protein, 44% carbohydrate, and 26% fat) in weight-maintaining (CTR; n = 6) or excessive (Hkcal; n = 7) amounts for 4 wk (cumulative weight gain 0.0 ± 0.3 and 1.5 ± 0.5 kg, respectively, P < 0.05). They then underwent clamp studies with infusions of somatostatin and intraportal insulin (4× basal) and glucagon (basal). The hepatic glucose load was doubled with peripheral (Pe) glucose infusion for 90 min (P1) and intraportal glucose at 4 mg·kg−1·min−1 plus Pe glucose for the final 90 min (P2). NHGU was blunted (P < 0.05) in Hkcal during both periods (mg·kg−1·min−1; P1: 1.7 ± 0.2 vs. 0.3 ± 0.4; P2: 3.6 ± 0.3 vs. 2.3 ± 0.4, CTR vs. Hkcal, respectively). Terminal hepatic glucokinase catalytic activity was reduced nearly 50% in Hkcal vs. CTR (P < 0.05), although glucokinase protein did not differ between groups. In Hkcal vs. CTR, liver glycogen was reduced 27% (P < 0.05), with a 91% increase in glycogen phosphorylase activity (P < 0.05) but no significant difference in glycogen synthase activity. Thus, Hkcal impaired NHGU and glycogen synthesis compared with CTR, indicating that excessive energy intake, even if the diet is balanced and nutritious, negatively impacts hepatic glucose metabolism.
Keywords: glycogen, glycogen phosphorylase, hypercaloric diet, liver
the liver is an especially important organ in regard to glucose homeostasis because it is able to both export glucose for use by other tissues and extract glucose to reduce glycemia. Failure of the liver to make the transition from net output to uptake of glucose in the postprandial state is a major contributor to the development of impaired glucose tolerance and hyperglycemia (3, 25). It is difficult to quantify hepatic glucose uptake (HGU) in the human because of the invasiveness of the hepatic portal vein catheterization required. Portal and hepatic vein catheterization is feasible in the dog, and the canine model provides a useful method for examining the liver's role in glucose disposal under postprandial conditions (31). Both high-fat and high-fructose diets and a diet with a combination of high fat and fructose are associated with marked impairment of HGU under hyperinsulinemic hyperglycemic (HIHG) clamp conditions in the dog (11, 12). Under all of these circumstances, however, the modified diets were hypercaloric compared with that of the control group.
The impact of excessive energy intake per se, i.e., excessive intake of foods normally viewed as nutritious, on the liver's role in glucose disposal remains unknown. The present studies were thus carried out to determine whether chronic consumption of a hypercaloric “balanced” diet and the weight gain associated with it would result in impairment of liver glucose disposal in the dog model.
RESEARCH DESIGN AND METHODS
Animal Care and Surgical Procedures
The protocol was approved by the Vanderbilt University Institutional Animal Care and Use Committee, and the animals were housed and cared for according to Association for Assessment and Accreditation of Laboratory Animal Care guidelines. For 4 wk, adult male mongrel dogs were fed a diet of laboratory chow and meat (LabDiet 5006; PMI Nutrition, Richmond, IN, and Kal Kan, Franklin, TN). The diet consisted of 31% protein, 26% fat, and 44% carbohydrate, with almost all of the carbohydrate being complex (starch and fiber). The composition has been described in detail previously (11). A record of the amount of food provided each day as well as the amount remaining from the previous day was kept. The diet was fed in amounts calculated to be weight maintaining [i.e., providing 100% of energy required to keep the animals' weights from changing (5); control diet group (CTR); n = 6] or in amounts that were in excess of energy needs [high kcal (Hkcal) group; n = 7]. After ≈12–15 days on the diet, each dog underwent surgery under general anesthesia to insert sampling catheters in the femoral artery, hepatic portal vein, and left common hepatic vein, blood flow probes around the portal vein and hepatic artery, and a splenic and a jejunal vein catheter to allow infusion into the portal circulation, as described previously (11). Following surgery, they continued their respective diet regimens to complete the 4-wk diet consumption time period.
Experimental Design
After the dogs had followed their respective diet regimens for 4 wk, HIHG clamp experiments were conducted following an 18-h fast. Just prior to beginning the fast, each dog was fed a can of meat to ensure equivalent energy and macronutrient consumption between groups. Each experiment consisted of a 100-min equilibration period (−120 to −20 min), a 20-min period of basal sampling (−20 to 0 min), and a 180-min experimental period divided into two subperiods (P1, 0–90 min; P2, 90–180 min). At −120 min, a priming dose of [3-3H]glucose (38 μCi) was delivered, and a constant infusion of [3-3H]glucose (0.38 μCi/min) was initiated. At time 0, a constant peripheral venous infusion of somatostatin (0.8 μg·kg−1·min−1) began, and continuous intraportal infusions of insulin (4× basal; 1.2 mU·kg−1·min−1) and glucagon (basal; 0.55 ng·kg−1·min−1) were started. A peripheral infusion of 50% glucose was also initiated, with the infusion rate titrated as needed to double the hepatic glucose load. In P2, 20% glucose was infused intraportally at 4 mg·kg−1·min−1, and the peripheral glucose infusion rate was adjusted as necessary so that the hepatic glucose loads were equivalent during P1 and P2. At the end of the study, each animal was anesthetized with pentobarbital sodium while all infusions continued, and liver tissue was freeze-clamped in situ and stored at −80°C for later analysis. The animal was then euthanized.
Analyses
Western blotting.
Western blotting procedures were performed as described previously (16, 38). The glucokinase (GK) antibody was provided by Dr. Masakazu Shiota (Vanderbilt University School of Medicine). Actin and GK regulatory protein (GKRP) antibodies were purchased from Santa Cruz Biotechnology, and all other antibodies were purchased from Cell Signaling Technology. ImageJ software (http://rsb.info.nih.gov/ij/) was used for quantification.
Enzyme activity.
GK activity was assessed as described by Barzilai and Rossetti (2), and glycogen synthase (GS) and phosphorylase activities were determined by the method of Golden et al. (21).
Biochemicals.
Arterial, portal vein, and hepatic vein plasma glucose, [3H]glucose, glucagon, insulin, and nonesterified fatty acid (NEFA) levels, and blood lactate and glycerol concentrations were measured using standard methods, as described previously (20, 32). Plasma triglycerides were determined using Raichem reagent no. 84098.
The method of Keppler and Decker (24) was utilized for determination of hepatic glycogen concentrations. Hepatic tissue lipids were extracted and individual species quantified as described previously (10).
Calculations
Hepatic glucose load and net hepatic glucose balance were calculated with an indirect method to reduce any error introduced by streaming of infusate in the portal vein (13). Hepatic sinusoidal plasma insulin and glucagon concentrations were calculated as described previously (16). Hepatic fractional extraction of insulin was the hepatic insulin balance divided by the inflowing plasma insulin concentrations (arterial and portal vein concentrations weighted for the proportion of arterial and portal vein flow). Glycogen synthesis via the direct pathway was calculated by dividing hepatic 3H-labeled glycogen by the average inflowing plasma [3H]glucose-specific radioactivity (43). Nonhepatic glucose uptake (non-HGU) was the difference between net HGU and the glucose infusion rate, adjusted for changes in the size of the glucose pool.
Statistical Analyses
Data are expressed as means ± SE. Mean values for P1 or P2 are the means for the last hour of each period. Two-way analysis of variance with or without repeated-measures design was used (SigmaStat; Systat, Richmond, CA), and post hoc analysis was performed using the Student-Newman-Keuls multiple comparisons test. A P value of <0.05 was considered significant.
RESULTS
Weight Change and Food Intake
Body weights at the beginning of dietary intervention were not different between groups (23.9 ± 1.7 and 25.0 ± 1.2 kg in CTR and Hkcal, respectively, P = 0.28). The cumulative weight changes during the 4 wk of observation and dietary intervention were 0.0 ± 0.3 (as designed) and 1.5 ± 0.5 kg (P < 0.05), with energy intake averaging 1,850 ± 136 and 2,667 ± 241 kcal/day (P < 0.05) in the CTR and Hkcal groups, respectively.
Plasma Hormone Concentrations
The arterial plasma C-peptide concentrations tended to be elevated in Hkcal vs. CTR under basal conditions (0.27 ± 0.02 vs. 0.21 ± 0.03 ng/ml, P = 0.08), but C-peptide was suppressed to the limits of detection in both groups during P1 and P2. The arterial plasma insulin levels also tended to be higher in Hkcal vs. CTR in the basal period (10 ± 1 vs. 8 ± 2 μU/ml, respectively, P = 0.12) and throughout P1 and P2 (P = 0.10 between groups) (Fig. 1A), although the magnitude of the increase in arterial plasma insulin concentrations during the clamp was not different between groups. The hepatic sinusoidal insulin concentrations were modestly higher in Hkcal than CTR during both P1 and P2 (P < 0.05; Fig. 1B). Although hepatic fractional extraction of insulin did not differ significantly during the basal period (62 ± 13 vs. 57 ± 7% in CTR and Hkcal, respectively, P = 0.3), it was lower in Hkcal during the clamp (65 ± 5 and 55 ± 4% in CTR and Hkcal, respectively, for the combined P1 and P2, P < 0.05).
Fig. 1.
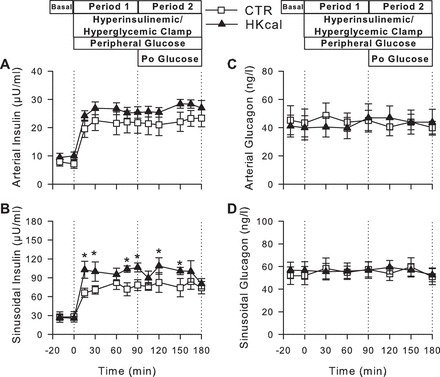
Plasma hormone concentrations during hyperinsulinemic hyperglycemic (HIHG) clamps. Arterial plasma insulin (A) and glucagon (C) and hepatic sinusoidal insulin (B) and glucagon (D) during basal (−20 to 0 min) and experimental periods (0–180 min) in control diet group (CTR) (□; n = 6) and high-kcal diet group (Hkcal) (▲; n = 7). Data are means ± SE. *P < 0.05 between groups. Po glucose, portal glucose.
Plasma glucagon concentrations remained basal throughout the clamp in both groups, with no differences between groups at any time (Fig. 1, C and D). Arterial plasma cortisol concentrations were also basal throughout the studies and did not differ between groups (data not shown).
Blood Glucose, Hepatic Glucose Load, and HGU
Fasting (basal period) blood glucose concentrations were 80 ± 1 mg/dl in both groups (Fig. 2A). During P1, arterial blood glucose concentrations were increased to ≈160 mg/dl in both groups (P < 0.05 vs. basal period) to double the hepatic glucose load (Fig. 2B). During P2, arterial blood glucose was clamped at ≈150 mg/dl to maintain a doubling of the hepatic glucose load in the presence of intraportal glucose infusion. Total hepatic blood flow was similar between groups at all times (data not shown).
Fig. 2.
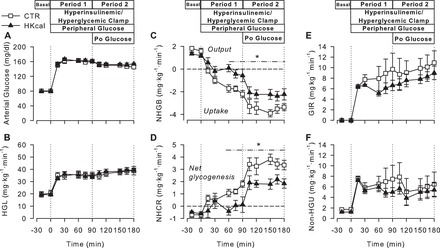
Arterial blood glucose (A), hepatic glucose load (HGL; B), net hepatic glucose balance (NHGB; C), net hepatic carbon retention (NHCR; D), glucose infusion rate (GIR; E), and nonhepatic glucose uptake (non-HGU; F) in CTR (□; n = 6) and Hkcal (▲; n = 7) during the basal (−20 to 0 min) and experimental periods (0–180 min) of HIHG clamps. Data are means ± SE. All variables changed significantly from basal within both groups during hepatic glucose load doubled with peripheral glucose infusion for 90 min (P1) and intraportal glucose at 4 mg·kg−1·min−1 plus peripheral glucose for the final 90 min (P2). *P < 0.05 between groups.
During the basal period, all dogs were in a state of net hepatic glucose output (Fig. 2C). The CTR group switched to net hepatic glucose uptake (NHGU) within 15 min of the start of the HIHG clamp, reaching a rate of 1.7 ± 0.2 mg·kg−1·min−1 during the last hour of P1, with a further increase of ≈2 mg·kg−1·min−1 during P2. In the Hkcal group, NHGU was markedly reduced during P1 (0.3 ± 0.4 mg·kg−1·min−1, P < 0.005 vs. CTR). Although the Hkcal group responded to portal glucose delivery with an increase in NHGU of the same magnitude as that in the CTR group, the absolute rate remained lower than in CTR (2.3 ± 0.4 mg·kg−1·min−1, P < 0.05 between groups). Net hepatic carbon retention, an index of net hepatic glycogen synthesis, was 38% greater overall in CTR than in Hkcal (P < 0.05; Fig. 2D).
Although the glucose infusion rate (GIR) was mathematically lower in Hkcal than in CTR during the clamp, resulting in a total area under the curve for GIR that was 21% less in Hkcal than CTR, this did not reach statistical significance (between-group comparisons: P = 0.12 during P1, P = 0.19 during P2; Fig. 2E). Additionally, non-HGU did not differ significantly between groups at any time (Fig. 2F).
Lactate and Net Hepatic Carbon Retention, Glycerol, and NEFAs
Similar arterial blood lactate concentrations and rates of net hepatic lactate uptake (NHLU) existed in both groups under basal conditions (Fig. 3, A and B). In response to hyperinsulinemia and hyperglycemia, both groups exhibited a similar increase in arterial blood lactate levels. This occurred in conjunction with a switch from NHLU to net hepatic lactate output (NHLO) in both groups, although NHLO was significantly lower in Hkcal vs. CTR during P1 and the beginning of P2, consistent with the reduced NHGU.
Fig. 3.
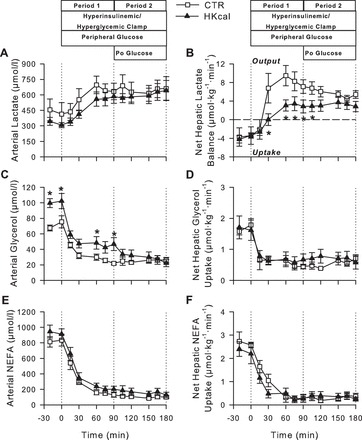
Arterial blood lactate (A) and glycerol (C) and plasma nonesterified fatty acid (NEFA; E) concentrations and net hepatic balances of lactate (B), glycerol (D), and NEFA (F) during basal (−20 to 0 min) and experimental periods (0–180 min) of HIHG clamps in CTR (□; n = 6) and Hkcal (▲; n = 7) groups. Data are means ± SE. *P < 0.05 between groups.
During the basal period, arterial blood glycerol concentrations were significantly higher in Hkcal than in CTR (101 ± 8 vs. 72 ± 5 μmol/l, respectively, P < 0.05). In both groups, there was a fall in glycerol concentrations with the onset of HIHG clamp conditions. Although glycerol concentrations remained higher in Hkcal vs. CTR during P1, the values were similar between groups during P2 (Fig. 3C). Net hepatic glycerol uptake declined in parallel with the glycerol concentrations, and there were no differences between groups at any time (Fig. 3D). Arterial plasma NEFA concentrations and net hepatic NEFA uptakes also fell in response to the clamp conditions and did not differ between groups at any time (Fig. 3, E and F).
Arterial plasma triglyceride concentrations in the basal period were not different between groups (1,156 ± 246 and 1,165 ± 135 mg/dl).
Liver Tissue Analyses
In terminal hepatic biopsies, Akt phosphorylation and relative GK and GKRP were not significantly different between groups (Fig. 4, A–C). Nevertheless, GK catalytic activity was reduced nearly 50% in Hkcal (P < 0.05; Fig. 4D). The activity ratio of GS was not significantly different between groups (P = 0.37; Fig. 4E). On the other hand, the activity ratio of glycogen phosphorylase (GP) was 91% greater in Hkcal than CTR (P < 0.05; Fig. 4F). Consistent with the differences in GP activity, as well as cumulative net hepatic carbon retention (see above), terminal liver glycogen levels in Hkcal were only 73% of those in CTR (P < 0.05), although the incorporation of glucose into glycogen through the direct synthetic pathway did not differ between groups (P = 0.57; Fig. 4, G and H). Terminal liver triglyceride levels were 1.6 ± 0.2 and 1.7 ± 0.3 μg/mg liver in CTR and Hkcal, respectively (P = 0.79).
Fig. 4.
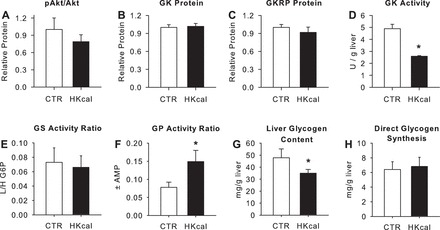
Terminal hepatic tissue data. p-Akt/Akt (A), glucokinase (GK) protein (B), glucokinase regulatory protein (GKRP; C), GK activity (D), glycogen synthase (GS; E) and phosphorylase (GP; F) activity ratios (active/total), liver glycogen concentrations (G), and hepatic glycogen synthesis via the direct pathway (H) in CTR (open bars) and Hkcal (black bars) groups. GK and GKRP are expressed relative to tissue actin, and Western blot data for Hkcal are normalized to those in CTR. Data are means ± SE; n = 6 and 7 in CTR and Hkcal, respectively. *P < 0.05 vs. CTR.
DISCUSSION
Since the liver plays a central role in nutrient storage and supply to the remainder of the body, its response to feeding is a major determinant of glucose and meal tolerance. In previous studies (10, 12), we employed the same clamp conditions as the current experiments, utilizing dogs fed diets high in fructose (HFrD; 17% of total energy) or fat (HFD; 52% of total energy) or a combination of high fat and fructose (HFFD). In those groups there was no apparent NHGU during P1 (compared with NHGU of ≈1.5 mg·kg−1·min−1 in chow-fed controls), and the rates during P2 were reduced ≈55–75% compared with the rates in control animals. In the previous studies, however, it was not possible to determine whether excessive energy intake, in addition to the macronutrient modifications, was responsible for some of the impairments observed, since all of the intervention groups consumed diets that were hypercaloric compared with the CTR dogs. In studies in healthy nonobese men, short-term (4–5 days) overfeeding brought about by increasing intake of either carbohydrate or fat within the context of a normal diet increased fasting glucose and insulin or C-peptide concentrations as well as the rate of glucose appearance and the hepatic insulin resistance index (4, 9). In overweight or obese but nondiabetic men, 1 day of excess consumption of a balanced diet (130% of requirement for weight maintenance) resulted in significant elevation of fasting hepatic glucose production and nocturnal glycemia and insulinemia as well as hepatic insulin resistance (27, 46). However, the effect of chronic adaptation to a balanced hypercaloric diet on liver glucose metabolism has not been thoroughly examined. Moreover, the effect of hypercaloric intake on HGU and storage is less well understood than the effect on hepatic glucose production.
In the current studies, we found that providing abundant amounts of our usual balanced and nutritious canine diet, such that food was virtually always available to the Hkcal group (as it was to the HFrD, HFD, and HFFD groups), brought about only a 6% weight gain over the 4-wk period. Nevertheless, it was associated with significant impairment in NHGU. Although the Hkcal group shifted from NHGO to NHGU by the end of P1, the rate was minimal, and during P2 it was reduced 36% compared with CTR. It is worth noting that the amount of insulin reaching the liver was slightly but significantly higher in the Hkcal vs. the CTR group during the clamp, which was due at least in part to a reduction in hepatic fractional extraction of insulin in Hkcal. If the insulin concentrations had been identical between groups, the rate of NHGU would likely have been further blunted in the Hkcal group (8). The significant reduction in hepatic fractional extraction of insulin in the Hkcal group became evident only with the higher insulin concentrations present during the clamp. Hepatic fractional extraction of insulin in Hkcal vs. CTR was slightly but not significantly lower under basal conditions and thus was apparently insufficient to impact the low insulin concentrations present in the basal period.
The impact of increases in food intake, even if the foods consumed can be considered “healthy,” on hepatic glucose metabolism is an important question in light of recent changes in eating patterns. The number of daily eating occasions (meals and snacks), as well as the sizes of portions served, has increased over the past 20–30 yr (15, 28, 29, 33, 35–37, 45). Although the changes in eating habits are most fully documented in the US, similar patterns are reported in other countries (e.g., see Refs. 17, 18, 34, and 40). The availability of abundant amounts of food, even relatively unpalatable food, is linked with increases in food intake in adults and children (19, 42, 49). The trends toward increased numbers of daily eating occasions and increased portion sizes have been paralleled by increases in total energy intake and body weight in recent decades as well as increased prevalence of metabolic abnormalities such as impaired fasting glucose, insulin resistance, glucose intolerance, and type 2 diabetes (6, 14, 23, 26). Our data indicate that excessive food intake, even if it is nutritionally balanced, has a negative impact on hepatic glucose metabolism, thus potentially contributing to these metabolic abnormalities.
Although total GIR during the clamp did not differ significantly between groups, it was mathematically lower in Hkcal at almost every time point during P1 and P2 such that the total amount of glucose infused was reduced >20% in Hkcal vs. CTR (P = 0.15). Nearly 90% of the apparent difference in GIR between Hkcal and CTR could be accounted for by the difference in the liver's glucose uptake. In contrast to the hepatic response, non-HGU (primarily skeletal muscle uptake under the conditions of study) was similar between groups. This does not rule out the presence of extrahepatic insulin resistance in the Hkcal animals, since the conditions of study were not designed for assessing this.
It would be interesting to speculate on the effect of an increase in dietary protein content on the impact of the Hkcal diet. However, previous studies in macaques and humans have found a reduction of appetite during consumption of high-protein diets with unrestricted caloric content (22, 44, 50). Thus, it might not be possible to induce a Hkcal plus high-protein group to consume sufficient calories to create a differential response from the CTR group.
Liver Tissue Data
GK serves a critical function in facilitating the normal response of the liver to elevated glucose and insulin (31). Compared with the CTR group, the Hkcal group demonstrated a significant decrease in GK activity without any detectable differences in either GK or GKRP protein. The impairment in GK activity was consistent with the blunting of NHGU during the clamp. Although GKRP is well known to be involved in regulation of hepatic GK activity, GK activity is also responsive to other signals, including phosphofructo-2-kinase/fructose-2,6-biphosphatase and possibly nitrosylation (1). The pancreatic form of GK is regulated by interaction with nitric oxide synthase (39), but the response of the hepatic form has not been evaluated. Thus the apparent disconnect between GK and GKRP protein levels and GK activity in this investigation is likely related to the complex covalent and allosteric mechanisms that contribute to the regulation of GK activity.
Consistent with the enhancement of GP activity in the Hkcal vs. CTR group, the terminal liver glycogen levels were 27% lower in the Hkcal group. GP activity is responsive to hepatic levels of glucose 6-phosphate, with a suppression of activity in response to higher glucose 6-phosphate concentrations, and thus the relative GP activities in the two groups are consistent with their relative rates of NHGU. GP activity under hyperglycemic and hyperinsulinemic conditions has previously been shown to be increased in drug-induced and genetic rodent models of obesity and/or diabetes (7, 41, 48), but not in high-fat-fed rats (30). In the HFD, HFrD, and HFFD groups in our previous studies (10, 12), GP showed a tendency to be elevated relative to the controls. The HKcal group did not exhibit a significant reduction in GS activity relative to CTR. This is in general agreement with our previous studies in which only the groups with high fat intake (i.e., HFD and HFFD) demonstrated a significant impairment in GS activity.
Glycolytic Flux and Lipolysis
Although both groups switched from NHLU to NHLO early in the clamp period, the rate was significantly lower in Hkcal than in CTR during P1, and this persisted into the early part of P2; even during the latter part of P2, the rate in Hkcal remained numerically lower than in CTR. Dogs fed either the HFFD or the HFrD did not switch from NHLU to NHLO under identical clamp conditions (10, 12). Dogs fed a diet with a selective increase in fat did exhibit NHLO, but it was blunted compared with the rate in the dogs fed the weight-maintaining chow diet (12), similar to the response in the HKcal dogs in the current study. The blunting of NHLO in Hkcal was probably related to a decrease in the supply of substrate due to impaired NHGU. Conversely, the abundance of glycolitically generated carbon in the CTR group likely contributed to the larger mass of glycogen synthesized via the indirect pathway in CTR vs. Hkcal.
Basal arterial glycerol concentrations were significantly greater in Hkcal than in CTR, and glycerol concentrations remained higher in Hkcal during P1, consistent with a higher lipolytic rate in Hkcal despite the tendency toward higher insulin concentrations in that group. This suggests a degree of insulin insensitivity in fat tissue in the Hkcal group. NEFA concentrations and net hepatic uptakes did not differ between groups at any time. This underscores the differential metabolism of glycerol and NEFA in that NEFA can undergo reesterification in the adipose tissue, whereas glycerol does not to any significant extent because of the low level of glycerokinase in fat (47). Because of this, glycerol concentrations provide a better indication of the relative rates of lipolysis in these two groups than NEFA concentrations.
Summary and Conclusions
Providing excessive amounts of a nutritious, balanced diet resulted in reduction in NHGU under hyperinsulinemic hyperglycemic clamp conditions with or without the presence of the portal glucose signal. The results were similar to albeit smaller in magnitude than results observed in dogs fed hypercaloric diets high in fat, fructose, or both fat and fructose (10, 12). These data indicate that the liver shares in the deleterious effects of excessive food intake and/or weight gain. By impairing the liver's ability to suppress its glucose production and increase glucose uptake, excessive food intake could contribute to postprandial hyperglycemia and impairment of hepatic glycogen storage. Our findings provide further evidence that intake of food in excess of the requirements for weight maintenance, even when the diet is nutritionally balanced, is apt to have adverse metabolic effects.
GRANTS
This work was supported by National Institutes of Health (NIH) Grant R01-DK-18243 (to A. D. Cherrington) as well as the Metabolic Physiology Shared Resource, Hormone Assay and Analytical Services, and Lipid Cores, and NIH Grants AM-20593 and DK-59636. A. D. Cherrington holds the Jacquelyn A. Turner and Dr. Dorothy J. Turner Chair in Diabetes Research.
DISCLOSURES
No conflicts of interest, financial or otherwise, are declared by the authors.
AUTHOR CONTRIBUTIONS
K.C.C. and A.D.C. conception and design of research; K.C.C., G.K., B.F., D.W.N., P.W., and M.C.M. performed experiments; K.C.C., M.S., M.S.S., and M.C.M. analyzed data; K.C.C., A.D.C., and M.C.M. interpreted results of experiments; K.C.C., G.K., M.S., and A.D.C. edited and revised manuscript; K.C.C., G.K., M.S., M.S.S., B.F., D.W.N., P.W., A.D.C., and M.C.M. approved final version of manuscript; M.C.M. prepared figures; M.C.M. drafted manuscript.
ACKNOWLEDGMENTS
We greatly appreciate the technical assistance and support of Jamie Adcock, Amy Nunnally, Jon Hastings, and Patsy Raymer.
Present address of K. C. Coate: Dept. of Pharmacology, Univ. of Texas Southwestern Medical Center, Dallas, TX 75390.
REFERENCES
- 1.Agius L. Glucokinase and molecular aspects of liver glycogen metabolism. Biochem J 414: 1–18, 2008. [DOI] [PubMed] [Google Scholar]
- 2.Barzilai N, Rossetti L. Role of glucokinase and glucose-6-phosphatase in the acute and chronic regulation of hepatic glucose fluxes by insulin. J Biol Chem 268: 25019–25025, 1993. [PubMed] [Google Scholar]
- 3.Basu A, Basu R, Shah P, Vella A, Johnson CM, Nair KS, Jensen MD, Schwenk WF, Rizza RA. Effects of type 2 diabetes on the ability of insulin and glucose to regulate splanchnic and muscle glucose metabolism: evidence for a defect in hepatic glucokinase activity. Diabetes 49: 272–283, 2000. [DOI] [PubMed] [Google Scholar]
- 4.Brons C, Jensen CB, Storgaard H, Hiscock NJ, White A, Appel JS, Jacobsen S, Nilsson E, Larsen CM, Astrup A, Quistorff B, Vaag A. Impact of short-term high-fat feeding on glucose and insulin metabolism in young healthy men. J Physiol 587: 2387–2397, 2009. [DOI] [PMC free article] [PubMed] [Google Scholar]
- 5.Centers for Disease Control and Prevention. Healthy Weight - It's Not a Diet, It's a lifestyle [Online]! Atlanta, GA: Centers for Disease Control and Prevention; http://www.cdc.gov/healthyweight/calories/index.html [10 March 2015]. [Google Scholar]
- 6.Centers for Disease Control and Prevention. National Diabetes Statistics Report: Estimates of Diabetes and its Burden in the United States, 2014. Atlanta, GA: US Department of Health and Human Services, 2014. [Google Scholar]
- 7.Chen C, Williams PF, Cooney GJ, Caterson ID, Turtle JR. The effects of fasting and refeeding on liver glycogen synthase and phosphorylase in obese and lean mice. Horm Metab Res 24: 161–166, 1992. [DOI] [PubMed] [Google Scholar]
- 8.Cherrington AD, Williams PE, Abou-Mourad N, Lacy WW, Steiner KE, Liljenquist JE. Insulin as a mediator of hepatic glucose uptake in the conscious dog. Am J Physiol Endocrinol Metab 242: E97–E101, 1982. [DOI] [PubMed] [Google Scholar]
- 9.Clore JN, Helm ST, Blackard WG. Loss of hepatic autoregulation after carbohydrate overfeeding in normal man. J Clin Invest 96: 1967–1972, 1995. [DOI] [PMC free article] [PubMed] [Google Scholar]
- 10.Coate KC, Kraft G, Irimia JM, Smith MS, Farmer B, Neal DW, Roach PJ, Shiota M, Cherrington AD. Portal vein glucose entry triggers a coordinated cellular response that potentiates hepatic glucose uptake and storage in normal but not high-fat/high-fructose-fed dogs. Diabetes 62: 392–400, 2013. [DOI] [PMC free article] [PubMed] [Google Scholar]
- 11.Coate KC, Kraft G, Lautz M, Smith M, Neal DW, Cherrington AD. A high-fat, high-fructose diet accelerates nutrient absorption and impairs net hepatic glucose uptake in response to a mixed meal in partially pancreatectomized dogs. J Nutr 141: 1643–1651, 2011. [DOI] [PMC free article] [PubMed] [Google Scholar]
- 12.Coate KC, Kraft G, Moore MC, Smith MS, Ramnanan C, Irimia JM, Roach PJ, Farmer B, Neal DW, Williams P, Cherrington AD. Hepatic glucose uptake and disposition during short-term high-fat vs. high-fructose feeding. Am J Physiol Endocrinol Metab 307: E151–E160, 2014. [DOI] [PMC free article] [PubMed] [Google Scholar]
- 13.Coate KC, Scott M, Farmer B, Moore MC, Smith M, Roop J, Neal DW, Williams P, Cherrington AD. Chronic consumption of a high-fat/high-fructose diet renders the liver incapable of net hepatic glucose uptake. Am J Physiol Endocrinol Metab 299: E887–E898, 2010. [DOI] [PMC free article] [PubMed] [Google Scholar]
- 14.Dabelea D, Mayer-Davis EJ, Saydah S, Imperatore G, Linder B, Divers J, Bell R, Badaru A, Talton JW, Crume T, Liese AD, Merchant AT, Lawrence JM, Reynolds K, Dolan L, Liu LL, Hamman RF. Prevalence of type 1 and type 2 diabetes among children and adolescents from 2001 to 2009. JAMA 311: 1778–1786, 2014. [DOI] [PMC free article] [PubMed] [Google Scholar]
- 15.Duffey KJ, Popkin BM. Energy density, portion size, and eating occasions: contributions to increased energy intake in the United States, 1977–2006. PLoS Med 8: e1001050, 2011. [DOI] [PMC free article] [PubMed] [Google Scholar]
- 16.Edgerton DS, Ramnanan CJ, Grueter CA, Johnson KM, Lautz M, Neal DW, Williams PE, Cherrington AD. Effects of insulin on the metabolic control of hepatic gluconeogenesis in vivo. Diabetes 58: 2766–2775, 2009. [DOI] [PMC free article] [PubMed] [Google Scholar]
- 17.Elangovan A, Mungara J, Joseph E. Exploring the relation between body mass index, diet, and dental caries among 6–12-year-old children. J Indian Soc Pedod Prev Dent 30: 293–300, 2012. [DOI] [PubMed] [Google Scholar]
- 18.Flores M, Macias N, Rivera M, Lozada A, Barquera S, Rivera-Dommarco J, Tucker KL. Dietary patterns in Mexican adults are associated with risk of being overweight or obese. J Nutr 140: 1869–1873, 2010. [DOI] [PubMed] [Google Scholar]
- 19.French SA, Mitchell NR, Wolfson J, Harnack LJ, Jeffery RW, Gerlach AF, Blundell JE, Pentel PR. Portion size effects on weight gain in a free living setting. Obesity (Silver Spring) 22: 1400–1405, 2014. [DOI] [PMC free article] [PubMed] [Google Scholar]
- 20.Galassetti P, Shiota M, Zinker BA, Wasserman DH, Cherrington AD. A negative arterial-portal venous glucose gradient decreases skeletal muscle glucose uptake. Am J Physiol Endocrinol Metab 275: E101–E111, 1998. [DOI] [PubMed] [Google Scholar]
- 21.Golden S, Wals PA, Katz J. An improved procedure for the assay of glycogen synthase and phosphorylase in rat liver homogenates. Anal Biochem 77: 436–445, 1977. [DOI] [PubMed] [Google Scholar]
- 22.Hannah JS, Dubey AK, Hansen BC. Postingestional effects of a high-protein diet on the regulation of food intake in monkeys. Am J Clin Nutr 52: 320–325, 1990. [DOI] [PubMed] [Google Scholar]
- 23.International Diabetes Federation. IDF Diabetes Atlas. Brussels, Belgium: International Diabetes Federation; http://www.idf.org/diabetesatlas [12 December 2014]. [Google Scholar]
- 24.Keppler D, Decker K. Glycogen: determination with amyloglycosidase. In: Methods of Enzymatic Analysis, edited by Bergmeyer HU. New York: Verlag Chemie Weinheim, Academic, 1974, p. 1127–1131. [Google Scholar]
- 25.Krssak M, Brehm A, Bernroider E, Anderwald C, Nowotny P, Dalla Man C, Cobelli C, Cline GW, Shulman GI, Waldhausl W, Roden M. Alterations in postprandial hepatic glycogen metabolism in type 2 diabetes. Diabetes 53: 3048–3056, 2004. [DOI] [PubMed] [Google Scholar]
- 26.Lilja M, Eliasson M, Eriksson M, Soderberg S. A rightward shift of the distribution of fasting and post-load glucose in northern Sweden between 1990 and 2009 and its predictors. Data from the Northern Sweden MONICA study. Diabet Med 30: 1054–1062, 2013. [DOI] [PubMed] [Google Scholar]
- 27.Magkos F, Smith GI, Reeds DN, Okunade A, Patterson BW, Mittendorfer B. One day of overfeeding impairs nocturnal glucose but not fatty acid homeostasis in overweight men. Obesity (Silver Spring) 22: 435–440, 2014. [DOI] [PMC free article] [PubMed] [Google Scholar]
- 28.McConahy KL, Smiciklas-Wright H, Birch LL, Mitchell DC, Picciano MF. Food portions are positively related to energy intake and body weight in early childhood. J Pediatr 140: 340–347, 2002. [DOI] [PubMed] [Google Scholar]
- 29.McConahy KL, Smiciklas-Wright H, Mitchell DC, Picciano MF. Portion size of common foods predicts energy intake among preschool-aged children. J Am Diet Assoc 104: 975–979, 2004. [DOI] [PubMed] [Google Scholar]
- 30.Mithieux G, Guignot L, Bordet JC, Wiernsperger N. Intrahepatic mechanisms underlying the effect of metformin in decreasing basal glucose production in rats fed a high-fat diet. Diabetes 51: 139–143, 2002. [DOI] [PubMed] [Google Scholar]
- 31.Moore MC, Coate KC, Winnick JJ, An Z, Cherrington AD. Regulation of hepatic glucose uptake and storage in vivo. Adv Nutr 3: 286–294, 2012. [DOI] [PMC free article] [PubMed] [Google Scholar]
- 32.Moore MC, Rossetti L, Pagliassotti MJ, Monahan M, Venable C, Neal D, Cherrington AD. Neural and pancreatic influences on net hepatic glucose uptake and glycogen synthesis. Am J Physiol Endocrinol Metab 271: E215–E222, 1996. [DOI] [PubMed] [Google Scholar]
- 33.Nielsen SJ, Popkin BM. Patterns and trends in food portion sizes, 1977–1998. JAMA 289: 450–453, 2003. [DOI] [PubMed] [Google Scholar]
- 34.Pettinger C, Holdsworth M, Gerber M. Meal patterns and cooking practices in Southern France and Central England. Public Health Nutr 9: 1020–1026, 2006. [DOI] [PubMed] [Google Scholar]
- 35.Piernas C, Popkin BM. Food portion patterns and trends among U.S. children and the relationship to total eating occasion size, 1977–2006. J Nutr 141: 1159–1164, 2011. [DOI] [PMC free article] [PubMed] [Google Scholar]
- 36.Piernas C, Popkin BM. Snacking increased among U.S. adults between 1977 and 2006. J Nutr 140: 325–332, 2010. [DOI] [PMC free article] [PubMed] [Google Scholar]
- 37.Popkin BM, Duffey KJ. Does hunger and satiety drive eating anymore? Increasing eating occasions and decreasing time between eating occasions in the United States. Am J Clin Nutr 91: 1342–1347, 2010. [DOI] [PMC free article] [PubMed] [Google Scholar]
- 38.Ramnanan CJ, Edgerton DS, Rivera N, Irimia-Dominguez J, Farmer B, Neal DW, Lautz M, Donahue EP, Meyer CM, Roach PJ, Cherrington AD. Molecular characterization of insulin-mediated suppression of hepatic glucose production in vivo. Diabetes 59: 1302–1311, 2010. [DOI] [PMC free article] [PubMed] [Google Scholar]
- 39.Rizzo MA, Piston DW. Regulation of beta cell glucokinase by S-nitrosylation and association with nitric oxide synthase. J Cell Biol 161: 243–248, 2003. [DOI] [PMC free article] [PubMed] [Google Scholar]
- 40.Rodriguez-Ramirez S, Mundo-Rosas V, Garcia-Guerra A, Shamah-Levy T. Dietary patterns are associated with overweight and obesity in Mexican school-age children. Arch Latinoam Nutr 61: 270–278, 2011. [PubMed] [Google Scholar]
- 41.Roesler WJ, Pugazhenthi S, Khandelwal RL. Hepatic glycogen metabolism in the db/db mouse. Mol Cell Biochem 92: 99–106, 1990. [DOI] [PubMed] [Google Scholar]
- 42.Rolls BJ, Roe LS, Kral TV, Meengs JS, Wall DE. Increasing the portion size of a packaged snack increases energy intake in men and women. Appetite 42: 63–69, 2004. [DOI] [PubMed] [Google Scholar]
- 43.Satake S, Moore MC, Igawa K, Converse M, Farmer B, Neal DW, Cherrington AD. Direct and indirect effects of insulin on glucose uptake and storage by the liver. Diabetes 51: 1663–1671, 2002. [DOI] [PubMed] [Google Scholar]
- 44.Skov AR, Toubro S, Ronn B, Holm L, Astrup A. Randomized trial on protein vs carbohydrate in ad libitum fat reduced diet for the treatment of obesity. Int J Obes Relat Metab Disord 23: 528–536, 1999. [DOI] [PubMed] [Google Scholar]
- 45.Smiciklas-Wright H, Mitchell DC, Mickle SJ, Goldman JD, Cook A. Foods commonly eaten in the United States, 1989–1991 and 1994–1996: are portion sizes changing? J Am Diet Assoc 103: 41–47, 2003. [DOI] [PubMed] [Google Scholar]
- 46.Smith GI, Magkos F, Reeds DN, Okunade AL, Patterson BW, Mittendorfer B. One day of mixed meal overfeeding reduces hepatic insulin sensitivity and increases VLDL particle but not VLDL-triglyceride secretion in overweight and obese men. J Clin Endocrinol Metab 98: 3454–3462, 2013. [DOI] [PMC free article] [PubMed] [Google Scholar]
- 47.Steinberg D, Vaughan M, Margolis S. Studies of triglyceride biosynthesis in homogenates of adipose tissue. J Biol Chem 236: 1631–1637, 1961. [Google Scholar]
- 48.Torres TP, Fujimoto Y, Donahue EP, Printz RL, Houseknecht KL, Treadway JL, Shiota M. Defective glycogenesis contributes toward the inability to suppress hepatic glucose production in response to hyperglycemia and hyperinsulinemia in zucker diabetic fatty rats. Diabetes 60: 2225–2233, 2011. [DOI] [PMC free article] [PubMed] [Google Scholar]
- 49.Wansink B, Kim J. Bad popcorn in big buckets: portion size can influence intake as much as taste. J Nutr Educ Behav 37: 242–245, 2005. [DOI] [PubMed] [Google Scholar]
- 50.Weigle DS, Breen PA, Matthys CC, Callahan HS, Meeuws KE, Burden VR, Purnell JQ. A high-protein diet induces sustained reductions in appetite, ad libitum caloric intake, and body weight despite compensatory changes in diurnal plasma leptin and ghrelin concentrations. Am J Clin Nutr 82: 41–48, 2005. [DOI] [PubMed] [Google Scholar]