

Abstract
Previous publications from our and other groups identified E2F1 as a transcription factor involved in the regulation of inflammatory response to Toll-like receptor ligands including LPS. In this study, we challenged E2F1-deficient mice with LPS systemically and demonstrated decreased survival despite attenuated inflammatory response compared with controls. Gene expression profiling of liver tissue identified a dampened transcriptional response in the coagulation cascade in B6;129E2F1−/− compared with B6x129 F2 mice. These data were further corroborated by increased prothrombin time, activated partial thromboplastin time, and fibrin split products in the blood of E2F1-deficient mice, suggesting disseminated intravascular coagulation as a consequence of uncontrolled sepsis providing at least a partial explanation for their decreased survival despite attenuated inflammatory response. To identify novel miRNAs involved in the innate immune response to LPS, we also performed miRNA profiling of liver tissue from B6;129E2F1−/− and B6x129 F2 mice treated with LPS systemically. Our analysis identified a set of miRNAs and their mRNA targets that are significantly differentially regulated in E2F1-deficient but not control mice including let-7g, miR-101b, miR-181b, and miR-455. These miRNAs represent novel regulators of the innate immune response. In summary, we used transcriptional and miRNA profiling to characterize the response of E2F1-deficient mice to systemic LPS.
Keywords: coagulation, gene expression, mRNA, miRNA
sepsis is the most common cause of death in intensive care units (750,000 cases in the United States in 1995) with a mortality rate of 28–40% (2). The well-characterized sepsis cascade is initiated by the release of bacterial toxins, leading to unregulated inflammatory response, systemic inflammatory response syndrome, and often to multiple organ failure. Many critically ill patients with sepsis develop coagulation abnormalities. Increasing evidence points to the extensive cross talk between the inflammation and coagulation systems, whereby inflammation leads to activation of coagulation and coagulation also markedly affects inflammatory activity (11). These same studies also suggest that systemic activation of coagulation and inflammation in critically ill patients often has organ-specific consequences relevant to the development of multiorgan failure in the setting of severe sepsis. Increased insight into the molecular mechanisms that play a role in the close relationship between inflammation and coagulation may lead to the identification of new targets for therapies that can modify excessive activation or dysregulation of these systems (11).
Endotoxin or LPS is a cell surface component of gram-negative bacteria that activates biologic mediators of shock even at low concentrations (17). At low concentrations within a localized tissue space, LPS signaling is advantageous to the host in orchestrating an appropriate antimicrobial defense and bacterial clearance mechanisms. At higher concentrations, intravenous LPS induces many of the clinical features of gram-negative sepsis, including fever, shock, leukopenia followed by leukocytosis, disseminated intravascular coagulation (DIC), and death (28). Analogous to the cytokine storm in systemic inflammatory response syndrome in humans, high doses of LPS given to mice result in the production of proinflammatory cytokines and lead to endotoxic shock (5).
Our recent study of gene expression in mice treated with LPS systemically identified the E2F1 transcription factor as a novel regulator of innate immune response in lung, liver, and spleen tissue (26). Our follow-up studies showed that RNAi-mediated inhibition or E2F1 gene deficiency lead to reduced inflammatory response to LPS in vitro and in vivo. Furthermore, a clear role for miRNAs was identified in the regulation of the innate immune response to LPS (15, 16). In the present study, we further examined B6;129E2F1−/− and B6x129 F2 mice in the systemic LPS model and used gene expression profiling to identify a defect in the coagulation cascade that contributes to decreased survival of B6;129E2F1−/− mice despite their reduced systemic inflammatory response. We also studied miRNA expression profiles and identified miRNAs that are differentially expressed in B6;129E2F1−/− but not B6x129 F2 mice.
MATERIALS AND METHODS
Animal model.
All animal work was approved by Institutional Use and Animal and Care Committee at National Institute of Environmental Health Sciences and National Jewish Health. Every effort was made to ensure that discomfort, distress, or pained injury to animals was limited to that which is unavoidable in the conduct of scientifically sound research. B6;129E2F1−/− and B6x129 F2 control mice were obtained from Jackson Laboratories.
We used an established model of endotoxic shock in which mice are injected with a high dose of LPS with no d-galactosamine sensitization (5). Lyophilized purified Escherichia coli 0111:B4 LPS (Sigma, St. Louis, MO) was dissolved in sterile saline. Male mice, 6–8 wk old, were injected intraperitoneally with 30 or 40 mg/kg body wt of LPS or sterile saline control.
One group of mice that received LPS (n = 8; 40 mg/kg dose) was observed for 5 days and killed according to guidelines set by Morton and Griffiths (14). Briefly, mice were monitored for dehydration and lack of eating (determined by lack of defecation), and were given water and mash food in petri dishes, if necessary. Mice in this group were also provided with heat (heating pads or heated racks). If an animal became moribund, as demonstrated by weight loss >15% body wt, hunched posture, rough haircoat, and/or inability to eat or drink, they were killed prior to the planned study termination. Additionally, the illness severity scoring system (1) was used to monitor activity level during experiments to predict impending death. An activity score of 2 or less was cause for killing. Mice not demonstrating these signs were killed at the end of the experiment (day 5) by CO2 asphyxiation and cardiac puncture as secondary killing. The study was repeated and combined data were used to construct Kaplan-Meier survival curves. Animals that received saline only (n = 8) were also observed for 5 days and showed no clinical signs. No blood or tissue was collected from this group of animals.
A second group of animals (n = 8; 30 mg/kg dose) was killed 3, 6, 12, or 20 h post-LPS for blood and organ collection. Control mice (n = 8) were killed 6 h following the saline injection. Blood was collected in citrate tubes for measurement of prothrombin time (PT) and activated partial thromboplastin time (aPTT), performed by Advanced Diagnostic Laboratories at National Jewish Health, and for the measurement of fibrin split products by ELISA (Uscn Life Sciences, Wuhan China). Cytokines in the serum (IL-1β, IL-6, and TNF-α) were quantified by ELISA (R&D Systems, Minneapolis, MN) per manufacturer's directions. RNA was isolated from flash-frozen liver tissue using the mirVana kit (Ambion, Austin TX). Lung, liver, and spleen tissue sections were cut from OCT medium blocks and subsequently stained using hematoxylin and eosin stain, used to perform fluorescent terminal deoxyneucleotidyl transferase-mediated dUTP nick-end labeling (TUNEL) assays according to manufacturer's instructions (DeadEnd Fluorometric TUNEL System, Promega, Madison WI), or stained with an antibody for active Casp3. For this staining, active Casp3 antibody (Abcam, Cambridge MA) was added to histological sections at 3.3 μg/ml final concentration and incubated overnight. Secondary staining was performed with 3,3′-diaminobenzidine using the ImmPRESS kit (Vector Laboratories, Burlingame CA) and active Casp3 was visualized using the peroxidase substrate (ImmPact DAB kit). The sections were counterstained with hematoxylin and fixed in 4% paraformaldehyde. The primary antibody was replaced by nonimmune serum for negative control slides.
Gene expression profiling.
Total RNA for mRNA analysis was labeled with the Cy3 dye using the QuickAmp labeling kit and hybridized on mouse whole genome 4 × 44 k arrays using protocols from Agilent Technologies (Palo Alto CA). Arrays were scanned on the Agilent microarray scanner, and intensities were extracted from array images using Agilent Feature Extraction. All primary data have been deposited to the Gene Expression Omnibus database (http://www.ncbi.nlm.nih.gov/geo/) under accession no. GSE33901. Data were normalized and scaled in Agi4x44PreProcess [(18); www.bioconductor.org], and differentially expressed genes were identified using significance analysis of microarrays (SAM) in Multixperiment Viewer [(19); www.tm4.org]. Differentially expressed genes in LPS- compared with saline-treated mice were identified separately in B6;129E2F1−/−, and B6x129 F2 strains were identified by using SAM with all 924 unique permutations and setting the false discovery rate (FDR) at 1%. Pathway analysis of genes significant at 1% FDR was performed in Ingenuity Pathway Analysis.
miRNA profiling.
miRNAs were fluorescently labeled using FlashTag Biotin RNA Labeling Kits (Genisphere, Hatfield, PA) and hybridized to GeneChip miRNA 1.0 arrays (Affymetrix, Santa Clara CA) according to manufacturer's protocols. The miRNA array dataset was normalized by Robust Multi-array Average background correction followed by quantile normalization in Partek software. All other species on the array were filtered out, and 609 mouse miRNAs were included in analysis. Differentially expressed miRNAs were identified using SAM in Multixperiment Viewer [(19); www.tm4.org]. All primary data have been deposited to the Gene Expression Omnibus database (http://www.ncbi.nlm.nih.gov/geo/) under accession no. GSE33900. Differentially expressed miRNA in LPS- compared with saline-treated mice were identified separately in B6;129E2F1−/− and B6x129 F2 strains using SAM with all 924 unique permutations and setting the FDR at 1%. mRNA targets of differentially expressed miRNAs were identified using TargetScan5.1, and their differential expression in E2F1-deficient mice (but not in control mice) in response to LPS was identified by two-factor ANOVA implementation in a Multixperiment Viewer using 1,000 permutations and setting significance threshold to P < 0.01.
Quantitative RT-PCR.
Primers were designed using Primer-BLAST. RNA was normalized to a concentration of 100 ng/μl and reverse transcribed to cDNA using the Applied Biosystems High Capacity cDNA Reverse Transcription Kit. Each 20-μl PCR contained 15 ng cDNA, 0.5 μM final concentration of forward and reverse primers, and ×1 final concentration of the Power SYBR Green master mix. Real-time PCR was performed on an Applied Biosystems Viia 7 instrument using the following profile: 50°C for 2 min, 95°C for 10 min, and 40 cycles of 95°C for 15 s, and 60°C for 1 min. Dissociation curves were collected at the end of each run. miRNA abundance was measured using Taqman assays (Applied Biosystems). Briefly, reverse transcription was performed with the MultiScribe enzyme and miRNA-specific RT primer, followed by real-time PCR with miRNA Taqman probes. Both mRNA and miRNA data were analyzed using the ΔΔCT relative quantification method (16). ΔCT values were calculated relative to β-actin for mRNA and U6 for miRNA, and ΔΔCT values were calculated by comparison among different groups of samples.
Statistical analysis.
All data, with the exception of gene expression and miRNA arrays, were analyzed using GraphPad (San Diego, CA) Prism statistical software and expressed as means ± SE. Comparisons between groups were made with the two-tailed Mann-Whitney U-test. Comparison of survival curves was performed using the Mantel-Cox log-rank test.
RESULTS
E2F1-deficient mice are more sensitive to systemic LPS despite attenuated inflammatory response.
In this study, we first challenged B6;129E2F1−/− and B6x129 F2 mice with LPS and observed mice for survival over 5 days. Survival curves presented in Fig. 1 show that E2F1-deficient mice are more sensitive to the systemic LPS challenge compared with control mice despite the presence of reduced serum concentrations of proinflammatory cytokines TNF-α, IL-6, and IL-1β in our previous (26) as well as in the present study at an early time point (3 h post-LPS) (data not shown). This observation suggests that factors other than the systemic inflammatory response syndrome contribute to decreased survival of E2F1-deficient mice.
Fig. 1.
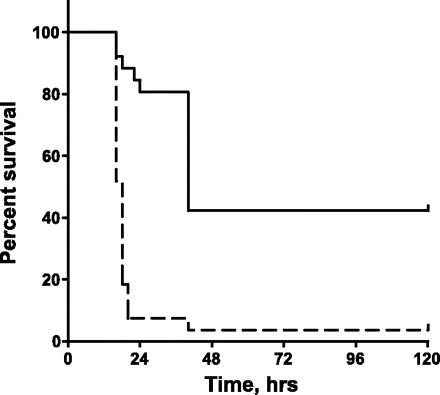
B6;129E2F1−/− mice (dashed line) are more sensitive than B6x129 F2 controls (solid line) to systemic LPS challenge (n = 27 in each group). Curve comparison was performed using the Mantel-Cox log-rank test implemented in GraphPad Prism (P < 0.0001).
In an attempt to identify the cause of increased sensitivity to LPS of B6;129E2F1−/− mice, we treated B6;129E2F1−/− and B6x129 F2 with LPS systemically, and collected organs at 3, 6, 12, and 20 h post-LPS for histological analysis and apoptosis assays. E2F1-deficient and wild-type mice have high, but comparable, levels of diffuse acute inflammation in the lung both at early and late time points. In addition, no differences were observed in the lung histologically but both strains were found to have widened alveolar septa at 20 h posttreatment (Fig. 2A). Similarly, E2F1-deficient and wild-type mice both have widespread inflammation in the liver at 6 h post-LPS with only spotty inflammation and necrosis at 20 h (Fig. 2A). Finally, both groups of mice have expanded and dilated liver sinusoids 20 h post-LPS (Fig. 2A). Therefore, no significant histological differences were observed in lung, liver, and spleen tissue of E2F1-deficient and wild-type mice.
Fig. 2.
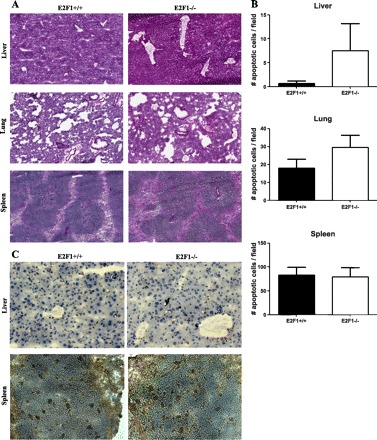
Assessment of histological abnormalities and apoptosis in liver, lung, and spleen tissue of E2F1-deficient mice 20 h after systemic LPS. A: representative hematoxylin and eosin sections of liver, lung, and spleen tissue at ×10 magnification. B: number of apoptotic cells per field in liver, lung, and spleen tissue, represented mean ± SE of 6 animals. Data were collected using the fluorescent terminal deoxyneucleotidyl transferase-mediated dUTP nick-end labeling assay with nuclear 4,6-diamidino-2-phenylindole stain and apoptotic cells marked by fluorescein-12-dUTP-labeled fragmented DNA. C: representative active Casp3 stains of liver and spleen tissue.
Given the prominent role of E2F1 in control of apoptosis (4), we also assessed apoptosis in lung, liver, and spleen tissue of E2f1-deficient and control mice 20 h post-LPS using fluorescent TUNEL assays. Overall very few apoptotic cells were identified in lung and liver tissue, while spleen has substantially more apoptotic cells. More apoptosis is present in the lung and liver tissue of some but not all B6;129E2F1−/− animals compared with B6x129 F2 controls, with no significant differences between the groups (Fig. 2B). No differences in apoptosis in the spleen were observed between the two groups of animals (Fig. 2B). To confirm TUNNEL data, we also stained liver and spleen tissue with an antibody for active Casp3 and detected minimal apoptosis in liver tissue and substantial number of apoptotic cells in spleen tissue with minimal differences in apoptosis between the two strains in both organs (Fig. 2C). We therefore conclude that differences in apoptosis most likely do not account for the increased sensitivity of B6;129E2F1−/− mice to LPS.
Gene expression profiling identifies a defect in the coagulation cascade in E2F1-deficient mice.
To identify pathways that may be responsible for the increased sensitivity of E2F1-deficient mice to systemic LPS in an unbiased manner, we profiled liver tissue from B6;129E2F1−/− and B6x129 F2 mice treated with saline or LPS on gene expression microarrays. Differentially expressed genes in response to LPS compared with saline control treatment were identified separately for the two strains of mice using SAM at the 1% FDR level of significance. Venn diagrams in Fig. 3A and gene lists in Supplemental Table S1 (available with the online version of this article) summarizes differential expression in the two strains at 6 and 20 h post-LPS treatment. Pronounced transcriptional response with many differentially expressed genes is present in control mice at 6 h post-LPS, while the E2F1-deficient mice exhibit minimal transcriptional response at this time point. This is consistent with the reduced inflammatory response in E2F1-deficient mice (26) and the evidence that E2F1 is a crucial transcriptional activator recruited by NF-κB in response to TLR4 stimulation by LPS (12). On the other hand, a significant number of genes are differentially expressed in E2F1-deficient mice 20 h post-LPS treatment, and the majority of them overlap with the genes that are differentially expressed in control mice (Fig. 3A).
Fig. 3.

Transcriptional profiles of liver tissue of mice treated with LPS or saline systemically for 6 or 20 h. A: Venn diagrams depicting differentially expressed genes in B6;129E2F1−/− and B6x129 F2 mice in response to LPS, as determined by significance analysis of microarrays (SAM) [1% false discovery rate (FDR); 924 unique permutations]. Very few genes are differentially expressed in B6;129E2F1−/− mice 6 h post-LPS, while many more are differentially expressed 20 h post-LPS. B: top 15 significantly enriched canonical pathways in gene lists from the Venn diagrams in A. NO, nitric oxide; ROS, reactive oxygen species; RXR, retinoid X receptor; LXR, liver X receptor; TR, thyroid hormone receptor; mTOR, mammalian target of rapamycin; HIF-1α, hypoxia inflammation factor 1α; NRF2, nuclear factor-erythroid-related factor 2. Black bars represent B6x129 F2 mice and gray bars represent B6;129E2F1−/− mice. The coagulation system is one of the few pathways enhanced in E2F-deficient mice compared with controls.
We next utilized Ingenuity Pathway Analysis to identify overrepresented signaling pathways in gene lists shown in Fig. 3A. Differentially expressed genes in control mice treated with LPS for 6 h are enriched for many of the pathways known to be involved in the host response to LPS, namely, production of nitric oxide and radical oxygen species, Jak/STAT signaling, HMGB1 signaling, NF-κB signaling, IL-10 signaling, and role of pathogen recognition receptors in recognition of bacteria and viruses (Fig. 3B). No pathways are significantly enriched in the E2F1-deficient mouse line; this is not surprising given the extremely low number of differentially expressed genes included in this analysis (15 genes). At 20 h post-LPS treatment both control and E2F1-deficient mouse line datasets are enriched to a similar extent in pathways relevant to innate immune response at this later time point, namely, LPS/IL-1 mediated inhibition of retinoid X receptor function, acute phase response signaling, NRF2-mediated oxidative stress response, and IL-8 signaling. Other pathways relevant to LPS signaling are reduced in E2F1-deficient compared with control mice; these include liver X receptor/retinoid X receptor activation, HIF-1α signaling, NF-κB signaling, and mammalian target of rapamycin (mTOR) signaling. Two pathways that are slightly enhanced in E2F1-deficient compared with control mice are mitochondrial dysfunction and coagulation system.
Based on the enhancement in the number of differentially expressed genes in the coagulation cascade in E2F1-deficient mice 20 h post-LPS and our observation of an increase in internal bleeding in B6;129E2F1−/− mice at this time point, we hypothesized that their increased sensitivity to systemic LPS administration may be due to a defect in blood coagulation. To test this hypothesis, we performed in silico analysis using Genomatix MatInspector software and identified a number of E2F1 binding sites in promoters of genes involved in the coagulation cascade (Table 1), providing support for our hypothesis that a defect in the coagulation cascade could be at least one of the reasons for increased sensitivity of E2F-deficient mice to systemic LPS. We next examined in more detail, differential expression in the coagulation cascade 20 h post-LPS and observed a significant dampening of the transcriptional response in the coagulation pathway in E2F1-deficient compared with control mice in response to LPS (Fig. 4A); this is the case for both genes that do and do not contain E2F1 binding sites within their promoters. Next, we examined expression of selected coagulation cascade genes by quantitative RT-PCR to confirm our microarray findings (Fig. 4B). At 20 h following LPS, we observed decreased expression in three selected genes that contain E2F1 binding sites in their promoters (Klkb1, Plaur, and SerpinA5) and two selected genes with no E2F1 binding sites in their promoters (Serpind1 and Thbd). Finally, we collected blood in sodium citrate tubes 20 h post-LPS and measured PT, aPTT, and fibrin split products. All three measurements of blood coagulation were significantly elevated in E2F1-deficient mice compared with controls (Fig. 5). There were no differences between the two strains of mice in PT, aPTT, and fibrin split products in saline-treated animals (data not shown). These findings suggest that E2F1-deficient mice likely develop DIC as a consequence of uncontrolled sepsis providing at least a partial explanation for their decreased survival despite attenuated inflammatory response.
Table 1.
Genomatix predicitions of E2F1 binding sites in promoters of coagulation cascade genes
| Promoter Id | Gene | Species | Matrix | Start | End | Strand | Core Sim. | Matrix Sim. |
|---|---|---|---|---|---|---|---|---|
| GXP_68604 | A2m | mouse | V$E2F1_DP2.01 | 282 | 298 | + | 1 | 0.826 |
| GXP_270678 | F7 | mouse | V$E2F1_DP1.01 | 417 | 433 | − | 0.782 | 0.82 |
| GXP_2539130 | F7 | mouse | V$E2F1_DP2.01 | 311 | 327 | + | 0.783 | 0.781 |
| GXP_258342 | F8 | mouse | V$E2F1_DP1.01 | 172 | 188 | + | 0.756 | 0.812 |
| GXP_2541479 | F8 | mouse | V$E2F1_DP1.01 | 348 | 364 | − | 1 | 0.85 |
| GXP_2541480 | F8 | mouse | V$E2F1_DP1.01 | 647 | 663 | − | 1 | 0.85 |
| GXP_2541477 | F8 | mouse | V$E2F1_DP1.01 | 258 | 274 | − | 0.782 | 0.812 |
| GXP_157880 | Klkb1 | mouse | V$E2F1_DP2.01 | 502 | 518 | − | 1 | 0.819 |
| GXP_1248821 | Plaur | mouse | V$E2F1_DP1.01 | 362 | 378 | + | 1 | 0.998 |
| GXP_2525232 | Serpina5 | mouse | V$E2F1_DP1.01 | 550 | 566 | − | 1 | 0.83 |
Fig. 4.
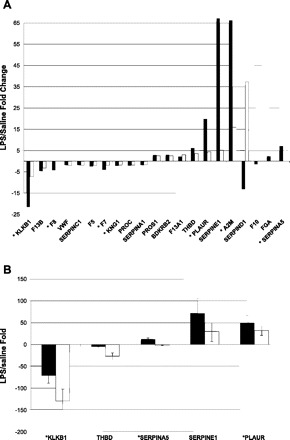
Differences in expression of selected genes in the coagulation cascade in E2F1-deficient and control mice by microarray and quantitative PCR (QPCR). A: fold changes in response to 20-h LPS treatment compared with controls of coagulation genes identified as significant by microarray analysis (1% FDR). B: QPCR validation of gene expression changes in response to LPS 20 h post-LPS. Plotted are mean LPS/saline fold changes with standard deviations of 4 mice per group. *Genes with E2F1 binding sites within their promoters.
Fig. 5.
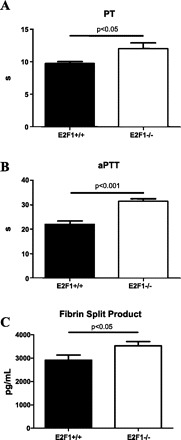
E2F1 deficiency affects blood coagulation in response to systemic LPS. B6;129E2F1−/− mice have elevated prothrombin time (PT; A) and activated partial thromboplastin time (aPTT; B), as well as the amount of fibrin split product (C) in the blood 18 h following systemic LPS challenge (n = 8 in each group). P values were calculated using the Mann-Whitney U-test. No differences in PT, aPTT, and fibrin split product were observed in the two strains of mice in response to saline treatment (data not shown).
miRNA profiling identifies novel miRNAs involved in innate immunity.
To identify miRNAs that may potentially contribute to the involvement of the E2F1 transcription factor to host response to systemic LPS, we examined genome-wide miRNA profiles in liver tissue from B6;129E2F1−/− and B6x129 F2 mice treated with saline or LPS on microarrays. Differentially expressed miRNAs in response to LPS compared with saline control treatment were identified separately for the two strains of mice using SAM at the 1% FDR level of significance. Venn diagrams in Fig. 6A and Table 2 summarize differential miRNA expression in the two strains at 6 and 20 h post-LPS treatment. In contrast to mRNA expression, a similar number of miRNAs are differentially regulated in response to LPS at 6 and 20 h. The overlap in miRNA profiles in response to LPS in E2F1-deficient and control mice is minimal, suggesting that a different set of miRNAs is involved in regulation of systemic LPS response in the absence of the E2F1 transcription factor. Finally, while the majority of miRNAs are downregulated at 6 h post-LPS in both strains of mice, at 20 h post-LPS the majority of miRNAs are downregulated in E2F-1-deficient mice but upregulated in control mice.
Fig. 6.
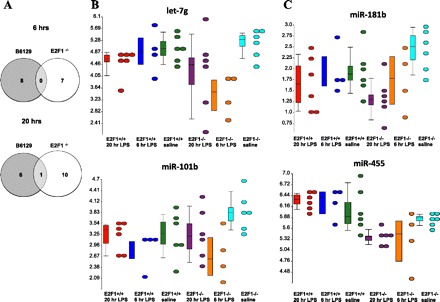
miRNA profiles of liver tissue of mice treated with LPS or saline systemically for 6 or 20 h. A: Venn diagrams depicting differentially expressed miRNAs in B6;129E2F1−/− and B6x129 F2 mice in response to LPS, as determined by SAM (1% FDR; 924 unique permutations). Similar numbers of miRNAs are differentially expressed in B6;129E2F1−/− and B6x129 F2 control mice both 6 and 20 h post-LPS with minimal overlap of miRNA expression profiles in the 2 strains of mice. B: dot plots illustrating expression levels of let-7g and miR-101b, two of the miRNAs differentially expressed in B6;129E2F1−/− but not B6x129 F2 mice 6 h post-LPS. C: dot plots illustrating expression levels of miR-181b and miR-455, two of the miRNAs differentially expressed in B6;129E2F1−/− but not B6x129 F2 mice 20 h post-LPS. Color scheme for B and C: red, B6x129 F2 20 h LPS; blue, B6x129 F2 6 h LPS; green, B6x129 F2 saline; purple, B6;129E2F1−/− 20 h LPS,; orange, B6;129E2F1−/− 6 h LPS; cyan, B6;129E2F1−/− saline.
Table 2.
Differentially expressed miRNAs (1% FDR) in response to LPS
| ID | Score, days | LPS/Saline, Fold | q-Value, % |
|---|---|---|---|
| B6129 F2 mice 6 h post-LPSH | |||
| mmu-miR-503_st | 4.13 | 5.31 | 0.00 |
| mmu-miR-689_st | 4.31 | 4.02 | 0.00 |
| mmu-miR-705_st | 5.28 | 3.22 | 0.00 |
| mmu-miR-467e-star_st | −4.03 | 0.35 | 0.00 |
| mmu-miR-335-5p_st | −3.86 | 0.12 | 0.00 |
| mmu-miR-487b_st | −3.67 | 0.27 | 0.00 |
| mmu-miR-182_st | −3.58 | 0.61 | 0.00 |
| mmu-miR-181a-1-star_st | −3.14 | 0.36 | 0.00 |
| B6;129(E2F1−/−) mice 6 h post-LPS | |||
| mmu-miR-762_st | 5.29 | 12.27 | 0.00 |
| mmu-miR-532-5p_st | −4.74 | 0.31 | 0.00 |
| mmu-let-7 g_st | −4.65 | 0.27 | 0.00 |
| mmu-miR-494_st | −4.47 | 0.20 | 0.00 |
| mmu-miR-30c_st | −4.23 | 0.60 | 0.00 |
| mmu-miR-28-star_st | −3.95 | 0.47 | 0.00 |
| mmu-miR-101b_st | −3.80 | 0.34 | 0.00 |
| B6129 F2 mice 20 h post-LPS | |||
| mmu-miR-762_st | 3.01 | 6.20 | 0.00 |
| mmu-miR-714_st | 3.24 | 2.11 | 0.00 |
| mmu-miR-705_st | 3.38 | 2.64 | 0.00 |
| mmu-miR-1224_st | 3.73 | 3.13 | 0.00 |
| mmu-miR-689_st | 3.97 | 4.46 | 0.00 |
| mmu-miR-1196_st | 4.04 | 2.46 | 0.00 |
| mmu-miR-30c_st | −4.97 | 0.56 | 0.00 |
| B6;129(E2F1−/−) mice 6 h post-LPS | |||
| mmu-miR-143_st | −3.94 | 0.46 | 0.00 |
| mmu-miR-145_st | −3.56 | 0.36 | 0.00 |
| mmu-miR-181b_st | −3.23 | 0.45 | 0.00 |
| mmu-miR-152_st | −2.96 | 0.50 | 0.00 |
| mmu-miR-148a_st | −2.94 | 0.40 | 0.00 |
| mmu-miR-455_st | −2.93 | 0.73 | 0.00 |
| mmu-miR-99b_st | −2.73 | 0.63 | 0.00 |
| mmu-miR-805_st | −2.69 | 0.42 | 0.00 |
| mmu-miR-99a_st | −2.65 | 0.56 | 0.00 |
| mmu-miR-361_st | −2.64 | 0.58 | 0.00 |
| mmu-miR-30c_st | −2.58 | 0.70 | 0.00 |
To focus on miRNAs that are specifically involved in regulation of gene expression in E2F1-deficient mice, we identified mRNA targets of miRNAs that are significantly differentially expressed in E2F1-deficient mice by TargetScan. We then used the interaction term in the two-factor ANOVA model, with the genotype and treatment as the factors, to identify mRNA targets that are differentially expressed in E2F1-deficient but not in control mice in response to LPS 6 and 20 h posttreatment. It is important to note that this analysis identified several significantly differentially expressed mRNAs in response to LPS in E2F1-deficient mice compared with control mice. This is in contrast to the genome-wide analysis of expression data (Fig. 3) that revealed no expression changes in E2F1-deficient mice 6 h post-LPS and is due to the focus on only a small number of genes in this as opposed to the genome-wide analysis.
We ranked the genes by LPS/saline fold change to focus on the top differentially expressed genes and miRNAs that regulate them (Table 3). This analysis identified a few miRNAs that are associated with anti-correlated expression of a number of top genes differentially expressed in response to LPS in E2F1-deficient mice, namely, let-7g and miR-101b at 6 h post-LPS (Table 4) and miR-181b and miR-455 at 20 h post-LPS (Table 5). Expression profiles of these miRNAs are shown in Fig. 6B (6 h LPS) and Fig. 6C (20 h LPS). Finally, we validated the expression patterns of two selected miRNA-mRNA pairs by quantitative RT-PCR (Tables 4 and 5).
Table 3.
Differential expression of selected mRNA targets in E2F1-deficient but not control mice 6 h and 20 h post-LPS
|
miRNA Expression |
mRNA Expression |
||||||||
|---|---|---|---|---|---|---|---|---|---|
| miRNA | B6129 6 h | B6129 20 h | E2F1 6 h | E2F1 20 h | Gene Symbol | B6129 6 h | B6129 20 h | E2F1 6 h | E2F1 20 h |
| 6 h post-LPS | |||||||||
| 101b | 0.8 | 1 | 0.34 | 0.7 | Tanc1 | 1.62 | 2.29 | 6.77 | 2.99 |
| 101b | 0.8 | 1 | 0.34 | 0.7 | Tera | 1.63 | 0.94 | 4.58 | 0.77 |
| let-7 g | 0.9 | 0.7 | 0.27 | 0.5 | Epha4 | 1.56 | 1.28 | 4.21 | 1.07 |
| 494 | 0.9 | 0.7 | 0.2 | 0.8 | Ebf3 | 0.57 | 1.45 | 4.05 | 1.90 |
| 101b | 0.8 | 1 | 0.34 | 0.7 | Lrch1 | 1.29 | 0.58 | 3.78 | 0.40 |
| let-7 g | 0.9 | 0.7 | 0.27 | 0.5 | Pcdh19 | 0.69 | 1.58 | 3.45 | 1.24 |
| 28-star | 0.8 | 0.7 | 0.47 | 0.8 | Psmf1 | 1.46 | 1.19 | 3.23 | 1.46 |
| 101b | 0.8 | 1 | 0.34 | 0.7 | Baz2b | 1.42 | 1.27 | 3.20 | 1.29 |
| 101b | 0.8 | 1 | 0.34 | 0.7 | Tlk2 | 0.78 | 0.75 | 3.18 | 1.64 |
| let-7 g | 0.9 | 0.7 | 0.27 | 0.5 | Zbtb5 | 1.19 | 0.98 | 2.80 | 1.18 |
| 101b | 0.8 | 1 | 0.34 | 0.7 | Kcnd2 | 0.98 | 1.08 | 2.68 | 1.40 |
| 101b | 0.8 | 1 | 0.34 | 0.7 | Zcchc2 | 1.29 | 0.88 | 2.52 | 0.72 |
| 101b | 0.8 | 1 | 0.34 | 0.7 | Otud4 | 1.21 | 1.10 | 2.44 | 1.45 |
| 28-star | 0.8 | 0.7 | 0.47 | 0.8 | Whsc1l1 | 1.16 | 0.34 | 2.34 | 0.41 |
| let-7 g | 0.9 | 0.7 | 0.27 | 0.5 | Col27a1 | 0.69 | 0.21 | 2.25 | 0.40 |
| 101b | 0.8 | 1 | 0.34 | 0.7 | Kitl | 1.07 | 0.57 | 2.21 | 0.83 |
| let-7 g | 0.9 | 0.7 | 0.27 | 0.5 | D130059P03Rik | 0.62 | 0.61 | 2.14 | 1.47 |
| 101b | 0.8 | 1 | 0.34 | 0.7 | Phf20l1 | 0.72 | 1.16 | 1.99 | 2.54 |
| 20 h post-LPS | |||||||||
| 181b | 0.8 | 1 | 0.5 | 0.45 | Hyou1 | 0.91 | 0.79 | 3.09 | 5.45 |
| 455 | 1.1 | 1.1 | 0.9 | 0.73 | Esco1 | 0.99 | 0.78 | 1.83 | 2.69 |
| 181b | 0.8 | 1 | 0.5 | 0.45 | Hsp90b1 | 0.99 | 1.25 | 0.85 | 2.67 |
| 181b | 0.8 | 1 | 0.5 | 0.45 | Bclaf1 | 0.73 | 0.73 | 1.15 | 2.57 |
| 181b | 0.8 | 1 | 0.5 | 0.45 | Phf20l1 | 0.72 | 1.16 | 1.99 | 2.54 |
| 143 | 1 | 0.8 | 0.6 | 0.46 | Pdgfra | 1.63 | 1.19 | 0.96 | 2.38 |
| 181b | 0.8 | 1 | 0.5 | 0.45 | Pdgfra | 1.63 | 1.19 | 0.96 | 2.38 |
| 455 | 1.1 | 1.1 | 0.9 | 0.73 | Cltc | 0.72 | 0.85 | 1.41 | 2.13 |
| 145 | 1.1 | 0.8 | 0.6 | 0.36 | Cpeb1 | 0.93 | 0.88 | 0.53 | 2.10 |
| 181b | 0.8 | 1 | 0.5 | 0.45 | Wnk1 | 0.33 | 0.43 | 1.17 | 1.97 |
Data were determined by TargetScan predictions of miRNAs that are differentially expressed (1%FDR by SAM). Shown are mean LPS-to-saline ratios with significant changes highlighted in bold. P < 0.01 by 2-factor ANOVA, >2-fold change.
Table 4.
Quantitative RT-PCR (qPCR) validation of selected miRNA-mRNA pairs
| miRNA/mRNA | let-7 g, Array | let-7 g, qPCR | Kitl, Array | Kitl, qPCR |
|---|---|---|---|---|
| B6129 6 h/saline | −1.13 | −1.42 ± 0.61 | 1.07 | −1.08 ± 0.10 |
| B6129 20 h/saline | −3.71 | −2.40 ± 1.11 | −1.75 | −5.05 ± 2.00 |
| E2F1 6 h/saline | −1.42 | −1.59 ± 0.28 | 2.21 | 1.53 ± 0.33 |
| E2F1 20 h/saline | −2.04 | −1.59 ± 0.33 | −1.20 | −4.33 ± 3.39 |
miRNA relative expression levels were assessed using Taqman assays, and mRNA levels were measured using SYBRGreen. Reported are means with SD of 4-6 animals. Bold indicates validated mRNA-miRNA anti-correlated expression relationship.
Table 5.
qRT-PCR validation of selected miRNA-mRNA pairs
| miRNA/mRNA | miR-181b, array | miR-181b, qPCR | Pdgfra, array | Pdgfra, qPCR |
|---|---|---|---|---|
| B6129 6 h/saline | −1.25 | −1.47 ± 0.83 | 1.63 | −2.02 ± 0.50 |
| B6129 20 h/saline | 1.00 | −2.38 ± 1.14 | 1.19 | −2.02 ± 0.78 |
| E2F1 6 h/saline | −2.00 | −2.27 ± 0.48 | 0.96 | 1.72 ± 0.46 |
| E2F1 20 h/saline | −2.22 | −3.45 ± 0.88 | 2.38 | 1.87 ± 0.40 |
miRNA relative expression levels were assessed using Taqman assays, and mRNA levels were measured using SYBRGreen. Reported are means with SD of 4-6 animals. Bold indicates validated mRNA-miRNA anti-correlated expression relationship.
DISCUSSION
In this study, we used transcriptional and miRNA profiling to characterize the response of E2F1-deficient mice to systemic LPS. Our results indicate that E2F1 deficiency leads to lack of early transcriptional response (6 h post-LPS) and reduced inflammatory response, at the transcriptional level, at a later time point (20 h post-LPS). We also show that E2F1-deficient mice have increased sensitivity to systemic LPS, despite a reduced inflammatory response, and that this increased sensitivity is partially explained by a defect in the coagulation cascade. Finally, we identified several miRNAs that are differentially regulated in E2F1-deficient mice that have not been previously implicated in innate immunity.
In our earlier publication, we demonstrated that RNAi-mediated inhibition and E2F1 gene deficiency both resulted in reduced inflammatory response of macrophages to LPS and other Toll-like receptor (TLR) ligands. These data are further supported by the recent study from another laboratory that identified E2F1 as a transcriptional activator recruited by NF-κB upon TLR4 activation in an LPS-stimulated human monocytic cell line (12). We also demonstrated that serum concentrations of several proinflammatory cytokines were significantly reduced in B6;129E2F1−/− compared with B6x129 F2 control mice in response to systemic LPS administration (26). These earlier results are now further supported by gene expression profiles of liver tissue from E2F1-deficient mice that show almost complete lack of transcriptional response 6 h post-LPS and considerably reduced inflammatory response, including NF-κB and phosphatidylinositol 3-kinase/mTOR signaling pathways, 20 h post-LPS. NF-κB is the main pathway that is activated in response to LPS stimulation (9, 21). The mTOR pathway plays a central role in cell growth and cellular responses to metabolic stress and has been shown to be activated following LPS stimulation in macrophages (25); this effect is mediated through phosphatidylinositol 3-kinase activity and p70 S6 kinase activity.
In contrast to the reduced inflammatory response, B6;129E2F1−/− mice have decreased survival compared with B6x129 F2 control mice. Our data suggest that this enhanced sensitivity to systemic LPS cannot be explained by differences in liver, lung, and spleen tissue pathology. This is especially surprising given significant differences in survival of E2F1-deficient and wild-type mice. Because both strains have widespread histological changes in response to the dose of LPS used in our study, it is likely that some subtle differences are not detectable by hematoxylin and eosin staining, while these differences are apparent at the transcriptional level of specific genes/pathways. Although E2F1 has been shown to promote vascular smooth muscle cell apoptosis and is reported to inhibit apoptosis induced by TNF-α in endothelial cells (6), and apoptosis has an established role in LPS-induced lethality (3), no consistent differences in apoptosis in liver, lung, and spleen tissue of B6;129E2F1−/− and B6x129 F2 mice in response to LPS were observed in our study. Gene expression profiles, however, revealed a decrease in expression of a number of genes involved in the coagulation cascade in E2F1-deficient mice compared with control controls. B6;129E2F1−/− mice have longer PT and activated partial thrombin time as well as elevated amounts of the fibrin split product. These data suggest that the increased sensitivity of E2F1-deficient mice to systemic LPS may be at least partially due to a defect in the coagulation cascade, resulting in DIC. DIC is known to contribute to the multiple organ dysfunction syndrome in patients with uncontrolled sepsis (8).
Our study identified a set of miRNAs that are significantly differentially regulated in E2F1-deficient but not control mice. A number of miRNAs, such as miR-155, miR-146a, and miR-9, are induced by TLR activation in innate immune cells, and these miRNAs target the 3′ untranslated regions of mRNAs encoding components of the TLR signaling system (16, 22). Two recent studies have begun to identify specific miRNAs as peripheral blood biomarkers of sepsis (23, 24). We now identify several miRNAs that have not previously been associated with the innate immune response and whose role in the regulation of the innate immune system may be tied to the E2F1 transcription factor.
We focused mainly on let-7g and miR-101b 6 h post-LPS and miR-181b and miR-455 20 h post-LPS due to the enrichment of differentially expressed mRNA targets of these miRNAs in E2F-1-deficient mice but not control mice. The potential role for these miRNAs in innate immune signaling is supported by several recent publications. The let-7g was downregulated in circulating leukocytes in an in vivo model of acute inflammation triggered by LPS infusion in human volunteers (20). miR-101a regulates activation of MAPK in macrophages by targeting MAPK phosphatase-1 (27). miR-181 is highly expressed in immune cells (22), and miR-181a was recently shown to play a key role in the pathogenesis of pediatric systemic lupus erythematosus (10). Finally, miR-455 is upregulated by both Candida albicans and LPS in macrophages, and NF-κB is necessary for transcription of its pri-miRNA (13), a result that is in agreement with our findings of downregulation of this miRNA in the absence of NF-κB signaling in E2F1-deficient mice.
There are several limitations to our study. First, the endotoxemia model does not capture all clinical characteristics of sepsis. Other complementary animal models, such as cecal puncture and ligation, should be used in the future to fully elucidate the role of E2F1 in microbial sepsis. Second, although statistically significant, differences in coagulation measurements are small and cannot alone explain the large difference in survival between E2F1-deficient and control mice, suggesting that other pathways likely contribute to increased sensitivity of E2F1-deficient mice to systemic LPS administration. Mitochondrial dysfunction is the second pathway that is enhanced in E2F1-deficient compared with control mice in our study and has a prominent role in sepsis (7), thus representing the next logical pathway for further investigation in E2F1-deficient mice. Finally, our work does not prove the causal relationship between decreased coagulation gene expression and prolonged PT, aPTT, and increased fibrin split product, nor the changed coagulation parameters and increased mortality. Further studies are needed to prove causality.
In summary, we characterized the response of E2F1-deficient mice to systemic LPS in liver tissue. We confirmed an attenuated inflammatory response and identified a defect in the coagulation cascade that increases sensitivity of these mice to systemic LPS. We also identified miRNAs whose role in the regulation of innate immune response may be tied to the E2F1 transcription factor. E2F1 and these miRNAs represent novel targets for therapy in sepsis patients.
DISCLOSURES
No conflicts of interest, financial or otherwise are declared by the author(s).
AUTHOR CONTRIBUTIONS
Author contributions: L.A.W., J.L.O., R.B., A.J.N., and H.R.R. performed experiments; L.A.W., S.G., and I.V.Y. analyzed data; L.A.W., S.G., and I.V.Y. interpreted results of experiments; L.A.W. and I.V.Y. prepared figures; L.A.W., J.L.O., R.B., A.J.N., H.R.R., S.G., D.A.S., and I.V.Y. approved final version of manuscript; D.A.S. and I.V.Y. conception and design of research; D.A.S. and I.V.Y. edited and revised manuscript; I.V.Y. drafted manuscript.
Supplementary Material
ACKNOWLEDGMENTS
We acknowledge the University of Colorado Denver Genomics Core for performing miRNA profiling on Affymetrix arrays and Dr. Kelsey Gray for critical reading of the manuscript.
REFERENCES
- 1. Aldred AJ, Cha MC, Meckling-Gill KA. Determination of a humane endpoint in the L1210 model of murine leukemia. Contemporary topics in laboratory animal science. JAALAS 41: 24–27, 2002. [PubMed] [Google Scholar]
- 2. Angus DC, Linde-Zwirble WT, Lidicker J, Clermont G, Carcillo J, Pinsky MR. Epidemiology of severe sepsis in the United States: analysis of incidence, outcome, and associated costs of care. Crit Care Med 29: 1303–1310, 2001. [DOI] [PubMed] [Google Scholar]
- 3. Bannerman DD, Goldblum SE. Mechanisms of bacterial lipopolysaccharide-induced endothelial apoptosis. Am J Physiol Lung Cell Mol Physiol 284: L899–L914, 2003. [DOI] [PubMed] [Google Scholar]
- 4. Biswas AK, Johnson DG. Transcriptional and nontranscriptional functions of E2F1 in response to DNA damage. Cancer Res 72: 13–17, 2012. [DOI] [PMC free article] [PubMed] [Google Scholar]
- 5. Buras JA, Holzmann B, Sitkovsky M. Animal models of sepsis: setting the stage. Nat Rev Drug Discov 4: 854–865, 2005. [DOI] [PubMed] [Google Scholar]
- 6. Chen M, Capps C, Willerson JT, Zoldhelyi P. E2F-1 regulates nuclear factor-κB activity and cell adhesion: potential antiinflammatory activity of the transcription factor E2F-1. Circulation 106: 2707–2713, 2002. [DOI] [PubMed] [Google Scholar]
- 7. Galley HF. Oxidative stress and mitochondrial dysfunction in sepsis. Br J Anaesth 107: 57–64, 2011. [DOI] [PubMed] [Google Scholar]
- 8. Gando S. Microvascular thrombosis and multiple organ dysfunction syndrome. Crit Care Med 38: S35–S42, 2010. [DOI] [PubMed] [Google Scholar]
- 9. Ishii KJ, Koyama S, Nakagawa A, Coban C, Akira S. Host innate immune receptors and beyond: making sense of microbial infections. Cell Host Microbe 3: 352–363, 2008. [DOI] [PubMed] [Google Scholar]
- 10. Lashine YA, Seoudi AM, Salah S, Abdelaziz AI. Expression signature of microRNA-181-a reveals its crucial role in the pathogenesis of paediatric systemic lupus erythematosus. Clin Exp Rheumatol 29: 351–357, 2011. [PubMed] [Google Scholar]
- 11. Levi M, van der Poll T. Inflammation and coagulation. Crit Care Med 38: S26–S34, 2010. [DOI] [PubMed] [Google Scholar]
- 12. Lim CA, Yao F, Wong JJ, George J, Xu H, Chiu KP, Sung WK, Lipovich L, Vega VB, Chen J, Shahab A, Zhao XD, Hibberd M, Wei CL, Lim B, Ng HH, Ruan Y, Chin KC. Genome-wide mapping of RELA(p65) binding identifies E2F1 as a transcriptional activator recruited by NF-κB upon TLR4 activation. Mol Cell 27: 622–635, 2007. [DOI] [PubMed] [Google Scholar]
- 13. Monk CE, Hutvagner G, Arthur JS. Regulation of miRNA transcription in macrophages in response to Candida albicans. PloS One 5: e13669, 2011. [DOI] [PMC free article] [PubMed] [Google Scholar]
- 14. Morton DB, Griffiths PH. Guidelines on the recognition of pain, distress and discomfort in experimental animals and an hypothesis for assessment. Vet Rec 116: 431–436, 1985. [DOI] [PubMed] [Google Scholar]
- 15. O'Connell RM, Rao DS, Chaudhuri AA, Baltimore D. Physiological and pathological roles for microRNAs in the immune system. Nat Rev Immunol 10: 111–122, 2010. [DOI] [PubMed] [Google Scholar]
- 16. O'Neill LA, Sheedy FJ, McCoy CE. MicroRNAs: the fine-tuners of Toll-like receptor signalling. Nat Rev Immunol 11: 163–175, 2011. [DOI] [PubMed] [Google Scholar]
- 17. Opal SM. Endotoxins and other sepsis triggers. Contrib Nephrol 167: 14–24, 2010. [DOI] [PubMed] [Google Scholar]
- 18. Reimers M, Carey VJ. Bioconductor: an open source framework for bioinformatics and computational biology. Methods Enzymol 411: 119–134, 2006. [DOI] [PubMed] [Google Scholar]
- 19. Saeed AI, Sharov V, White J, Li J, Liang W, Bhagabati N, Braisted J, Klapa M, Currier T, Thiagarajan M, Sturn A, Snuffin M, Rezantsev A, Popov D, Ryltsov A, Kostukovich E, Borisovsky I, Liu Z, Vinsavich A, Trush V, Quackenbush J. TM4: a free, open-source system for microarray data management and analysis. Biotechniques 34: 374–378, 2003. [DOI] [PubMed] [Google Scholar]
- 20. Schmidt WM, Spiel AO, Jilma B, Wolzt M, Muller M. In vivo profile of the human leukocyte microRNA response to endotoxemia. Biochem Biophys Res Commun 380: 437–441, 2009. [DOI] [PubMed] [Google Scholar]
- 21. Takeuchi O, Akira S. Pattern recognition receptors and inflammation. Cell 140: 805–820, 2010. [DOI] [PubMed] [Google Scholar]
- 22. Tsitsiou E, Lindsay MA. microRNAs and the immune response. Curr Opin Pharmacol 9: 514–520, 2009. [DOI] [PMC free article] [PubMed] [Google Scholar]
- 23. Vasilescu C, Rossi S, Shimizu M, Tudor S, Veronese A, Ferracin M, Nicoloso MS, Barbarotto E, Popa M, Stanciulea O, Fernandez MH, Tulbure D, Bueso-Ramos CE, Negrini M, Calin GA. MicroRNA fingerprints identify miR-150 as a plasma prognostic marker in patients with sepsis. PloS one 4: e7405, 2009. [DOI] [PMC free article] [PubMed] [Google Scholar]
- 24. Wang JF, Yu ML, Yu G, Bian JJ, Deng XM, Wan XJ, Zhu KM. Serum miR-146a and miR-223 as potential new biomarkers for sepsis. Biochem Biophys Res Commun 394: 184–188, 2010. [DOI] [PubMed] [Google Scholar]
- 25. Weinstein SL, Finn AJ, Dave SH, Meng F, Lowell CA, Sanghera JS, DeFranco AL. Phosphatidylinositol 3-kinase and mTOR mediate lipopolysaccharide-stimulated nitric oxide production in macrophages via interferon-β. J Leukoc Biol 67: 405–414, 2000. [DOI] [PubMed] [Google Scholar]
- 26. Yang IV, Alper S, Lackford B, Rutledge H, Warg LA, Burch LH, Schwartz DA. Novel regulators of the systemic response to lipopolysaccharide. Am J Respir Cell Mol Biol 45: 393–402, 2011. [DOI] [PMC free article] [PubMed] [Google Scholar]
- 27. Zhu QY, Liu Q, Chen JX, Lan K, Ge BX. MicroRNA-101 targets MAPK phosphatase-1 to regulate the activation of MAPKs in macrophages. J Immunol 185: 7435–7442, 2010. [DOI] [PubMed] [Google Scholar]
- 28. Ziegler EJ, McCutchan JA, Fierer J, Glauser MP, Sadoff JC, Douglas H, Braude AI. Treatment of gram-negative bacteremia and shock with human antiserum to a mutant Escherichia coli. N Engl J Med 307: 1225–1230, 1982. [DOI] [PubMed] [Google Scholar]
Associated Data
This section collects any data citations, data availability statements, or supplementary materials included in this article.