

Abstract
Background
Inhibitors of poly-ADP ribose polymerase (PARP), an enzyme involved in base excision repair (BER) have demonstrated single agent activity against tumors deficient in homologous repair processes. Ewing sarcoma cells are also sensitive to PARP inhibitors, although the mechanism is not understood. Here we evaluated the stereo-selective PARP inhibitor, talazoparib (BMN 673), combined with temozolomide or topotecan.
Procedures
Talazoparib was tested in vitro in combination with temozolomide (0.3–1,000 μmol/L) or topotecan (0.03-100 nmol/L) and in vivo at a dose of 0.1 mg/kg administered twice daily for 5 days combined with temozolomide (30 mg/kg/daily x 5; combination A) or 0.25 mg/kg administered twice daily for 5 days combined with temozolomide (12 mg/kg/daily x 5; combination B).
Results
In vitro talazoparib potentiated the toxicity of temozolomide up to 85-fold, with marked potentiation in Ewing sarcoma and leukemia lines (30–50-fold). There was less potentiation for topotecan. In vivo, talazoparib potentiated the toxicity of temozolomide, and Combination A and Combination B represent the maximum tolerated doses when combined with low dose or high dose talazoparib, respectively. Both combinations demonstrated significant synergism against 5 of 10 Ewing sarcoma xenografts. The combination demonstrated modest activity against most other xenograft models. Pharmacodynamic studies showed a treatment-induced complete loss of PARP only in tumor models sensitive to either talazoparib alone or talazoparib plus temozolomide.
Conclusions
The high level of activity observed for talazoparib plus temozolomide in Ewing sarcoma xenografts makes this an interesting combination to consider for pediatric evaluation.
Keywords: Preclinical Testing, Developmental Therapeutics, PARP inhibitor
INTRODUCTION
Poly(ADP-ribose) polymerase1 (PARP1) plays a central role in the recognition of single-strand DNA damage and is involved in chromatin modification, transcription, and DNA repair (1). PARP1 binds to DNA at the 5’-deoxyribose phosphate (5’dRP) end of the DNA strand breaks produced by AP endonuclease 1 (APE1) (2, 3). DNA binding activates PARP1 to utilize nicotinamide adenine dinucleotide (NAD+) as a substrate to add polymers of ADP-ribose to both itself and to other proteins. PARP1 additionally interacts with proteins involved in DNA double-strand break response (4), plays a role in alternative non-homologous end joining (4), and contributes to repair of topoisomerase-1 (Top1) cleavable complexes through interactions with tyrosyl-DNA phosphodiesterase 1 (5).
PARP1 inhibitors were initially developed as potentiators of anticancer DNA damaging agents, with the first clinical evaluation in 2003 being a phase 0/1 trial of rucaparib with temozolomide (6). In the intervening decade, clinical trials combining PARP inhibitors with chemotherapy agents have often shown potentiation of the toxic effects of chemotherapy. For example, most adults could not tolerate full-dose temozolomide when given with a PARP-inhibiting dose of rucaparib (7), and the temozolomide dose required a 30% reduction when given with veliparib for children with brain tumors (8). Similarly, the single agent dose of topotecan had to be reduced by more than 2-fold when administered with a PARP-depleting dose of veliparib (9). Although definitive clinical trial results have not been reported, the clinical activity observed with combinations of PARP inhibitors and various chemotherapy agents has in general not been clearly superior to that of the corresponding single agents given at full dose (7, 10, 11).
The finding of synthetic lethality for PARP inhibition in the presence of defects in homologous DNA repair stimulated evaluations of PARP inhibitors as single agents against cancers arising in patients with BRCA mutations (12, 13). The molecular basis of this sensitivity is thought to be conversion of single-strand DNA breaks to double strand breaks during DNA replication. While these double-strand breaks can be repaired in patients with intact homologous recombination repair, they lead to lethal lesions in tumors with defective double-stand DNA repair such as those with homozygous BRCA1 or BRCA2 mutations. As described below, PARP trapping may also contribute to the cytotoxic effect of PARP inhibitors in cells with defective homologous recombination repair. Multiple PARP inhibitors have shown single agent activity against cancers arising in patients with BRCA1 or BRCA2 mutations (14–16), and phase 3 clinical trials are ongoing for ovarian cancer and breast cancer.
Interest in PARP inhibitors for pediatric cancers was stimulated by reports of preferential sensitivity of Ewing sarcoma cell lines to PARP inhibitors (17, 18). One report evaluating the activity of a range of anticancer agents across a large cell line panel found a highly significant association between cell lines with the EWS-FLI1 rearrangement and sensitivity to the PARP inhibitor olaparib (AZD2281) (17). A second report described an interaction between EWS-FLI1 and PARP1 as well as the sensitivity of Ewing cell lines to PARP1 inhibition and the responsiveness of a Ewing sarcoma xenograft to the combination of olaparib and temozolomide (18).
PARP1 inhibitors have been thought to potentiate the activity of chemotherapy agents through their inhibition of the catalytic activity PARP1, leading to delays in repair and in subsequent accumulation of single strand DNA breaks (19). More recently it has become clear that some PARP1 inhibitors have a second, distinctive mechanism of action related to their ability to tightly trap PARP1 to DNA at sites of DNA single-strand breaks (20, 21). The PARP-DNA complexes are more cytotoxic than unrepaired single-stand DNA breaks caused by inhibition of PARP enzymatic activity (20). The ability of PARP inhibitors to trap PARP is unrelated to their potency in inhibiting PARP1 enzymatic activity, and the inhibitors differ in their potency at PARP trapping (talazoparib ≫ olaparib and rucaparib ≫ veliparib) (20, 22). Chemotherapy agents likewise differ in their ability to induce PARP1 trapping, with methylating agents such as methyl methane sulfonate (MMS) and temozolomide being highly effective and with agents like Top1 inhibitors, cisplatin, and etoposide being ineffective (20, 22, 23).
Talazoparib is a potent, selective PARP1/2 inhibitor (PARP1 IC50= 0.57 nmol/L) that shows antitumor cytotoxicity at much lower concentrations than earlier generation PARP1/2 inhibitors (such as olaparib, rucaparib, and veliparib) (24). Talazoparib is readily orally bioavailable, is highly effective in vivo against BRCA-deficient xenografts (24), and shows potent PARP trapping activity (22). Talazoparib has entered clinical evaluation and shown impressive antitumor activity in BRCA-mutated patients with ovarian cancer and breast cancer (16). A phase 3 clinical trial is evaluating talazoparib for patients with germline BRCA mutations and locally advanced and/or metastatic breast cancer (NCT01945775).
The Pediatric Preclinical Testing Program (PPTP) evaluated talazoparib as a single agent against its in vitro cell line and in vivo tumor panels (25). The median relative IC50 (rIC50) for talazoparib against the PPTP cell lines was 26 nM, with a trend for lower rIC50 values for the Ewing cell line panel compared to the non-Ewing lines (6 nM versus 31 nMol/L, p=0.057). Despite the in vitro sensitivity of the Ewing cell lines to talazoparib, the agent showed minimal in vivo activity against Ewing xenografts. Among the 35 solid tumor xenografts tested against single agent talazoparib, the two xenografts showing objective responses were a Wilms tumor xenograft and a medulloblastoma xenograft, both of which also showed maintained complete responses (MCR) to cisplatin(25).
The lack of in vivo single agent activity for talazoparib against the Ewing xenografts was disappointing, given the in vitro evidence for enhanced sensitivity of Ewing cell lines to PARP inhibition. In considering alternative approaches to exploit this apparent differential sensitivity, evaluations of talazoparib in combination with temozolomide were pursued. Prioritization of this strategy was based in part on the emerging evidence that PARP1 inhibitors are cytotoxic by PARP trapping initiated by PARP1 binding to DNA with single-strand breaks (20). Another factor supporting prioritization of this combination was evidence that methylating agents such as MMS and temozolomide are particularly effective at creating single strand breaks that could serve as substrates for PARP trapping (3). Conceptually, the cytotoxic component of the talazoparib plus temozolomide combination was envisioned as talazoparib acting through PARP trapping. The temozolomide was envisioned as contributing by producing N7 and N3 methyl adducts of guanine and adenine, respectively, leading to DNA single strand breaks through BER that trap the PARP1-talazoparib complex tightly to DNA. In evaluating this strategy, in vitro testing of talazoparib plus temozolomide was performed to determine if the combination produced preferential sensitivity against Ewing cell lines. The in vivo testing approach of the talazoparib plus temozolomide deviated sharply from the paradigm conventionally applied to combinations of standard agents with potentiating agents. Rather than maintaining the dose of temozolomide at its standard in vivo doses (60 – 66 mg/kg/dose) in the combination, a high dose of talazoparib was utilized which required use of a very low dose of temozolomide (12 mg/kg/dose). As described below, the combination of talazoparib plus low-dose temozolomide is remarkably effective for a subset of Ewing xenografts and for selected non-Ewing xenografts.
MATERIALS AND METHODS
In vitro testing
In vitro testing was performed using DIMSCAN, a semiautomatic fluorescence-based digital image microscopy system that quantifies viable cell numbers (using fluorescein diacetate [FDA]) in tissue culture multiwell plates (26). Cells were incubated in the presence of drugs for 96 hours. Temozolomide was used over a concentration range of 0.3μM to 1000μM, and topotecan at 0.03 nM to 100 nM in the absence or presence of 10 nM talazoparib with analysis as previously described (27). Relative IC50 (rIC50) values represent the tested agent concentration that reduces cell survival by 50% of the maximum agent effect (28). Ymin (Observed) is the lowest value for the treated to control ratio (T/C) across all concentrations tested. Relative In/Out (I/O)% values represent the percentage difference between the Ymin value and the estimated starting cell number and either the control cell number (for agents with Ymin > starting cell number) or 0 (for agents with Ymin < estimated starting cell number). Relative I/O% values range between 100% (no treatment effect) to −100% (complete cytotoxic effect), with a Relative I/O% value of 0 being observed for a completely effective cytostatic agent. The 10 nM talazoparib concentration selected for combination testing is a biologically active concentration based on its effects against the most sensitive cell lines in the PPTP in vitro cell line panel, but it is below the rIC50 for most of the PPTP cell lines facilitating analysis of the combination testing results (25).
In vivo tumor growth inhibition studies
C.B-17 scid−/− female mice (Taconic Farms, Germantown NY), were used to propagate subcutaneously implanted kidney/rhabdoid tumors, sarcomas (Ewing, osteosarcoma, rhabdomyosarcoma), neuroblastoma, and non-glioblastoma brain tumors, while BALB/c nu/nu mice (bred and maintained at Duke University) were used for glioma models, as previously described (29). Human leukemia cells were propagated by intravenous inoculation into female NOD.CB17-Prkdcscid/J mice that were purchased from Australian BioResources (Moss Vale, Australia) (30). Female mice were used irrespective of the patient gender from which the original tumor was derived. All mice were maintained under barrier conditions and experiments were conducted using protocols and conditions approved by the institutional animal care and use committee of the appropriate consortium member. Eight to ten mice were used in each control or treatment group. Tumor volumes (cm3) [solid tumor xenografts] or percentages of human CD45-positive [%hCD45+] cells [ALL xenografts] were determined and responses were determined using three activity measures as previously described (29).
The primary activity measures were the event-free survival (EFS) T/C measure and the objective response measure. An event in the solid tumor xenograft models was defined as a quadrupling of tumor volume from the initial tumor volume, and an event for the ALL panel was defined as hCD45 cells above 25% in the peripheral blood. An EFS T/C value was defined by the ratio of the median time to event of the treatment group and the median time to event of the respective control group. For the EFS T/C measure, agents were considered highly active if they met three criteria: a) an EFS T/C > 2; b) a significant difference in EFS distributions (p≤ 0.05), and c) a net reduction in median tumor volume for animals in the treated group at the end of treatment as compared to at treatment initiation. Agents meeting the first two criteria, but not having a net reduction in median tumor volume for treated animals at the end of the study were considered to have intermediate activity. Agents with an EFS T/C < 2 were considered to have low levels of activity. The objective response measure was modeled after clinical criteria for response, with the exception of progressive disease being divided into two categories based on “Tumor growth delay” (TGD) values that were calculated using the numbers of days to event. For each individual mouse that had progressive disease and had an event in the treatment groups, a TGD value was calculated by dividing the time to event for that mouse by the median time to event in the respective control group. Median times to event were estimated based on the Kaplan-Meier event-free survival distribution. Response categories for individual treated mice were defined as follows: PD1 (Progressive Disease 1): >25% increase in tumor volume, TGD (tumor growth delay) value <1.5 ; PD2 (Progressive Disease 2): >25% increase in tumor volume, TGD value >1.5; SD (Stable Disease): <25% increase in tumor volume, <50% regression; PR (Partial response): a tumor volume regression ≥50% for at least one time point but with measurable tumor (≥ 0.10 cm3); CR (Complete response): disappearance of measurable tumor mass (< 0.10 cm3); and MCR (Maintained CR): tumor volume < 0.10 cm3 at the end of the study period. The overall objective response measure for each treatment group was based on the median objective response score for the animals in that treatment group. An in-depth description of the analysis methods is included in the Supplemental Response Definitions section.
Statistical Methods
The exact log-rank test, as implemented using Proc StatXact for SAS®, was used to compare event-free survival (EFS) distributions between treatment and control groups. P-values were two-sided and were not adjusted for multiple comparisons given the exploratory nature of the studies.
Drugs and Formulation
Talazoparib was provided to the Pediatric Preclinical Testing Program by BioMarin Pharmaceutical Inc., through the Cancer Therapy Evaluation Program (NCI). Temozolomide was obtained through the NCI Drug Repository. Talazoparib was formulated in 10% dimethylacetamide /5% Solutol HS 15/85% phosphate buffered saline and stored up to 7 days at 4°C. The solution was brought to ambient temperature and vortexed prior to oral dosing (P.O.). Talazoparib was administered twice daily (BID) for 5 days alone or in combination with daily temozolomide. Temozolomide was formulated in 1% carboxymethylcellulose in water, and stored for up to 7 days at 4°C. Based upon single agent talazoparib toxicity testing, the maximum tolerated dose (non-tumored SCID mice) was 0.25 mg/kg BID. At 0.4 MTD talazoparib (0.1 mg/kg BID) temozolomide was tolerated at 30 mg/kg daily for 5 days (Combination A). Talazoparib administered at its MTD could be combined with temozolomide at 12 mg/kg daily for 5 days (Combination B). Talazoparib and temozolomide were provided to each consortium investigator in coded vials for blinded testing.
Development of resistance to combination therapy B
Mice bearing naïve TC-71 Ewing sarcoma xenografts were treated with combination B as described above. The first tumor to regrow was transplanted into 10 mice. Five mice received Combination B (designated passage 1R). The procedure was repeated until tumors were relatively resistant to treatment with the combination.
Pharmacodyamic studies
Sample preparation
Tumors were rapidly excised and flash frozen in liquid nitrogen following were euthanization (cervical dislocation under anesthesia).Tumor samples were ground at −80°C using a pestle and a mortar. A quantity (40–50 mg) of resulting tumor powder was placed in a pre-chilled Eppendorf tube and kept on dry ice. Samples were resuspended by vortexing in 400 ul of Lysis buffer (1x Cell Signaling Lysis Buffer, 1x HALT Protease/Phosphatase inhibitor mix, 2 mM PMSF) and incubated for approximately 30 min at 4°C. After incubation, lysates were loaded into QiaShredder columns and centrifuged at 14000 x g for 15 min in a pre-cooled centrifuge. The supernatant was filtered through a non-protein binding 0.8 μm _syringe filter and was transferred to a fresh 1.5 ml Eppendorf tube; protein concentration of each sample was measured and adjusted to the final concentration of 2 μg/ul. A sample buffer (4X LDS buffer, containing 5% BME) was added to the samples; the resulting mix was incubated for 10min at 70C.
Heat reversal
20–50 mg of tumor powder was placed into a 2 ml Eppendorf tube (on dry ice) and resuspended by vortexing in 300 ul of Lysis Buffer (1x Cell Signaling Lysis Buffer, 1x HALT Protease/Phosphatase inhibitor mix, 2 mM PMSF). After 30 min incubation, samples were sonicated for 1 min (50% cycle) and centrifuged at 14 x 1000g for 15 min. After the supernatant was collected and protein concentration adjusted, samples were divided into 2 parts: 1) sample was mixed with a sample buffer (4x LDS buffer + 10%BME) and boiled for 5 min at 100°C; 2) sample was pre-heated for 5 min at 60°C before adding a sample buffer (4x LDS buffer + 10%BME) and boiling for 5 min at 100°C.
Nuclease digestion
20–50 mg of tumor powder was placed into a 2 ml Eppendorf tube (on dry ice) and resuspended by vortexing in 300 μl of Lysis Buffer (containing HALT Protease/Phosphatase inhibitor mix (EDTA free), 2 mM PMSF). After 30 min incubation, samples were sonicated for 1 min (50% cycle). Nuclease enzyme (25 units per tube) was added and incubated for 20 min at 25°C. After incubation, samples were loaded onto QiaShredder columns and centrifuged at 14000 x g for 15 min. Supernatant was collected, protein concentration measured and adjusted to 2 μg/ul. A sample buffer (4X LSD buffer, containing 5% BME) was added to the samples; the mix was incubated for 10 min at 70°C.
Immunoblotting
Protein samples were loaded onto Invitrogen pre-cast gels (4–12%), and gels were run at 150V for approximately 1.5 hours, or until the control _ladder had reached the bottom of the gel. Proteins were transferred to a nitrocellulose membrane using an iBlot transferring device. Membranes were blocked in 3% BSA (in TBST) for 1 hour at room temperature and incubated with primary anti-PARP antibody (Cell Signaling, rabbit, 1:1000) overnight at 4°C. Following an overnight incubation, membranes were washed with TBST (4 X 15min) and incubated with secondary HRP-conjugated antibody (Pierce, Goat Anti-Rabbit IgG, 1:6000) for 1 hour at room temperature. Following this incubation, the membranes were washed with TBST again (4 X 15 min). The ECL system (PerkinElmer, Western Lighting) was used for signal detection.
RNA Isolation
The isolation of RNA from xenografts (about 20–35 mg of tumor powder per sample) was performed using the Qiagen RNeasy Kit (catalog #74104). Total RNA was measured on a NanoDrop spectrophotometer and ~2 μg of total RNA in 20 μl volume were used for Reverse Transcriptase reaction using Omniscript kit (Qiagen, catalog #205111).
RT-PCR reaction
To set up RT-PCR, reaction volume from the reverse transcriptase step was diluted 10 times (200 μl) and 5 μl per reaction were taken for amplification. Samples were run in triplicate for each time point. A TaqMan Master Mix buffer (Life Technologies, catalog number#4304437) and human-specific assay primers (Applied Biosystems, GAPDH - Assay ID Hs02758991_g1; PARP1 - Assay ID Hs00242302_m1) were used. 20 μL real-time reactions were set up in triplicates. The assay was performed using 7900HT Fast Real-Time PCR System from Applied Biosystems. The results were analyzed using Microsoft Excel and Prism 6 software (GraphPad Software).
RESULTS
In vitro testing
The ability of talazoparib to potentiate the in vitro activity of temozolomide was evaluated by testing temozolomide from 0.3 μM to 1,000 μM in the presence or absence of 10 nM talazoparib. The median rIC50 value for temozolomide plus 10 nM talazoparib for the PPTP cell lines was 19.8 μM, with a range from 2.4 μM (NB-1643) to > 1,000 μM (Rh18) (Table I). By contrast, the median rIC50 value for single agent temozolomide was 374 μM. Three of 4 Ewing sarcoma cell lines had temozolomide rIC50 values < 10 μM in the present of talazoparib, as did 3 cell lines with low MGMT expression (Rh30, GBM2, and NB-1643). For the combination, the temozolomide median rIC50 for the Ewing sarcoma cell lines (7.5 μM) was lower than that for the remaining PPTP cell lines with MGMT expression (50.4 μM, p=0.02). The degree of potentiation of temozolomide toxicity by talazoparib varied by histotype, with talazoparib showing its greatest extent of potentiation for the Ewing sarcoma cell lines, with a median potentiation factor of 50-fold for the Ewing cell lines compared to 30-fold for the ALL cell lines and 8.9 for the non-Ewing, non-ALL cell lines. The Relative I/O% (Observed) values for temozolomide in the presence of 10 nM talazoparib approached −100% for most cell lines. Each of the Ewing sarcoma and ALL cell lines showed Relative I/O% values between −90% and −100%.
Table I.
In vitro testing of temozolomide plus talazoparib (10 nM)
| Cell Line | Histotype | TMZ1 rIC50 (μM) | TMZ rIC50 (mM) with talazoparib | Potentiation Factor2 | Ymin (Observed)3 | Relative In/Out4 (Observed Ymin) |
|---|---|---|---|---|---|---|
| RD | Rhabdomyosarcoma | 866.2 | 90.0 | 9.6 | 21.68 | 17% |
| Rh41 | Rhabdomyosarcoma | 276.1 | 114.4 | 2.4 | 4.29 | −81% |
| Rh18 | Rhabdomyosarcoma | >1000 | >1000 | 1.6 | 41.23 | −8% |
| Rh305 | Rhabdomyosarcoma | 3.4 | 5.1 | 0.7 | 2.38 | −86% |
| BT-12 | Rhabdoid | 812.3 | 100.5 | 8.1 | 12.73 | 5% |
| CHLA-266 | Rhabdoid | 382.8 | 74.4 | 5.1 | 7.07 | −73% |
| TC-71 | Ewing sarcoma | 385.8 | 8.9 | 43.4 | 0.04 | −97% |
| CHLA-9 | Ewing sarcoma | 215.3 | 3.8 | 56.5 | 0.06 | −98% |
| CHLA-10 | Ewing sarcoma | 374.2 | 6.1 | 61.1 | 0.40 | −94% |
| CHLA-258 | Ewing sarcoma | 354.2 | 55.4 | 6.4 | 2.76 | −93% |
| GBM25 | Glioblastoma | 359.8 | 4.2 | 85.3 | 0.72 | −93% |
| NB-16435 | Neuroblastoma | 4.7 | 2.4 | 2.0 | 1.79 | −92% |
| NB-EBc1 | Neuroblastoma | 258.4 | 15.0 | 17.3 | 0.37 | −98% |
| CHLA-90 | Neuroblastoma | 994.8 | 175.5 | 5.7 | 22.55 | −19% |
| CHLA-136 | Neuroblastoma | 275.0 | 28.3 | 9.7 | 9.67 | −66% |
| NALM-6 | ALL | 362.4 | 9.1 | 39.8 | 0.01 | −100% |
| COG-LL-317 | ALL | 207.1 | 152.5 | 1.4 | 0.02 | −100% |
| RS4;11 | ALL | 369.6 | 18.3 | 20.2 | 0.43 | −97% |
| MOLT-4 | ALL | 412.0 | 11.7 | 35.3 | 0.01 | −100% |
| CCRF-CEM | ALL | 590.0 | 19.8 | 29.8 | 0.09 | −99% |
| Kasumi-1 | AML | 462.1 | 72.6 | 6.4 | 1.37 | −95% |
| Karpas-299 | ALCL | 383.3 | 13.5 | 28.5 | 0.64 | −92% |
| Ramos-RA1 | NHL | 414.5 | 24.6 | 16.9 | 0.20 | −80% |
| Median | 374.2 | 19.8 | 9.7 | 0.72 | −93% | |
| Minimum | 3.4 | 2.4 | 0.7 | 0.01 | −100% | |
| Maximum | >1000 | >1000 | 85.3 | 41.23 | 17% |
TMZ, temozolomide
Ratio of temozolomide rIC50 in absence and presence talazoparib (10 nM).
Ymin (observed) for temozolomide in the presence of 10 nM talazoparib. See Materials and Methods for definition.
Relative In/Out% (observed Ymin) for temozolomide in the presence of 10 nM talazoparib. See Materials and Methods for definition.
MGMT negative cell lines.
The ability of talazoparib to potentiate the in vitro activity of topotecan was evaluated by testing topotecan from 0.03 nM to 100 nM in the presence or absence of 10 nM talazoparib. The median rIC50 value for topotecan with 10 nM talazoparib for the PPTP cell lines was 4.1 nM, with a range from 0.8 nM (CCG-LL-317) to 20.4 nM (Rh41) (Supplemental Table I), while the median rIC50 value for single agent topotecan was 10.8 nM. The median potentiation factor for talazoparib for topotecan was 2.8-fold, with a range from 0.6-fold to 4.3-fold and with no differences between histotypes (e.g., 2.2-fold potentiation for the Ewing cell lines). The Relative I/O% (Observed) values for topotecan in the presence of 10 nM talazoparib were similar to those for single agent topotecan (R2=0.93), which indicates that while talazoparib shifted the concentration response curve for topotecan to somewhat lower concentrations, it did not affect its ultimate extent of activity at higher concentrations.
In vivo testing
As the in vitro studies demonstrated significant potentiation for temozolomide, the in vivo studies focused only on this agent. Extensive toxicity testing in non-tumored SCID mice varying the dose of temozolomide (100 to 12 mg/kg) and talazoparib (0.25 to 0.05 mg/kg) showed that 30 mg/kg temozolomide (daily x 5) could be combined with talazoparib (0.1 mg/kg BID, designated Combination A) or temozolomide 12 mg/kg daily x 5 could be combined with 0.25 mg/kg (BID) talazoparib (Combination B). Both combinations exhibited similar toxicity (nadir of body weight loss was 12% for both combinations). Single agent talazoparib (0.25 mg/kg BID x 5) and temozolomide (30 mg/kg D x 5) as well as both combinations were evaluated in sarcoma models (Supplemental Table II), whereas combination B was also evaluated in other xenograft models (Supplemental Table III). Based on the hypothesis that talazoparib would be effective against Ewing xenografts by PARP trapping and that the role of temozolomide was to create single-strand breaks to serve as substrates for PARP trapping, the predicted outcome was that the low-dose temozolomide regimen (Combination B) would be as effective as the higher-dose temozolomide regimen (Combination A) that utilized temozolomide at a 2.5-fold higher dose.
In vitro results indicated that PARP inhibition potentiated temozolomide particularly in the Ewing sarcoma cell lines, in agreement with other studies (17, 18). To extend these data, we evaluated both combinations against 10 Ewing sarcoma xenograft models. Neither temozolomide (30 mg/kg D x 5) nor talazoparib (0.25 mg/kg BID x 5) had biologically significant activity administered as single agents. In contrast, both combinations demonstrated striking antitumor activity inducing complete tumor regression in 5 Ewing sarcoma lines, Figure 1A. We derived criteria for ‘highly sensitive’ as a median tumor response of maintained complete regression (MCR) at 6 weeks. Thus, TC-71, CHLA-258, SKNEP-1, ES-4 and ES-7 xenograft models are included in this classification. ES-3 would be designated intermediate sensitivity. In contrast, neither combination was particularly active against an additional four Ewing sarcoma xenograft models, Figure 1B. A summary of activity for both combinations and single agents is presented in Table II and Kaplan-Meier plots are presented as Supplemental Figure 1.
Figure 1.


A. Antitumor activity of temozolomide (30 mg/kg Dx5), talazoparib (0.25 mg/kg BID Dx5, or in combination against ‘sensitive’ Ewing sarcoma models. Combination A (temozolomide 30 mg/kg Dx5; talazoparib 0.1 mg/kg BID Dx5); Combination B (temozolomide 12 mg/kg Dx5; talazoparib 0.25 mg/kg BID Dx5). Graphs show growth of individual tumors in SCID mice. B. Antitumor activity of temozolomide (30 mg/kg Dx5), talazoparib (0.25 mg/kg BID Dx5, or in combination against ‘insensitive’ Ewing sarcoma models. Combination A (temozolomide 30 mg/kg Dx5; talazoparib 0.1 mg/kg BID Dx5); Combination B (temozolomide 12 mg/kg Dx5; talazoparib 0.25 mg/kg BID Dx5). Graphs show growth of individual tumors in SCID mice.
Table II.
Activity summary for single agents and combinations.
| Line | Tumor Type | Treatment Group | Median Time to Event (days) | P-value1 | EFS T/C2 | Median RTV End of Study3 | CR at 6 Weeks4 | Group Response5 |
|---|---|---|---|---|---|---|---|---|
| KT-10 | Wilms | TMZ6 | 21.8 | 0.084 | 1.2 | >4 | No | SD |
| KT-10 | Wilms | Talazoparib | > EP7 | <0.001 | > 5.2 | >4 | Yes | CR |
| KT-10 | Wilms | Combination A8 | > EP | <0.001 | > 5.2 | 0.0 | Yes | MCR |
| KT-10 | Wilms | Combination B9 | > EP | <0.001 | > 5.2 | 0.0 | Yes | MCR |
| SK-NEP-1 | Ewing | TMZ | 8.9 | 0.389 | 0.8 | >4 | No | PD1 |
| SK-NEP-1 | Ewing | Talazoparib | 10.1 | 0.916 | 1.0 | >4 | No | PD1 |
| SK-NEP-1 | Ewing | Combination A | 32.3 | <0.001 | 3.1 | >4 | No | PR |
| SK-NEP-1 | Ewing | Combination B | > EP | <0.001 | > 8.6 | 0.0 | Yes | MCR |
| TC-71 | Ewing | TMZ | 10.7 | 0.368 | 1.0 | >4 | No | PD1 |
| TC-71 | Ewing | Talazoparib | 12.2 | 0.016 | 1.2 | >4 | No | PD1 |
| TC-71 | Ewing | Combination A | > EP | <0.001 | > 8.8 | 0.0 | Yes | MCR |
| TC-71 | Ewing | Combination B | > EP | <0.001 | > 8.8 | 0.0 | Yes | MCR |
| CHLA258 | Ewing | TMZ | 10.2 | 0.242 | 1.1 | >4 | No | PD1 |
| CHLA258 | Ewing | Talazoparib | 11.8 | 0.034 | 1.2 | >4 | No | PD1 |
| CHLA258 | Ewing | Combination A | > EP | <0.001 | > 9.6 | 0.0 | Yes | MCR |
| CHLA258 | Ewing | Combination B | > EP | <0.001 | > 9.6 | >4 | Yes | CR |
| ES6 | Ewing | TMZ | 25.1 | 0.039 | 1.3 | >4 | No | PD1 |
| ES6 | Ewing | Talazoparib | 20.6 | 0.845 | 1.1 | >4 | No | PD1 |
| ES6 | Ewing | Combination A | 35.9 | <0.001 | 1.9 | >4 | No | PD2 |
| ES6 | Ewing | Combination B | 31.6 | <0.001 | 1.7 | >4 | No | PD2 |
| ES4 | Ewing | TMZ | 15.8 | 0.001 | 1.4 | >4 | No | PD1 |
| ES4 | Ewing | Talazoparib | 14.3 | 0.032 | 1.3 | >4 | No | PD1 |
| ES4 | Ewing | Combination A | 81.5 | <0.001 | 7.1 | >4 | Yes | CR |
| ES4 | Ewing | Combination B | 77.4 | <0.001 | 6.8 | >4 | Yes | CR |
| EW5 | Ewing | TMZ | 9.9 | 0.507 | 1.1 | >4 | No | PD1 |
| EW5 | Ewing | Talazoparib | 8.9 | 0.941 | 1.0 | >4 | No | PD1 |
| EW5 | Ewing | Combination A | 28.6 | <0.001 | 3.3 | >4 | No | PR |
| EW5 | Ewing | Combination B | 24.0 | <0.001 | 2.7 | >4 | No | CR |
| ES-2 | Ewing | TMZ | 12.7 | 0.567 | 1.1 | >4 | No | PD1 |
| ES-2 | Ewing | Talazoparib | 14.0 | 0.712 | 1.2 | >4 | No | PD1 |
| ES-2 | Ewing | Combination A | 19.2 | 0.002 | 1.6 | >4 | No | PD2 |
| ES-2 | Ewing | Combination B | 30.3 | <0.001 | 2.6 | >4 | No | CR |
| EW8 | Ewing | TMZ | 9.1 | 0.005 | 1.3 | >4 | No | PD1 |
| EW8 | Ewing | Talazoparib | 13.4 | <0.001 | 2.0 | >4 | No | PD2 |
| EW8 | Ewing | Combination A | 15.7 | <0.001 | 2.3 | >4 | No | PD2 |
| EW8 | Ewing | Combination B | 12.6 | <0.001 | 1.9 | >4 | No | PD2 |
| ES-3 | Ewing | TMZ | 10.3 | 0.007 | 1.2 | >4 | No | PD1 |
| ES-3 | Ewing | Talazoparib | 10.7 | 0.011 | 1.2 | >4 | No | PD1 |
| ES-3 | Ewing | Combination A | 26.0 | <0.001 | 2.9 | >4 | No | CR |
| ES-3 | Ewing | Combination B | 18.3 | <0.001 | 2.1 | >4 | No | CR |
| ES-7 | Ewing | TMZ | 18.3 | 0.003 | 1.6 | >4 | No | PD2 |
| ES-7 | Ewing | Talazoparib | 15.7 | 0.021 | 1.4 | >4 | No | PD1 |
| ES-7 | Ewing | Combination A | > EP | <0.001 | > 7.8 | 0.0 | Yes | MCR |
| ES-7 | Ewing | Combination B | > EP | <0.001 | > 7.8 | 0.0 | Yes | MCR |
| ES-8 | Ewing | TMZ | 7.1 | 0.110 | 1.2 | >4 | No | PD1 |
| ES-8 | Ewing | Talazoparib | 10.7 | <0.001 | 1.9 | >4 | No | PD2 |
| ES-8 | Ewing | Combination A | 38.7 | <0.001 | 6.7 | >4 | No | CR |
| ES-8 | Ewing | Combination B | 33.4 | <0.001 | 5.8 | >4 | No | CR |
| Rh28* | Alveolar RMS | TMZ | > EP | <0.001 | > 3.0 | 0.0 | Yes | MCR |
| Rh28* | Alveolar RMS | Talazoparib | 13.7 | 0.003 | 0.5 | >4 | No | PD1 |
| Rh28* | Alveolar RMS | Combination A | > EP | <0.001 | > 3.0 | 0.0 | Yes | MCR |
| Rh28* | Alveolar RMS | Combination B | > EP | <0.001 | > 3.0 | 0.0 | Yes | MCR |
| Rh30 | Alveolar RMS | TMZ | 16.8 | 0.799 | 1.1 | >4 | No | PD1 |
| Rh30 | Alveolar RMS | Talazoparib | 15.0 | 0.624 | 1.0 | >4 | No | PD1 |
| Rh30 | Alveolar RMS | Combination A | 50.0 | <0.001 | 3.2 | >4 | No | CR |
| Rh30 | Alveolar RMS | Combination B | 37.3 | <0.001 | 2.4 | >4 | No | SD |
| Rh41 | Alveolar RMS | TMZ | 11.8 | 0.176 | 0.9 | >4 | No | PD1 |
| Rh41 | Alveolar RMS | Talazoparib | 11.1 | 0.090 | 0.9 | >4 | No | PD1 |
| Rh41 | Alveolar RMS | Combination A | 11.3 | 0.072 | 0.9 | >4 | No | PD1 |
| Rh41 | Alveolar RMS | Combination B | 13.9 | 0.061 | 1.1 | >4 | No | PD1 |
| GBM2* | Glioblastoma | TMZ | 35.3 | <0.001 | 5.4 | >4 | No | CR |
| GBM2* | Glioblastoma | Talazoparib | 8.0 | 0.295 | 1.2 | >4 | No | PD1 |
| GBM2* | Glioblastoma | Combination A | 83.2 | <0.001 | 12.8 | >4 | Yes | CR |
| GBM2* | Glioblastoma | Combination B | > EP | <0.001 | >14.0 | 0.0 | Yes | MCR |
P-value comparing EFS distribution of treated and control groups.
EFS T/C: ratio of event-free survival (median time to event) for treated and control groups
RTV: ratio of median relative tumor volume at end of observation period for treated to control groups
Complete response at 6 weeks
See Materials and Methods section for definitons of Progessive Disease 1 (PD1), Progressive Disease 2 (PD2), Stable Disease (SD), Partial Response (PR), Complete Response (CR), and Maintained Complete Response (MCR)
TMZ, temozolomide
EP, median time to event for treatment group extended beyond the observation period
Combination A (temozolomide 30 mg/kg Dx5; talazoparib 0.125 mg/kg BID Dx5)
Combination B (temozolomide 12 mg/kg Dx5; talazoparib 0.25 mg/kg BID Dx5)
Low MGMT-expressing xenograft lines.
Among the five highly sensitive models, activity for the two combination regimens was comparable for three models, while Combination A was superior against CHLA-258 (P=0.033) whereas Combination B was superior against SK-NEP-1 (P <0.001). Among the five remaining Ewing xenografts, Combination A was statistically superior to Combination B (P <0.001) against ES-3 and Combination B was superior to Combination A (P=0.019) against ES-2, although in each case both combinations produced transient regressions with regrowth within 6 weeks of treatment. Hence, Combination B using a low dose of temozolomide showed comparable activity to Combination A against Ewing xenografts.
Both combinations and single agents were evaluated against a select group of non-Ewing xenografts, including: models deficient in MGMT (GBM2 glioblastoma, Rh28 rhabdomyosarcoma) andhence known to be sensitive to single agent temozolomide (31); a Wilms tumor xenograft (KT-10) shown previously to respond to single-agent talazoparib (25); and two additional alveolar rhabdomyosarcoma models (Rh30 and Rh41), Figure 2. As anticipated, both GBM2 and Rh28 xenografts regressed completely following temozolomide treatment. For GBM2 all tumors had recurred at 7 weeks post temozolomide treatment, whereas only 4 of 10 Rh28 xenografts recurred during the 12 week period for observation.
Figure 2.

Antitumor activity of temozolomide (30 mg/kg Dx5), talazoparib (0.25 mg/kg BID Dx5), or in combination against xenograft models sensitive to temozolomide (GBM2, Rh28, MGMT-deficient), or single agent talazoparib (KT-10), and two additional alveolar rhabdomyosarcoma xenografts (Rh30, Rh41). Combination A (temozolomide 30 mg/kg Dx5; talazoparib 0.1 mg/kg BID Dx5); Combination B (temozolomide 12 mg/kg Dx5; talazoparib 0.25 mg/kg BID Dx5). Graphs show growth of individual tumors in SCID mice.
Both combinations delayed recurrence of GBM2 tumors through the 12 week observation period, and reduced the incidence of recurrent growth in Rh28 tumors at 12 weeks. The combinations demonstrated some activity against Rh30 xenografts causing transient tumor regressions with Combination A being superior (P<0.001), but neither combination had activity against Rh41 xenografts.
Therapeutic enhancement was considered present when the tumor growth delay for a combination was greater than the tumor growth delay for both of the single agents and when the EFS distribution for the combination treatment was significantly better (p<0.01) than the EFS distributions for both of the single agents (32). Both combinations demonstrated therapeutic enhancement over the predicted additive effect based upon the single agent activity in 12 of 16 models for which single agent and combination activity was determined, Supplemental Table IV. The models not showing therapeutic enhancement were KT-10 (in which talazoparib is highly effective as a single agent), Rh28 (in which temozolomide is highly effective as a single agent), and EW8 and ES6 (in which both the single agents and the combinations show minimal activity).
As Combination B showed activity that was comparable to Combination A and as it reflects the preferred treatment strategy for clinical evaluation because of its low alkylating agent dose, it was further evaluated against 19 additional models including glioblastoma, neuroblastoma, osteosarcoma and ALL xenografts that have been characterized for sensitivity to temozolomide (31) and talazoparib (25). Results are summarized in Supplemental Table V (and Supplemental Table II). Excessive toxicity was observed for 7 of 8 ALL xenografts that were evaluated using NOD-SCID mice as hosts. The only evaluable ALL xenograft did not show an objective response, and the inevaluable ALL xenografts showed little evidence of response to the combination, although conclusions are limited due to the excessive toxicity. Similarly, 2 of 3 glioblastoma xenografts showed excessive toxicity using BALB/c nu/nu mice as hosts. Among the remaining 10 evaluable solid tumor xenografts (1 glioblastoma, 5 neuroblastoma, and 4 osteosarcoma), all showed significant differences in EFS distribution for treated versus control groups. However, only two models showed objective responses, each of which has low MGMT expression (CHLA-79 and D645).
Pharmacodynamic studies
Previously we reported the sensitivity of two xenografts to talazoparib administered as a single agent (KT-10, Wilms tumor and BT-45 medulloblastoma) (25). We therefore first examined PARP levels in these tumors with or without talazoparib treatment. Tumor bearing mice received talazoparib (0.25 mg/kg BID) for nine doses and tumors were harvested 4 and 24 hours after the last dose. PARP and γH2AX were examined in control (untreated) and treated tumors. As shown in Figure 3A, treatment with talazoparib caused a marked loss of detectable PARP in both tumor models. To determine whether treatment-induced loss of PARP was associated with decreased PARP we examined tumors that were highly sensitive to combination treatment (TC-71, CHLA258) and tumors intrinsically resistant to the combination (EW5, EW-8). Neither talazoparib nor temozolomide as single agents induced decreases in PARP in TC-71 tumors after 5 days of treatment (Figure 3B). In contrast, combination of talazoparib with temozolomide at either 12 or 6 mg/kg caused an almost complete loss of detectable PARP at 4 and 24 hours post day 5 dosing. As PARP trapping onto DNA has been proposed as a mechanism of action, it was possible that the PARP-DNA complex may not have entered into the gel. We therefore attempted to recover PARP by DNase treatment or heat treatment of tumor samples prior to electrophoresis. However, neither process resulted in detectable PARP in drug-treated tumor samples (Figure 3C). Results for CHLA-258 xenografts showed increased levels of γH2AX were detected within 6 hours of a single dose of temozolomide combined with talazoparib, although cleaved PARP was not detected (Figure 3D). Six hours post day 3 treatment, γH2AX and cleaved PARP were markedly increased compared to tumors from mice treated with temozolomide or talazoparib as single agents, Figure 3E. As with TC-71 samples, there was no detectable PARP in CHLA-258 xenografts either 4 or 24 hours post day 5 dosing with the combination, whereas it was readily detected in control, or tumors treated with single agents (Figure 3F).
Figure 3.
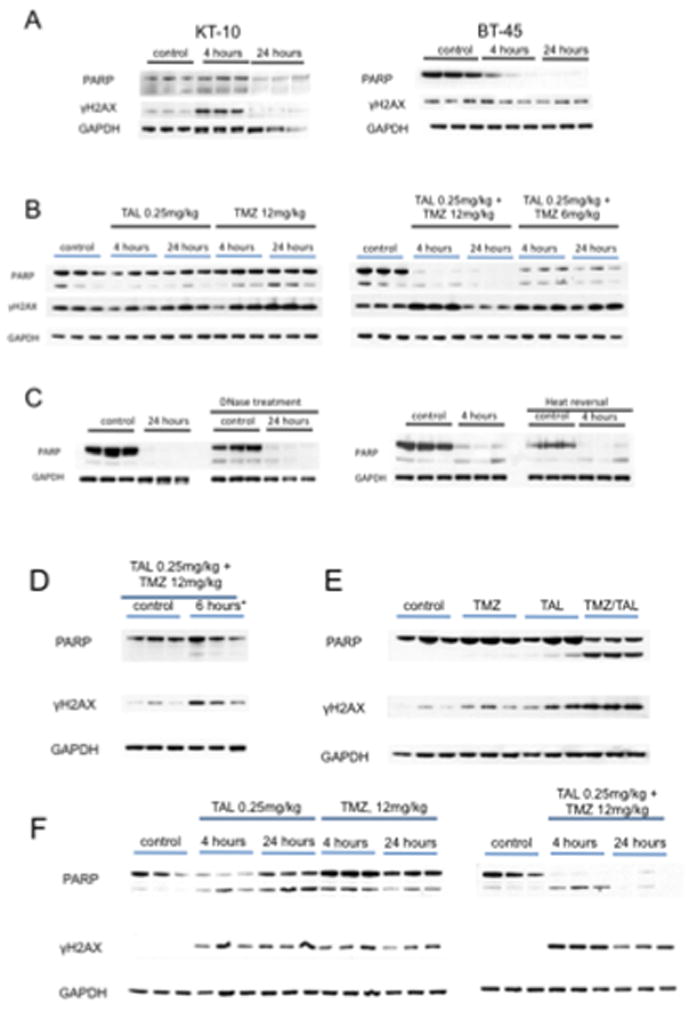
Loss of PARP is associated with increased sensitivity to talazoparib (TAL) or temozolomide (TMZ)/talazoparib combinations in vivo. A. KT-10 and BT-45 xenograft tissues were harvested 4 hr and 24 hr after the ninth dose of talazoparib (TAL 0.25 mg/kg administered BID) and processed as described in Materials and Methods. B. TC-71 xenografts were harvested 6 hr post day 5 dosing with temozolomide (12 mg/kg/d), talazoparib (0.25 mg/kg BID, 9 doses) or the combination. Immunoblots were probed for PARP, cleaved PARP, γH2AX, and GAPDH (loading control). C. Tumor lysates from B (TAL 0.25 mg/kg + TMZ 12 mg/kg) were treated with DNase or heat to recover any PARP bound to DNA. D, Pharmacodynamic changes in CHLA-258 xenografts. Levels of PARP and γH2AX 6 hr post dose 1 for temozolomide (12 mg/kg) and talazoparib (TAL 0.25 mg/kg); E, Levels of PARP and γH2AX 6 hr post dose 3 for temozolomide (12 mg/kg) and dose 7 for talazoparib (0.25 mg/kg); F, Levels of PARP and γH2AX 4 hr and 24 hr post dose 5 for temozolomide (12 mg/kg) and dose 11 for talazoparib (0.25 mg/kg). GAPDH was used as a loading control (n=3).
In contrast to the loss of PARP in tumors responsive to talazoparib or to the temozolomide- talazoparib combination, there was no consistent decrease in PARP following single agent or combination treatment in EW-8 or EW-5 xenografts that are intrinsically resistant to each treatment, Figures 4A and B, respectively. The basal levels of PARP are shown for all xenografts. Although these varied amongst the tumor models, there was no obvious relationship between levels of PARP and responsiveness to combination therapy, Figure 4C.
Figure 4.

Pharmacodynamic changes induced by talazoparib and temozolomide in nonresponsive xenograft lines EW-8 and EW-5. A. EW-8; B. EW-5. xenograft tissues (n=3) were harvested after 5 days temozolomide (12 mg/kg/d), talazoparib (0.25 mg/kg BID, 9 doses) or the combination and processed as described in Materials and Methods. Immunoblots were probed for PARP, cleaved PARP, γH2AX, and GAPDH (loading control). C., PARP levels in control tumors (n=3); D Talazoparib alone or the combination of temozolomide and talazoparib decreases PARP transcripts in sensitive xenograft models. PARP transcripts (normalized to GAPDH transcripts) were determined by QRT-PCR in control tumors, and tumors harvested 6 hr post dosing on day 5 treatment with temozolomide (12 mg/kg) and talazoparib (0.25 mg/kg) E. Development of TC-71 xenografts resistant to Combination B. Resistance was developed as described in Materials and Methods. The response of individual naïve parental TC-71 tumors (designated Pass R0), Pass R1 (the second drug treatment), pass R3 and pass R5 are shown. The relative tumor volume plots (right) show the growth of the median tumor for each group (gray, Control; black treated). Note in Pass 0, 10 tumor bearing mice were treated and the median tumor volume at 6 weeks was < 0.1 CM3. For other groups 5 tumor bearing mice were in the treatment groups. F. Western blot for PARP, cleaved PARP and γH2AX for TC-71 parental xenografts (untreated), control (untreated) TC-71R and treated TC-71R xenografts.
Analysis of mRNA levels using human-specific primers for PARP also demonstrated a significant decrease in transcripts in tumors sensitive to either talazoparib alone or the temozolomide- talazoparib combination, whereas no decrease was detected in tumors that were non-responsive (Figure 4D). Marked reductions in PARP transcripts were observed for each of the 3 Ewing sarcoma xenografts that are highly responsive to the temozolomide- talazoparib combination.
Development of TC-71 xenografts resistant to Combination B
As shown in Figure 4E, emergence of resistance to the combination of talazoparib and temozolomide was relatively rapid. The first tumor to recur following treatment of naïve TC-71 xenografts (designated Pass R0) was re-transplanted and mice challenged when tumors were 100–200 mm3 (passage R1). Although all tumors regressed after treatment, the median time to recur was 2.5 weeks. The process was repeated with the first tumor to regrow being further transplanted. By passage R3 there was only one CR and by passage R5 all tumors progressed (PD2). Pharmacodynamic studies showed that treatment induced some cleavage of PARP, but no decrease in total PARP/cleaved PARP in TC-71R (Pass R7) (Figure 4F) or PARP transcripts (Figure 4D) when compared to controls (quantified data presented in Supplemental Figure 2). Further, there was no apparent increase in γH2AX signal above the control (untreated) TC-71R xenografts.
DISCUSSION
Reports describing preferential sensitivity of Ewing sarcoma to PARP inhibition created hope that this class of agents would be effective against Ewing sarcoma. However, the initial attempt at clinical translation was unsuccessful, as objective responses were not observed for patients with Ewing sarcoma receiving olaparib (33). Additionally, our single agent results with talazoparib showed no single agent in vivo activity against Ewing sarcoma xenografts despite in vitro sensitivity of Ewing cell lines to talazoparib at low nanomolar concentrations (25). Our results with the talazoparib plus temozolomide combination provide an alternative way forward for clinical success for PARP inhibition against Ewing sarcoma. The striking level of activity for the talazoparib plus temozolomide combination is a remarkable example of synergy, with neither agent used alone showing significant activity but with the combination using a low dose of temozolomide (≤20% of the standard in vivo dose) for 5 days showing complete responses that were maintained for more than 6 weeks for 5 of 10 Ewing xenografts.
In interpreting our combination testing results, a key point is that the effects of the combination appear to be unrelated to the mechanism by which temozolomide is active as a single agent. Rather, the activity can be explained by an unmasking of temozolomide-induced lesions that are normally nontoxic. Temozolomide single agent cytotoxicity results from futile cycles of mismatch repair with removal and reinsertion of thymine opposite O6-methyl guanine (O6-meG) eventually resulting in an apoptosis-inducing double strand DNA break at the next cycle of DNA replication (34–36). All of the Ewing cell lines and xenografts tested are known to be MGMT expressers and/or to show resistance to temozolomide at concentrations at which MGMT low-expressing lines are responsive, ruling out O6-meG lesions as primary contributors to cytotoxicity. Ninety percent of temozolomide-induced methyl adducts are at N7-guanine or N3-adenine, and it is these lesions that appear to drive the cytotoxicity of the combination of PARP inhibitors with temozolomide (3, 20, 22). These adducts are repaired by the BER pathway, creating the DNA single-strand breaks with 5’dRP ends to which PARP binds (2, 3). In the presence of a potent PARP inhibitor with PARP-trapping capacity like talazoparib, these single-strand breaks become cytotoxic lesions. Thus, the talazoparib plus temozolomide should not be considered as a combination in which the activity of temozolomide is being potentiated. Rather, it should be considered as a new treatment strategy in which cytotoxicity can be initiated by non-O6-meG methyl adducts that promote PARP trapping.
We designed our in vivo testing to assess the relative importance of temozolomide and talazoparib in the combination. If temozolomide were acting by its traditional mechanism, then the combination regimen with the higher dose of temozolomide (30 mg/kg/day) should be much more effective than the regimen using a 2.5-fold lower dose (12 mg/kg/day). Our finding of comparable activity for the combination using a very low-dose of temozolomide compared to the combination using the higher dose of temozolomide supports a secondary role for temozolomide, and it is consistent with the hypothesis that the PARP inhibitor is the cytotoxic component of the combination. The strategy of using a low dose of temozolomide is attractive for clinical translation, as the lower dose of temozolomide reduces the mutagenic burden associated with temozolomide treatment.
The finding of remarkable activity for the talazoparib plus temozolomide combination against Ewing sarcoma has potential clinical implications, while the additional finding that approximately one-half of Ewing xenografts show limited responses to the combination provides the important caveat that resistance mechanisms will exist de novo or develop during treatment. An important line of future research will be to identify factors that relate to sensitivity versus resistance to the combination. While we cannot identify factors that predict response, we can identify several factors that do not appear to be related to sensitivity, including TP53 mutations (present in some sensitive and some resistant tumors) and MGMT expression (present in both sensitive and resistant tumors).
Among non-Ewing cell lines and xenografts, those with low MGMT expression appear to be responsive to the talazoparib plus temozolomide combination, both in vitro and in vivo. In vitro, temozolomide as a single agent requires multiple cell divisions in order for cytotoxicity to occur, and hence the effect observed at 96 hours is only a partial effect (as evidenced by Relative I/O% values > 0%) when concentrations below 300 μM are considered (37). GBM2, for example, shows limited response to single agent temozolomide at concentrations below 300 μM, while the presence of talazoparib shifts the rIC50 by 85-fold with Relative I/O% values approaching −100% (indicative of a complete cytotoxic response at 96 hours). In vivo, 4 of 5 xenograft lines with low MGMT expression showed complete responses to low-dose temozolomide plus talazoparib that were maintained for at least 6 weeks. This suggests that O6-meG adducts that are not rapidly removed by MGMT can initiate a robust cytotoxic response in the presence of talazoparib.
Among the non-Ewing xenografts, the other responder to low-dose temozolomide plus talazoparib was the Wilms tumor xenograft KT-10, which is also responsive to single agent talazoparib. The initial single agent testing of talazoparib used a daily x 28 schedule at 0.33 mg/kg/day (administered twice daily Monday to Friday and once daily Saturday-Sunday), and KT-10 showed a MCR at 6 weeks to talazoparib on this dose/schedule. KT-10 also showed a CR response at 6 weeks to 0.25 mg/kg administered BID for 5 days. The combination of low-dose temozolomide plus talazoparib was more effective than single agent talazoparib, with most animals receiving the single agent showing regrowth by day 84 and none of those receiving the combination showing regrowth. KT-10 has defective homologous recombination as a result of biallelic inactivation of PALB2 (25), suggesting that the therapeutic strategy of low-dose temozolomide plus talazoparib may warrant evaluation in patient populations with defects in homologous recombination repair.
Pharmacodynamic studies were undertaken following dosing with single agents or the combination. Both KT-10 and BT-45 xenografts were sensitive to single agent PARP inhibitor. After 5 days of treatment with talazoparib PARP levels were not detected at 4 hours (KT-10) or 24 hours (both tumor lines) post day 5 dosing. There was a robust increase in γH2AX 4 hours post dosing in KT-10 tumors, but was not detected at 24 hours, whereas γH2AX was detected at both time points in BT-45 xenografts. For Ewing sarcoma xenografts, PARP was detected at all time points for tumors treated with temozolomide or talazoparib as single agents, but it was decreased markedly only in responsive xenografts treated with the drug combination and not in combination-resistant xenografts. Attempts to recover PARP that was potentially bound to DNA and hence not able to enter into the SDS-PAGE gel during electrophoresis, by heat denaturation or DNase treatment of tumor lysates, failed to recover the enzyme. Hence, the decreased detection was probably not a consequence of PARP-DNA binding. Consistent with the loss of PARP by day 5 of dosing with the drug combination, there was a decrease in PARP transcripts determined using human-specific PCR in tumors sensitive to talazoparib alone or the drug combination, but not in tumors resistant to combination therapy. Whether the loss of PARP transcripts and protein merely reflects loss of tumor cells through apoptosis is unclear, as GAPDH and γH2AX were detected. The loss of PARP transcripts is consistent with a model in which EWS-FLI1 regulation of PARP transcription is dependent upon the interaction with PARP binding at the PARP promoter (18), and that EWS-FLI1 gene fusions in ESFTs depend on the activity of PARP1, and is also consistent with reports that ETS transcription factors drive PARP1 expression in ESFTs (38, 39). However, in our study, PARP loss was only seen in the context of temozolomide treatment in Ewing sarcoma models, or in tumor models responsive to talazoparib as a single agent.
In vivo we developed a line of the TC-71 xenograft resistant to Combination B by transplanting the first tumor to regrow after therapy. In the second passage, tumors completely regressed, but started to regrow with 2–4 weeks. Subsequent transplants showed progressively less response to therapy. Evaluation of PARP and γH2AX for transplant 7R showed that there was little increase in therapy-induced γH2AX, and although treatment induced some PARP cleavage, there was no loss of PARP, as occurred in parental TC-71 xenografts and other xenografts sensitive to either the combination treatment or talazoparib as a single agent.
A concern with agents that potentiate the toxicity of DNA damaging/interactive agents is that the potentiation will be equally observed for cancer cells and for normal tissues. Experience to date with potentiating agents has highlighted this risk, as exemplified by experience with MGMT inhibitors (e.g., O6-benzylguanine and lomeguatrib) (40–42). For both O6-benzylguanine and lomeguatrib, their addition to alkylating agents (e.g., nitrosoureas and temozolomide) leads to increased toxicity requiring dose reductions, such that the combination is no more effective than the chemotherapy agent given alone at its single agent dose. As discussed above, this concern is not applicable to the combination of talazoparib with low-dose temozolomide, since the combination is acting by a different mechanism than single agent temozolomide. However, the concern does apply to the combination of talazoparib with topoisomerase I poisons. The 2- to 3-fold level of potentiation of topotecan activity by talazoparib that we observed is similar to that reported for other topoisomerase I poisons and PARP inhibitors (3, 5). To the extent that the best predictor of a therapeutic window resulting from in vitro testing is profound sensitivity for a subset of cell lines in the setting of relative resistance for most cell lines (e.g., as illustrated by the highly selective and genomically related activity of BRAF, ALK, and EGFR inhibitors when tested against large cell line panels) (43), the lack of differential sensitivity shown by topotecan against the PPTP cell lines is concerning. The lack of PARP trapping ability for topoisomerase I poisons may explain the absence of differential activity for talazoparib plus topotecan when such marked variability is observed for the talazoparib plus temozolomide combination (5).
In conclusion, the combination of talazoparib plus temozolomide is remarkably effective against several subsets of pediatric preclinical models, including those for Ewing sarcoma, those with low MGMT expression, and those with single agent responsiveness to talazoparib. The observation that talazoparib is equally effective when used in a low-dose temozolomide compared to a high-dose temozolomide regimen is consistent with the emerging understanding of the role of PARP trapping for selected PARP inhibitors such as talazoparib. Translation of the PPTP findings to the clinic requires breaking from the traditional paradigm for combining potentiating agents with standard chemotherapy agents in which priority is given to maintaining the standard agents at or near the their conventional doses. For the talazoparib combination, clinical translation requires administering an effective PARP trapping dose of talazoparib and then titrating in temozolomide to the extent tolerated without dose-limiting toxicities. A phase 1 trial of talazoparib plus temozolomide for children and adolescents with refractory solid tumors building upon this strategy has been initiated (NCT02116777).
Supplementary Material
TRANSLATIONAL STATEMENT.
Advanced or metastatic childhood cancers present a therapeutic challenge. While intensive chemotherapy forms the backbone of current curative therapy for several childhood cancers, new approaches to increase efficacy are required. Here we have evaluated the combination of a Poly-ADP-ribose Polymerase (PARP) inhibitor, talazoparib, with temozolomide. The results suggest that low dose temozolomide combined with talazoparib may have synergistic activity, particularly aginst Ewing sarcoma.
Acknowledgments
This work was supported by NO1-CM-42216, CA21765, and CA108786 from the National Cancer Institute and used talazoparib supplied by BioMarin Pharmaceutical Inc, San Rafael, CA. In addition to the authors this paper represents work contributed by the following: Sherry Ansher, Ingrid Boehm, Matthew Tsang, Kathryn Evans, Edward Favours, Henry S. Friedman, Danuta Gasinski, Martin RosKoski. Melissa Sammons, Joe Zeidner, Jianrong Wu, Ellen Zhang, and Jian Zhang. Children’s Cancer Institute Australia for Medical Research is affiliated with the University of New South Wales and the Sydney Children’s Hospitals Network.
Footnotes
Conflict of interest statement: The authors consider that there are no actual or perceived conflicts of interest.
References
- 1.Gibson BA, Kraus WL. New insights into the molecular and cellular functions of poly(ADP-ribose) and PARPs. Nature reviews Molecular cell biology. 2012;13:411–24. doi: 10.1038/nrm3376. [DOI] [PubMed] [Google Scholar]
- 2.Cistulli C, Lavrik OI, Prasad R, Hou E, Wilson SH. AP endonuclease and poly(ADP-ribose) polymerase-1 interact with the same base excision repair intermediate. DNA repair. 2004;3:581–91. doi: 10.1016/j.dnarep.2003.09.012. [DOI] [PubMed] [Google Scholar]
- 3.Horton JK, Wilson SH. Predicting Enhanced Cell Killing through PARP Inhibition. Mol Cancer Res. 2013;11:13–8. doi: 10.1158/1541-7786.MCR-12-0512. [DOI] [PMC free article] [PubMed] [Google Scholar]
- 4.De Vos M, Schreiber V, Dantzer F. The diverse roles and clinical relevance of PARPs in DNA damage repair: current state of the art. Biochem Pharmacol. 2012;84:137–46. doi: 10.1016/j.bcp.2012.03.018. [DOI] [PubMed] [Google Scholar]
- 5.Das BB, Huang SY, Murai J, Rehman I, Ame JC, Sengupta S, et al. PARP1-TDP1 coupling for the repair of topoisomerase I-induced DNA damage. Nucleic acids research. 2014 doi: 10.1093/nar/gku088. [DOI] [PMC free article] [PubMed] [Google Scholar]
- 6.Plummer R, Jones C, Middleton M, Wilson R, Evans J, Olsen A, et al. Phase I study of the poly(ADP-ribose) polymerase inhibitor, AG014699, in combination with temozolomide in patients with advanced solid tumors. Clin Cancer Res. 2008;14:7917–23. doi: 10.1158/1078-0432.CCR-08-1223. [DOI] [PMC free article] [PubMed] [Google Scholar]
- 7.Plummer R, Lorigan P, Steven N, Scott L, Middleton MR, Wilson RH, et al. A phase II study of the potent PARP inhibitor, Rucaparib (PF-01367338, AG014699), with temozolomide in patients with metastatic melanoma demonstrating evidence of chemopotentiation. Cancer chemotherapy and pharmacology. 2013;71:1191–9. doi: 10.1007/s00280-013-2113-1. [DOI] [PubMed] [Google Scholar]
- 8.Su JM, Thompson PA, Adesina A, Li XN, Kilburn LB, Onar-Thomas A, et al. A phase I clinical trial of veliparib and temozolomide in children with recurrent central nervous system tumors: A Pediatric Brain Tumor Consortium report. J Clin Oncol. 2013;31(suppl):abstr 2036. [Google Scholar]
- 9.Kummar S, Chen A, Ji J, Zhang Y, Reid JM, Ames M, et al. Phase I study of PARP inhibitor ABT-888 in combination with topotecan in adults with refractory solid tumors and lymphomas. Cancer research. 2011;71:5626–34. doi: 10.1158/0008-5472.CAN-11-1227. [DOI] [PMC free article] [PubMed] [Google Scholar]
- 10.Khan OA, Gore M, Lorigan P, Stone J, Greystoke A, Burke W, et al. A phase I study of the safety and tolerability of olaparib (AZD2281, KU0059436) and dacarbazine in patients with advanced solid tumours. British journal of cancer. 2011;104:750–5. doi: 10.1038/bjc.2011.8. [DOI] [PMC free article] [PubMed] [Google Scholar]
- 11.Middleton M, Friedberg EC, Hamid O, Daud A, Plummer R, Schuster R, et al. Veliparib (ABT-888) plus temozolomide versus temozolomide alone: efficacy and safety in patients with metastatic melanoma in a randomized double-blind placebo-controlled trial 24:1022–1023. Pigment Cell Melanoma Res. 2011;24:1022–3. [Google Scholar]
- 12.Bryant HE, Schultz N, Thomas HD, Parker KM, Flower D, Lopez E, et al. Specific killing of BRCA2-deficient tumours with inhibitors of poly(ADP-ribose) polymerase. Nature. 2005;434:913–7. doi: 10.1038/nature03443. [DOI] [PubMed] [Google Scholar]
- 13.Farmer H, McCabe N, Lord CJ, Tutt AN, Johnson DA, Richardson TB, et al. Targeting the DNA repair defect in BRCA mutant cells as a therapeutic strategy. Nature. 2005;434:917–21. doi: 10.1038/nature03445. [DOI] [PubMed] [Google Scholar]
- 14.Kaufman B, Shapira-Frommer R, Schmutzler RK, Audeh MW, Friedlander M, Balmana J, et al. Olaparib Monotherapy in Patients With Advanced Cancer and a Germline BRCA1/2 Mutation. J Clin Oncol. 2014 doi: 10.1200/JCO.2014.56.2728. [DOI] [PMC free article] [PubMed] [Google Scholar]
- 15.Sandhu SK, Schelman WR, Wilding G, Moreno V, Baird RD, Miranda S, et al. The poly(ADP-ribose) polymerase inhibitor niraparib (MK4827) in BRCA mutation carriers and patients with sporadic cancer: a phase 1 dose-escalation trial. Lancet Oncol. 2013;14:882–92. doi: 10.1016/S1470-2045(13)70240-7. [DOI] [PubMed] [Google Scholar]
- 16.De Bono JS, Mina LA, Gonzalez M, Curtin NJ, Wang E, Henshaw JW, et al. First-in-human trial of novel oral PARP inhibitor BMN 673 in patients with solid tumors. J Clin Oncol. 2013;31(suppl):abstr 2580. [Google Scholar]
- 17.Garnett MJ, Edelman EJ, Heidorn SJ, Greenman CD, Dastur A, Lau KW, et al. Systematic identification of genomic markers of drug sensitivity in cancer cells. Nature. 2012;483:570–5. doi: 10.1038/nature11005. [DOI] [PMC free article] [PubMed] [Google Scholar]
- 18.Brenner JC, Feng FY, Han S, Patel S, Goyal SV, Bou-Maroun LM, et al. PARP-1 inhibition as a targeted strategy to treat Ewing's sarcoma. Cancer research. 2012;72:1608–13. doi: 10.1158/0008-5472.CAN-11-3648. [DOI] [PMC free article] [PubMed] [Google Scholar]
- 19.Plummer R. Perspective on the pipeline of drugs being developed with modulation of DNA damage as a target. Clin Cancer Res. 2010;16:4527–31. doi: 10.1158/1078-0432.CCR-10-0984. [DOI] [PubMed] [Google Scholar]
- 20.Murai J, Huang SY, Das BB, Renaud A, Zhang Y, Doroshow JH, et al. Trapping of PARP1 and PARP2 by Clinical PARP Inhibitors. Cancer research. 2012;72:5588–99. doi: 10.1158/0008-5472.CAN-12-2753. [DOI] [PMC free article] [PubMed] [Google Scholar]
- 21.Kedar PS, Stefanick DF, Horton JK, Wilson SH. Increased PARP-1 association with DNA in alkylation damaged, PARP-inhibited mouse fibroblasts. Mol Cancer Res. 2012;10:360–8. doi: 10.1158/1541-7786.MCR-11-0477. [DOI] [PMC free article] [PubMed] [Google Scholar]
- 22.Murai J, Huang SY, Renaud A, Zhang Y, Ji J, Takeda S, et al. Stereospecific PARP Trapping by BMN 673 and Comparison with Olaparib and Rucaparib. Molecular cancer therapeutics. 2014;13:433–43. doi: 10.1158/1535-7163.MCT-13-0803. [DOI] [PMC free article] [PubMed] [Google Scholar]
- 23.Murai J, Zhang Y, Morris J, Ji J, Takeda S, Doroshow JH, et al. Rationale for PARP inhibitors in combination therapy with camptothecins or temozolomide based on PARP trapping versus catalytic inhibition. J Pharmacol Exp Ther. 2014 doi: 10.1124/jpet.113.210146. [DOI] [PMC free article] [PubMed] [Google Scholar]
- 24.Shen Y, Rehman FL, Feng Y, Boshuizen J, Bajrami I, Elliott R, et al. BMN 673, a novel and highly potent PARP1/2 inhibitor for the treatment of human cancers with DNA repair deficiency. Clin Cancer Res. 2013;19:5003–15. doi: 10.1158/1078-0432.CCR-13-1391. [DOI] [PMC free article] [PubMed] [Google Scholar]
- 25.Smith MA, Hampton OA, Reynolds CP, Kang MH, Maris JM, Gorlick R, et al. Initial testing (stage 1) of the PARP inhibitor BMN 673 by the Pediatric Preclinical Testing Program: PALB2 mutation predicts exceptional in vivo response to BMN 673. Pediatr Blood Cancer. 2015;62:91–8. doi: 10.1002/pbc.25201. [DOI] [PMC free article] [PubMed] [Google Scholar]
- 26.Frgala T, Kalous O, Proffitt RT, Reynolds CP. A fluorescence microplate cytotoxicity assay with a 4-log dynamic range that identifies synergistic drug combinations. Mol Cancer Ther. 2007;6:886–97. doi: 10.1158/1535-7163.MCT-04-0331. [DOI] [PubMed] [Google Scholar]
- 27.Kang MH, Smith MA, Morton CL, Keshelava N, Houghton PJ, Reynolds CP. National Cancer Institute Pediatric Preclinical Testing Program: Model description for in vitro cytotoxicity testing. Pediatr Blood Cancer. 2011;56:239–49. doi: 10.1002/pbc.22801. [DOI] [PMC free article] [PubMed] [Google Scholar]
- 28.Sebaugh JL. Guidelines for accurate EC50/IC50 estimation. Pharmaceut Statist. 2010 doi: 10.1002/pst.426. [DOI] [PubMed] [Google Scholar]
- 29.Houghton PJ, Morton CL, Tucker C, Payne D, Favours E, Cole C, et al. The pediatric preclinical testing program: Description of models and early testing results. Pediatr Blood Cancer. 2006 doi: 10.1002/pbc.21078. [DOI] [PubMed] [Google Scholar]
- 30.Liem NL, Papa RA, Milross CG, Schmid MA, Tajbakhsh M, Choi S, et al. Characterization of childhood acute lymphoblastic leukemia xenograft models for the preclinical evaluation of new therapies. Blood. 2004;103:3905–14. doi: 10.1182/blood-2003-08-2911. [DOI] [PubMed] [Google Scholar]
- 31.Keir ST, Maris JM, Reynolds CP, Kang MH, Kolb EA, Gorlick R, et al. Initial testing (stage 1) of temozolomide by the pediatric preclinical testing program. Pediatr Blood Cancer. 2013;60:783–90. doi: 10.1002/pbc.24368. [DOI] [PMC free article] [PubMed] [Google Scholar]
- 32.Houghton PJ, Morton CL, Gorlick R, Lock RB, Carol H, Reynolds CP, et al. Stage 2 combination testing of rapamycin with cytotoxic agents by the Pediatric Preclinical Testing Program. Molecular cancer therapeutics. 2010;9:101–12. doi: 10.1158/1535-7163.MCT-09-0952. [DOI] [PMC free article] [PubMed] [Google Scholar]
- 33.Choy E, Butrynski JE, Harmon DC, Morgan JA, George S, Wagner AJ, et al. Phase II study of olaparib in patients with refractory Ewing sarcoma following failure of standard chemotherapy. BMC Cancer. 2014;14:813. doi: 10.1186/1471-2407-14-813. [DOI] [PMC free article] [PubMed] [Google Scholar]
- 34.D'Atri S, Tentori L, Lacal PM, Graziani G, Pagani E, Benincasa E, et al. Involvement of the mismatch repair system in temozolomide-induced apoptosis. Molecular pharmacology. 1998;54:334–41. doi: 10.1124/mol.54.2.334. [DOI] [PubMed] [Google Scholar]
- 35.Quiros S, Roos WP, Kaina B. Processing of O6-methylguanine into DNA double-strand breaks requires two rounds of replication whereas apoptosis is also induced in subsequent cell cycles. Cell cycle (Georgetown, Tex. 2010;9:168–78. doi: 10.4161/cc.9.1.10363. [DOI] [PubMed] [Google Scholar]
- 36.Roos WP, Batista LF, Naumann SC, Wick W, Weller M, Menck CF, et al. Apoptosis in malignant glioma cells triggered by the temozolomide-induced DNA lesion O6-methylguanine. Oncogene. 2007;26:186–97. doi: 10.1038/sj.onc.1209785. [DOI] [PubMed] [Google Scholar]
- 37.Keir ST, Maris JM, Reynolds CP, Kang MH, Kolb EA, Gorlick R, et al. Initial testing (stage 1) of temozolomide by the Pediatric Preclinical Testing Program. Pediatr Blood Cancer. 2013;60:783–90. doi: 10.1002/pbc.24368. [DOI] [PMC free article] [PubMed] [Google Scholar]
- 38.Newman RE, Soldatenkov VA, Dritschilo A, Notario V. Poly(ADP-ribose) polymerase turnover alterations do not contribute to PARP overexpression in Ewing's sarcoma cells. Oncology reports. 2002;9:529–32. [PubMed] [Google Scholar]
- 39.Soldatenkov VA, Albor A, Patel BK, Dreszer R, Dritschilo A, Notario V. Regulation of the human poly(ADP-ribose) polymerase promoter by the ETS transcription factor. Oncogene. 1999;18:3954–62. doi: 10.1038/sj.onc.1202778. [DOI] [PubMed] [Google Scholar]
- 40.Blumenthal DT, Rankin CJ, Stelzer K, Schulman S, Sloan A, Rushing EJ, et al. SWOG S0001: A phase III study of radiation therapy (RT) and O6-benzylguanine (O6-BG) plus BCNU versus RT and BCNU alone for newly diagnosed glioblastoma multiforme (GBM) and gliosarcoma. Neuro-Oncology. 2006;8:438. doi: 10.1007/s10147-014-0769-0. (Abstr TA-04) [DOI] [PMC free article] [PubMed] [Google Scholar]
- 41.Ranson M, Hersey P, Thompson D, Beith J, McArthur GA, Haydon A, et al. Randomized trial of the combination of lomeguatrib and temozolomide compared with temozolomide alone in chemotherapy naive patients with metastatic cutaneous melanoma. J Clin Oncol. 2007;25:2540–5. doi: 10.1200/JCO.2007.10.8217. [DOI] [PubMed] [Google Scholar]
- 42.Khan OA, Ranson M, Michael M, Olver I, Levitt NC, Mortimer P, et al. A phase II trial of lomeguatrib and temozolomide in metastatic colorectal cancer. British journal of cancer. 2008;98:1614–8. doi: 10.1038/sj.bjc.6604366. [DOI] [PMC free article] [PubMed] [Google Scholar]
- 43.Barretina J, Caponigro G, Stransky N, Venkatesan K, Margolin AA, Kim S, et al. The Cancer Cell Line Encyclopedia enables predictive modelling of anticancer drug sensitivity. Nature. 2012;483:603–7. doi: 10.1038/nature11003. [DOI] [PMC free article] [PubMed] [Google Scholar]
Associated Data
This section collects any data citations, data availability statements, or supplementary materials included in this article.