

Abstract
A key feature of early visual cortical regions is that they contain discretely organized retinotopic maps. Titration of these maps must occur through experience, and the fidelity of their spatial tuning will depend on the consistency and accuracy of the eye movement system. Anomalies in fixation patterns and the ballistics of eye movements are well documented in autism spectrum disorder (ASD), with off-center fixations a hallmark of the phenotype. We hypothesized that these atypicalities might affect the development of visuo-spatial maps and specifically that peripheral inputs might receive altered processing in ASD. Using high-density recordings of visual evoked potentials (VEPs) and a novel system-identification approach known as VESPA (visual evoked spread spectrum analysis), we assessed sensory responses to centrally and peripherally presented stimuli. Additionally, input luminance was varied to bias responsiveness to the magnocellular system, given previous suggestions of magnocellular-specific deficits in ASD. Participants were 22 ASD children (7–17 years of age) and 31 age- and performance-IQ-matched neuro-typical controls. Both VEP and VESPA responses to central presentations were indistinguishable between groups. In contrast, peripheral presentations resulted in significantly greater early VEP and VESPA amplitudes in the ASD cohort. We found no evidence that anomalous enhancement was restricted to magnocellular-biased responses. The extent of peripheral response enhancement was related to the severity of stereotyped behaviors and restricted interests, cardinal symptoms of ASD. The current results point to differential visuo-spatial cortical mapping in ASD, shedding light on the consequences of peculiarities in gaze and stereotyped visual behaviors often reported by clinicians working with this population.
Keywords: autism spectrum disorder (ASD), EEG, magnocellular, VESPA, visual evoked potential (VEP)
Introduction
Atypicalities in how individuals with an autism spectrum disorder (ASD) direct their gaze to socially relevant stimuli such as faces and eyes have long been noted (Klin et al., 2002; Pelphrey et al., 2002; Hernandez et al., 2009; Kliemann et al., 2010). It has been suggested that this arises because ASD individuals tend to fixate on different kinds of information, such as the mouth or other inanimate objects in the scene, rather than the eyes (Klin et al., 2002). However, altered fixation behavior has also been observed using entirely non-social materials (Joseph et al., 2009), suggesting a more general difference in visuo-motor processing in ASD. In the few published examples of eye-traces in ASD participants, fixations are often only slightly away from targeted regions of interest (Pelphrey et al., 2002; Rice et al., 2012). Higher variability of saccadic amplitude has also been observed within (Takarae et al., 2004) and between autistic participants (Goldberg et al., 2002; Takarae et al., 2004; Stanley-Cary et al., 2011). Collectively, these studies suggest that the precision of eye movements is less reliable in ASD.
Much of the early visual cortical hierarchy is organized into a series of precise retinotopically mapped regions. A key aspect of these maps is that they display the so-called cortical magnification factor, which describes the fact that the region of visual space that we foveate on has considerably more cortex devoted to its processing than have more peripheral regions (Daniel & Whitteridge, 1961; Tootell et al., 1982). This non-uniformity of cortical representation is very dramatic indeed, such that in the squirrel monkey, a 1° stimulus presented at fixation would activate approximately 42 mm2 of primary visual cortex (V1), whereas the same stimulus presented at 6° eccentricity would activate only about 1.5 mm2 (Adams & Horton, 2003), a near 30-fold difference in representation. The implications for macroscopic recordings of visual activity at the scalp surface are clear. Presentation of a stimulus at fixation will result in activation of a very large patch of early visual cortex relative to when it is presented at more peripheral locations, which is clearly borne out as a sharp amplitude decrease in the visual evoked potential (VEP) under such circumstances (Schlykowa et al., 1993; Jedynak & Skrandies, 1998). Early visuo-spatial maps are developmentally driven, as is abundantly evident in patients with amblyopia, where functional imaging has shown that V1 receptive fields are shifted to represent more parafoveal locations for the strabismic eye (Conner et al., 2007). Even in neurotypical adults, rapid changes in the mapping of perceptual space can be induced by experimentally altering the relationship between eye movements and visual stimulation (Awater et al., 2005). It seems a reasonable proposition then that the titration of cortical space representation in early visual regions develops during infancy and early childhood and that this development is strongly influenced by the fidelity of the eye-gaze system. If the development of visuo-spatial cortical maps has been affected by a lifetime of relatively imprecise and poorly calibrated eye-fixations, a straightforward prediction is that one would expect a broader spatial tuning function for these early cortical maps. That is, parafoveal and peri-foveal regions would probably be over-represented as these regions of the retina would be more often trained on the intended environmental object of interest and, in turn, the representation of the fovea should be partially reduced. We have derived a simple ‘Altered Cortical Magnification Model’, using the observed values from the work of Adams and Horton to illustrate the potential impact of such remapping on the cortical representations for inputs at various eccentricities (see Fig. 1). This simple model makes some clear predictions. Spatial representation around the fovea would be expected to lead to only marginal changes in the absolute extent of cortex responding to central stimulation (given the truly enormous tract of V1 dedicated to the central region) whereas the relative changes in representation outside of the parafoveal region would be expected to substantially increase the extent of cortex responding to presentations at this eccentricity (given the initially very sparse representations at such eccentricities).
Fig. 1.

(A) model of cortical magnification as a function of eccentricity defined by the exponential function: M = 392 (2.26 + ecc)−2.74 (see Adams & Horton, 2003). The red line in A provides an estimate for the cortical magnification in typically developing children. The function for ASD participants was modeled using the assumption that the absolute area of visual cortex is the same as in TD, but their tuning function is not as sharp (the exponent is reduced by 12%). This results in a reduction of cortical area at central locations compared with TD participants, but a marked increase at peripheral locations around 5°. The black rectangle along the horizontal axis represents the location and size of the central stimulus, while the dark grey rectangle represents the peripheral stimulus. The table in (B) provides estimates for the proportion of cortical area stimulated by the stimuli in ASD participants for different reductions of the exponent. For a 12% reduction in exponent this model predicts the inner stimulus is processed by about 6% less cortical area in ASD, while the peripheral stimulus stimulates 23% more area.
Very few studies have examined how altered eye movements and resultant fixation patterns might influence cortical processing of visual information in ASD (Dalton et al., 2005). Given the close link between eye movements and visual cortical representations, as well as the observed deficits in oculomotor control in autism, we hypothesized that individuals with autism would exhibit alterations in the early cortical representations of peripheral visual space. To test this, VEPs as well as visually evoked spread spectrum response potentials (VESPA) (Lalor et al., 2006, 2009; Frey et al., 2010) were obtained for stimuli presented either at the center of gaze or at a parafoveal location. Because there is an ongoing debate on whether impaired magnocellular processing contributes to visual processing differences in ASD (Spencer et al., 2000; Milne et al., 2002; Robertson et al., 2012) and the proportion of magnocellular cells increases with increasing retinal eccentricity (Connolly & Van Essen, 1984) we also employed stimuli specifically biased towards activation of magnocellular neurons (Butler et al., 2007; Foxe et al., 2008; Lalor & Foxe, 2009). In visual cortex, magnocellular neurons feed predominantly into the dorsal stream, known as the ‘where’ pathway for its role in movement processing and object localization (Mishkin & Ungerleider, 1982). The combination of stimuli biased towards different visual pathways and different stimulus eccentricities was expected to yield a sensitive measure of visual cortical representation in ASD.
Methods
Participants
Twenty-two children with a diagnosis of ASD (one female) between 7 and 17 years of age (mean = 11.3; SD = 2.7) and 31 typically developing (TD) children (11 female) between 6 and 18 years of age (mean = 12.3; SD = 3.0) participated in this study. Two TD children were removed from further analysis due to excessive EEG artifacts, bringing the total number of TD participants to 29. The age distributions of the two experimental groups were not statistically different [t49 = 1.32, P > 0.51; Kolmogorov–Smirnov (KS) test].
Typically developing children were excluded if they exhibited symptoms of attention deficit-hyperactivity disorder, had a history of academic or psychiatric difficulties, or were on psychiatric medications, as reported by parents. Children with autism were excluded if they had a history of seizures. For both groups, only children whose non-verbal cognitive functioning was close to or above the average range, as assessed by the Wechsler Abbreviated Scale of Intelligence (WASI) (Wechsler, 1999; WASI > 80 or higher on the performance IQ scale) were included in this study. Diagnosis of an ASD was confirmed by a research reliable clinician using the Autism Diagnostic Observation Scale (ADOS-G; Lord et al., 2000), the Autism Diagnostic Interview (ADI-R; Le Couteur et al., 1989) and clinical judgment. Only children who met ADOS and ADI criteria were included in the ASD group. Of the 22 children on the autism spectrum, eight had a diagnosis of autism, 11 had a diagnosis of Asperger’s syndrome and three had a diagnosis of pervasive developmental disorder-not otherwise specified (DSM IV; American Psychiatric Association, 2000). Overall, the non-verbal cognitive abilities of the TD children (mean = 105.5; SD = 9.6) and those with ASD (mean = 104.4; SD = 8.4) did not differ (t48 = 0.29, P > 0.77).
Before entering into the study, informed written consent was obtained from each child’s parent, and verbal or written assent was obtained from each child. All procedures were approved by the Institutional Review Boards of the City College of the City University of New York as well as the Albert Einstein College of Medicine and conformed to the tenets of the Declaration of Helsinki.
Stimuli and procedure
A checkerboard pattern subtending 6.4° of visual angle (vertically and horizontally) and with equal numbers of light and dark checks was used throughout this study. Each individual check subtended 0.8° of visual angle, resulting in a spatial frequency of about 0.625 cycles per degree. Participants were seated in an electromagnetically shielded EEG recording chamber at 70 cm distance from a 21-inch CRT monitor (NEC MultiSync FE2111) with a refresh rate of 60 Hz and a resolution of 1024 by 768 pixels. The maximum luminance of the monitor was set to 117 cd/m2 and background luminance was 57 cd/m2. The participants rested their heads on a comfortable chin-rest, which ensured proper viewing distance.
Each participant underwent three runs for each stimulus condition (Full-Range VESPA, Magno VESPA and VEP) with presentation of stimuli in the center of the screen as well as 6.2° to the right. All runs were of 120 s duration. To reduce the amount of task-switching, we presented all runs at a given eccentricity consecutively. For each participant it was randomly assigned at which eccentricity the stimuli were presented first. The order of conditions was randomized as well. To obtain VEPs, the full-contrast checkerboard was inverted every second. For the VESPA, the contrast of the checkerboard pattern was modulated on every screen refresh by a non-binary stochastic signal, which had its power distributed uniformly between 0 and 30 Hz (Lalor et al., 2006; Lalor & Foxe, 2009). In the Full-Range condition, the contrast of the checkerboard modulated between 0 and 100%, while in the Magno condition, contrast modulation was limited to between 0 and 10%, a manipulation that biases activation to this cellular division of the visual system. That is, the two major cell systems of the visual system, the so-called magnocellular and parvocellular divisions, differ functionally in terms of their ‘preferred’ stimuli. Parvocellular cells, with their spectrally opponent nature, are known to be less sensitive to luminance contrast than magnocellular cells (Kaplan & Shapley, 1986; Lee et al., 1990). They exhibit considerably lower contrast gain and a generally linear response function across all levels of contrast, a function that does not saturate, even at the highest contrast levels. The magnocellular system, by contrast, shows a wholly different response function, with an initially very steep contrast gain function that saturates quickly between 10 and 15% contrast (Baseler & Sutter, 1997). Thus, when contrast changes from mid- to high levels (i.e. from a high pedestal baseline) only parvocellular cells would be expected to show sensitivity, whereas fluctuations of contrast below 10% are expected to substantially bias responsiveness to the magnocellular division.
Visual evoked potential and VESPA are complementary methods for obtaining a cortical impulse response. A major advantage of the VESPA method is that it does not depend on the repetitive presentation of discrete stimuli. As such, the stimulus remains constantly present, much as real objects do in the environment. This has the advantage that information is gathered with every change in feature (on every monitor refresh). Therefore, a relatively short amount of time is needed to obtain reliable evoked responses, which is especially valuable when testing the magnocellular system. In addition, the VESPA method does not capture exogenous attention to the same amount as the VEP method. For a detailed description of these advantages see Lalor et al. (2006), Frey et al. (2010) and Murphy et al. (2012). One disadvantage of the VESPA method is that it only captures linear aspects of the cortical response. The firing rate of neurons in early visual cortices increases in a sigmoidal fashion with increasing contrast (Reich et al., 2001). Therefore, a fraction of the early response will not be accounted for by the VESPA. This is not the case for the VEP method, and as such, combined use of the two techniques provides us with a comprehensive assay of visual processing.
A different modulating waveform was used for each run of the VESPA, although all waveforms had identical statistics. Due to the lower stimulus power in Magno stimuli and the reduced amplitude of response in the periphery, participants underwent an additional three runs for the Magno VESPA in the periphery, whenever possible. The average number of Magno VESPA runs in the periphery was 4.48 for TD and 4.41 for ASD.
Control task
The participants were instructed to maintain fixation on the center of the screen for the duration of each run. To increase the likelihood that participants fixated on the center of the screen and to decrease boredom, they completed the following tasks. For the centrally presented stimuli, the task was to detect the occurrence of an ‘X’ of mean luminance in the center of the screen. For peripherally presented stimuli, participants had to detect a subtle luminance change in a fixation cross presented in the center of the screen (this cross was not present for the centrally presented stimuli). The inter-stimulus interval for the targets was set to random values between 6 and 24 s.
Data acquisition
Seventy-channel scalp EEG was recorded, amplified and digitized at 512 Hz using Biosemi ActiveTwo amplifiers, with a low-pass filter at 103 Hz. The acquisition of the data occurs relative to an active two-electrode reference, which drives the average potential of the participant as close as possible to the analog to digital (AD) conversion reference voltage of the AD box (for a description of the Biosemi active electrode system referencing and grounding conventions, see www.biosemi.com/faq/cms&drl.htm).
Eye movements were recorded using an EyeLink 1000 system in head-free mode. In this setting, the eye-tracker corrects for small head movements and remains very accurate even with changing head position. Eye position was recorded at 500 Hz, synchronized with the EEG recording using triggers every second. Every five blocks, or more frequently if necessary, the eye-tracker was calibrated using a nine-point grid.
Data analysis
The recorded EEG data were filtered between 0.8 and 50 Hz using 6th order Chebyshev filters with zero phase-shift. These filters have the advantage of very high attenuation in the stop band with minimal attenuation in the pass-band (< 0.1 dB). Bad channels were determined using statistics of neighboring channels and interpolated using linear, distance-weighted interpolation. The EEG data were then referenced to the average. The raw eye-tracking data were filtered using a 4th order Butterworth low-pass filter with 15 Hz cut-off. Due to calibration error, the eye-tracker may represent the participant’s horizontal gaze position up to 1° to the left or right of the intended position. This ‘misrepresentation’ will be consistent for all blocks during a calibration period. We therefore used the following method to determine the coordinate for fixation: if within one set of five blocks with the same calibration the difference between median eye position in the different blocks was less than 1°, we used the median x- and y-values across all blocks as the fixation coordinate. In the vast majority of cases where there was a small deviation between the recorded and theoretical value, the eye-tracker represented the eye position to the left of the fixation spot. Due to technical problems, there was incomplete or missing eye-tracking data for two ASD and five TD participants. For these participants the HEOG and VEOG EEG channels were used to determine periods of stable gaze. During recording, experimenters detected deviations from correct gaze position in the on-line display and documented poor gaze behavior. As there were no negative comments in the records of these children, we included them in the analysis.
Both EEG and eye-tracking data were used for artifact detection. For the EEG data we used an individual threshold level, due to the high variance in scalp voltages across different participants that resulted from the large spread of ages. The threshold was set at eight times the standard deviation of the EEG data in one block, restricted between 120 and 220 μV. Because the focus of the analyses was on early visual processing, a parieto-occipital region of interest was defined by channels Iz, Oz, O1, O2, POz, PO3, PO4, PO7 and PO8. For the event-related potential analysis, all trials were removed, in which the eyes moved more than 2° towards or 2.5° away from the peripheral stimulus within the first 500 ms after stimulus reversal or any occipito-parietal channel exceeded the artifact threshold. If any other channel outside the occipito-parietal region of interest exceeded the threshold, this channel was interpolated using linear, distance-weighted interpolation for the given trial. This approach eliminates the influence of bad trials on source localization. To obtain the VEP the EEG data were aligned to all the stimulus reversals in the remaining trials and averaged.
Data cleaning for the VESPA analysis was performed on sections of 1 s. If the participants’ eyes moved more than 2° towards or 2.5° away from the peripheral stimulus or any occipito-parietal channel exceeded the threshold, the section was declared bad. Within the section, bad channels outside the occipito-parietal region of interest were treated equivalently to the event-related potential analysis. The VESPA, i.e. the impulse response functions using the known monitor luminance signals and the measured EEG signal for each channel using linear least-squares estimation, was determined in segments of at least four consecutive artifact-free sections. As in previous studies, this was done using a 500-ms sliding window (Lalor et al., 2006). Note that the meaning of this time interval is slightly different from the time intervals over which VEPs are typically plotted. Unlike the VEP, the VESPA time interval is not determined with relation to a specific discrete event occurring at time 0. Instead, each time point on the time axis can be interpreted as being the relative time between the continuous EEG and the continuous input intensity signal Therefore, the VESPA at + 100 ms indexes how the contrast signal at any time point affects the EEG 100 ms later. The VESPAs from all segments for a given participant and condition were then averaged.
For each participant and condition, two electrodes were chosen for statistical analysis by determining the channels where the maximum amplitude of the P1 component was evident in the topography. This approach was chosen because there was considerable variation in the topographic distribution of peak activity between participants, especially for laterally presented stimuli (Fig. 2). A participant was included in the grand mean, if the signal-to-noise ratio (SNR) of the evoked response was > 3.5. This SNR value allowed us to balance clean evoked responses with the exclusion of as few participants as possible. The restriction to use only participants whose VEP or VESPA met the SNR criterion reduced the number of participants (Table 1). There were no significant differences between groups in any measure (all P > 0.39).
Fig. 2.
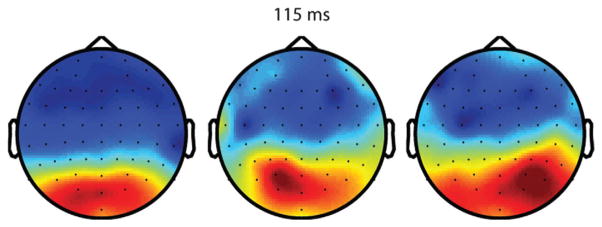
Examples of VEP topographies around the individual peak in the P1 timeframe (115 ms) for three different TD participants.
Table 1.
Characteristics of participants included for different experimental conditions; for age and performance IQ (PIQ) the values in parentheses represent the standard deviation
| Condition | TD | ASD |
|---|---|---|
| VEP central |
n: 29 (100%) Age (years): 12.3 (3.0) PIQ: 105.5 (9.6) |
n: 22 (100%) Age (years): 11.3 (2.7) PIQ: 104.4 (18.4) |
| VEP peripheral |
n: 24 (83%) Age (years):12.1 (2.7) PIQ: 106.2 (9.9) |
n: 19 (86%) Age (years): 11.3 (2.8) PIQ: 103.7 (18.5) |
| Full VESPA central |
n: 29 (100%) Age (years): 12.3(3.0) PIQ: 105.5 (9.6) |
n: 22 (100%) Age (years): 11.3 (2.7) PIQ: 104.4 (18.4) |
| Full VESPA peripheral |
n: 25 (86%) Age (years): 12.2 (3.2) PIQ: 105 (8.4) |
n: 17 (77%) Age (years): 10.8 (2.9) PIQ: 106.5 (18.3) |
| Magno VESPA central |
n: 27 (93%) Age (years): 12.2 (3.0) PIQ: 106.0 (9.8) |
n: 21 (95%) Age (years): 11.3 (2.8) PIQ: 103.8 (18.7) |
| Magno VESPA peripheral |
n: 20 (69%) Age (years): 11.3 (2.7) PIQ: 105.7 (9.0) |
n: 16 (73%) Age (years): 11.2 (2.7) PIQ: 101.3 (20.1) |
Source localization
The multiple signal classification (MUSIC) technique as implemented in ASA 4.7.3 (A.N.T., Enschede, Netherlands) was used for source localization. This inverse solution method estimates multiple dipoles in a discrete search space. The signal space is divided into source and noise subspace using principal component analysis and dipoles are found by minimizing the projection into the noise subspace (cost function). The obtained results were confirmed using the standardized low-resolution brain electromagnetic tomography (sLORETA; Pascual-Marqui, 2002) technique implemented in ASA 4.7.3.
Control task analysis
For the VEP stimuli, reaction time and behavioral performance were determined using the recorded response triggers. A correct response was registered if it occurred within 0.17–1.5 s after a target. Due to technical problems we could not recover these response triggers for seven participants in each group. The behavioral performance for the remaining participants was determined by dividing the number of hits by the sum of hits, misses and false alarms.
For the VESPA stimuli it was not possible to obtain accurate performance measures, as triggers for stimulus information and participants’ responses sometimes occurred at the same time, which discarded the response trigger. This occurred in about 30% of all responses for all participants. However, we were still able to obtain reaction times for the remaining 70% of the targets.
Fixational eye movements
In addition to employing eye-tracking to control for maintenance of fixation, we examined small fixational eye movements and micro-saccades during presentation of stimuli. Recent work suggests that these miniature eye movements underlie important perceptual functions (Martinez-Conde et al., 2006). If participants with an ASD exhibit problems in eye movement control, then it is possible that not only saccades but also fixational eye movements would be affected. Rate, amplitude and orientation of microsaccades during fixation were determined using a publicly available Matlab toolbox (Engbert & Kliegl, 2003). In addition, we determined the standard deviation of eye-gaze along the horizontal and vertical axes for valid fixation trials. This measure complements the microsaccade analysis regarding slower movements of the eye, which do not reach the velocity threshold of the microsaccade analysis.
Statistical analysis
Based on findings in previous VEP studies on visual processing in ASD, we mainly focus our analysis on the timeframe of the P1 component (e.g. Boeschoten et al., 2007; Sutherland & Crewther, 2010). The amplitudes of VEP and VESPA P1 components were examined using an independent sample t-test. As response latencies increase with decreasing stimulus contrast (Reich et al., 2001), we expected delayed responses to Magno VESPA stimuli. Therefore, we did not define one P1 timeframe for all experimental conditions but used a 20-ms window centered on the individual peak amplitude in the time range 130–170 ms for Magno VESPA peripheral and 90–130 ms for all other conditions.
In addition to planned comparisons, we ran post hoc statistical tests for detecting additional differences (for other VEP/ VESPA components such as C1, N1). For the first 300 ms of the evoked responses, running two-tailed t-tests between the experimental groups were applied. A time range of the response was termed significantly different if at least nine consecutive time points were different with P < 0.05, based on the autocorrelation of the signals of interest (Guthrie & Buchwald, 1991).
Evoked responses were further examined by using relative amplitudes. To do so, the amplitude of the peripheral response in the P1 timeframe was divided by the one for central stimulation. Such a transformation removed any influence of the variability in individual response amplitudes and served as an index for peripheral visual processing. Relative peripheral P1 amplitudes as well as measures of behavioral performance, reaction time and eye movements were examined using mixed linear models (SPSS 21.0, IBM Corp., Armonk, NY) using experimental group, age (rounded to integer), stimulus type and laterality (where applicable) as factors. Main effects and two-way interactions between factors were computed.
Relation of evoked responses to clinical measures
The ADOS contains the category ‘Stereotyped Behaviors and Restricted Interests’ (SBRI), where the examiner codes unusual sensory interests including visual examination of non-functional elements of the test setting such as looking out of the corner of the eye. We therefore examined the relation between these ADOS scores and the relative P1 response to peripheral visual stimulation using the ‘robustfit’ regression function (Matlab 7.5).
As most visual behaviors are coded in the first two sections (‘Unusual Sensory Interest in Play Material/Person’ and ‘Hand and Finger and Other Complex Mannerisms’) of the SBRI category, we examined these more closely. The algorithm scores in these sections are integer values between 0 and 2, which makes it difficult to use regression methods. We therefore divided ASD participants into groups with high and low relative amplitudes and compared their codes in these sections using the non-parametric Wilcoxon rank-sum test.
Results
VEPs
For stimuli presented at the center of gaze, both the VEP and VESPA electrophysiological responses were highly similar between groups, and amplitudes of early visual processing components (C1, P1, and N1) did not differ (Fig. 3, left column). No statistically significant differences in either amplitude or latencies (all P > 0.22) were detected, indicating that visual processing of simple stimuli at central locations, as assessed by our method, was intact in ASD children.
Fig. 3.

Visual evoked potentials and VESPA for all conditions of stimuli presented centrally (left column) and in the periphery (right column). Dark green bars indicate significant differences between groups for our a priori defined timeframes during C1 and P1. Light green bars indicate significant differences between groups for a post hoc running t-test. Note the different scaling on the vertical axis.
However, for stimuli presented in the periphery, we found clear differences between ASD and TD groups (Fig. 3, right column). During the P1 timeframe, the planned comparison t-tests revealed a significant difference for the VEP and Full-Range VESPA in the periphery, with ASD children exhibiting larger amplitudes (t41 = 2.38, P = 0.022 and t40 = 2.27, P = 0.029, respectively). The difference in the planned comparison P1 timeframe for the peripheral Magno VESPA was not significant (t34 = 0.5, P = 0.62). However, post hoc running t-tests revealed that in the timeframe from 155 to 180 ms the amplitude of the ASD group’s response was significantly larger than for the TD group. The latency of the P1 peak was significantly later in ASD (median latency 155 compared with 134 ms). However, this did not indicate a delayed onset, but rather a temporal extension of the P1 component (Fig. 3F). Taken together, these results provided evidence for processing differences between TD and ASD participants for peripheral stimulation during the P1 timeframe.
The post hoc test also revealed additional differences for peripheral conditions. We found a significantly more negative Full-Range VES-PA amplitude from 145 to 180 ms, during the N1 component time-frame (Fig. 3B), and a significantly more negative VEP amplitude in the time range from 210 to 255 ms (Fig. 3D) in the ASD group.
Note that even though responses to visual stimuli are generally found to have shorter latencies in the magnocellular pathway, the peripheral Magno VESPA responses were delayed by more than 20 ms compared with the Full-Range VESPA. This delay was comparable to previous human studies (Lalor & Foxe, 2009) and probably stemmed from the highly reduced contrast range inherent in the Magno VESPA condition. In non-human primate studies, onset latency delays of up to 20 ms have been observed for low-contrast compared with full-contrast stimuli (Reich et al., 2001). The current results provide evidence that processing of lateralized visual stimuli is different in children and adolescents with ASD compared with age-matched controls.
Relative P1 amplitude
For the VEP, the mean relative amplitude for peripheral stimuli was 0.41 (SD = 0.23) in the ASD group and 0.25 (SD = 0.14) for the TD. In the case of the Full-Range VESPA, the mean relative amplitude was 0.41 (SD = 0.37) for the ASD and 0.19 (SD = 0.12) for the TD group. For the Magno VESPA both groups had high relative amplitudes, with the mean ASD at 0.54 (SD = 0.5) and TD at 0.4 (SD = 0.26). The mixed linear model analysis revealed no significant influence of experimental group or any other factor, when all experimental conditions were taken into account. However, as the planned comparisons for the evoked potentials revealed significant differences only for VEP and Full-Range VESPA, we ran another analysis including these two conditions. This resulted in a highly significant influence of group (F1,30 = 9.3, P < 0.005), showing that the increased peripheral amplitudes in ASD compared with TD are indeed due to altered processing of peripheral space. No other factor (age and stimulus type) or interaction between factors reached significance (all P > 0.14).
Correlations with clinical measures
An important question is how anomalies in the representation of peripheral visual space might relate to symptoms of children and adolescents with ASD. Based on our hypothesis of altered visual cortical representations due to eye movement atypicalities, the SBRI scores of the ADOS diagnostic algorithm were expected to be informative, as unusual gaze patterns are coded in this category. While there was no relation between clinical measures and evoked responses for the VEP and the Magno VESPA, we found that for the Full-Range VESPA peripheral amplitudes were linearly related to SBRI scores of the ADOS (Fig. 4). Using a robust regression, which excludes outliers, we found that the relative peripheral amplitude increases by 0.082 for every level of the clinical score (P < 0.01, R2 = 0.2).
Fig. 4.

Relative peripheral P1 amplitude for Full-Range VESPA stimuli plotted against SBRI scores. The dotted line represents the fit obtained using a robust regression.
Further analysing relative peripheral amplitudes and clinical scoring, we examined the SBRI sub-classes ‘Unusual Sensory Interest in Play Material/ Person’ and ‘Hand and Finger and Other Complex Mannerisms’. The ASD group was divided into participants with high relative amplitudes in the Full-Range VESPA and those with low relative amplitudes using a median split. In the SBRI sub-class of ‘Unusual Sensory Interest in Play Material/ Person’, participants with high relative amplitudes had a significantly (P ≪ 0.001, rank-sum = 63) higher score (mean = 1.5) than participants with low relative amplitudes (mean = 0.9). The same pattern held for the SBRI sub-class ‘Hand and Finger and Other Complex Mannerisms’, where high relative amplitude participants had significantly (P ≪ 0.001, rank-sum = 67) higher values (mean = 1.33) than those with low relative scores (mean = 0.6). Taken together, these findings indicate that the peripheral Full-Range VESPA P1 amplitude and clinical measures of unusual sensory interest are closely related.
Topographies
Examining the waveforms suggested that that the timeframe around the P1 component might be the most informative regarding differences between ASD and TD children. As the channels selected for depicting the waveforms represented only a very small subset of the information obtained in the experiments, we also analysed the topographical distribution of activity in the P1 time-frame.
For three of the four VESPA conditions, with the exception of the peripheral Magno VESPA, the topographic distribution of activity was marked by a single midline distribution over occipital scalp, while the VEP response was characterized by bilateral occipital–parietal foci (Fig. 5A). The finding that the VESPA P1 amplitude was more constrained over central occipital areas (Fig. 5B and C) is fully in line with previous studies in adult participants (Lalor et al., 2012; Murphy et al., 2012).
Fig. 5.

Topographies for VEP and VESPA during the P1 timeframe. For each condition the topographies for the ASD group, the TD group, and the difference (ASD-TD) is depicted. Asterisks indicate timeframes with significant differences between the two groups, as defined in the previous section. Note that the difference maps have the same scale, while the scales of other topographies were adjusted to the maximum amplitude in either the ASD or the TD map.
The analysis of P1 topographies showed that, for each experimental condition, the topographical patterns of activation were highly similar between ASD and TD children. For peripheral stimulation, the amplitudes in the P1 timeframe over occipito-parietal areas were generally larger in the ASD group. The topographies indicated that early visual cortical areas have increased response amplitudes for peripheral stimuli in children with ASD.
Magnocellular pathway activation
The current study employed different types of low-level visual stimuli. The Magno VESPA stimuli were designed based on prior knowledge about characteristics of magnocellular neurons. To confirm that the stimuli were strongly biased towards activating the dorsal pathway, we localized the visual activation for centrally presented Full-Range and Magno VESPA stimuli using the MUSIC technique.
The pattern of current sources for the P1 component of the VES-PA was the same for both ASD and TD children. While the Full-Range VESPA stimuli activated regions around the occipital pole, we found current sources to be stronger in areas more dorsal for the Magno stimuli (Fig. 6). The MNI coordinates of the peak activity in the MUSIC map for the Full-Range stimuli were x = 3, y = −98, z = 5 for the TD and x = 13, y = −97, z = 5 for the ASD group. In the case of the Magno stimuli the MNI coordinates were x = −7, y = −76, z = 18 for the TD and x = −11, y = −80, z = −4 for the ASD group. This clear shift of current sources towards more dorsal areas for the Magno stimuli provided evidence that these stimuli biased the response toward the dorsal stream.
Fig. 6.
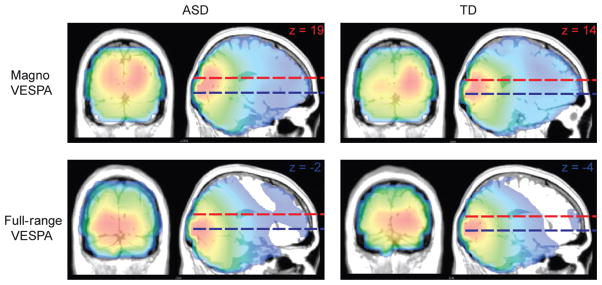
Experimental stimulus manipulation: MUSIC source localization for centrally presented Magno and Full-Range VESPA stimuli during the P1 timeframe (Full-Range VESPA 86–119 ms; Magno VESPA 97–130 ms). The dotted red lines represent the z-coordinate of the peak source amplitude for Magno VESPA stimuli. The blue lines represent the z-coordinate for the Full-Range VESPA stimuli. As expected the peak activity shifts towards more dorsal areas for the Magno VESPA.
Behavioral control task
To ensure that the observed differences in evoked responses were not due to differences in behavior, we analysed reaction times for the control task, percentage of correct responses and horizontal eye position for all stimulus types. The mixed linear model analysis of median reaction times revealed no significant main effect for any of the factors group, age, stimulus type or laterality (Fig. 7, upper panel). There were also no significant interactions between factors. Similarly, for behavioral performance (accuracy) the mixed linear model revealed no significant main effect for any factor and no significant interactions (Fig. 7, lower panel).
Fig. 7.

Mean reaction times (A) and behavioral performance (B) in the experimental task. The gray bars indicate the standard error of the mean (SEM).
Taken together, none of the behavioral measures significantly differed between experimental groups and there were no interactions between the group and any other factor. Therefore, we can assume that the behavioral performance was comparable for the TD and ASD groups.
Eye-movement analysis
Most important for the current study is a thorough examination of eye movements, as consistent differences in eye position between groups might influence visual evoked responses. The mixed linear model analysis of the mean fixation location along the horizontal axis revealed no significant main effect or interaction among the selected factors (Fig. 8), indicating that no group consistently maintained fixation further away from the fixation cross.
Fig. 8.

Mean horizontal eye position in pixels (with SEM) for central and peripheral stimuli. The gray dotted line represents the x-coordinate of the fixation cross. In the peripheral stimulation condition the stimulus was presented 6.2° to the right of fixation. The gray bar represents 1° of visual angle.
However, within the confines of the allowed range of eye movements, differences between the experimental groups might exist. In particular, it is feasible that small eye movements (microsaccades) might differ between groups. For the rate of microsaccades per second, a significant main effect was found for laterality (F1,147.9 = 10.11; P = .002), which was due to an increase in the rate of microsaccades during peripheral stimulation. Even though the mean rate of microsaccades was slightly higher in the ASD group (1.95/s) than the TD group (1.89/s), the factor experimental group was not significant (F1,18.4 = 3.13; P = .093). For the micro-saccade amplitude we found only a significant main effect of laterality (F1,153.9 = 5.8; P < 0.018), with larger amplitudes for central stimulation and no difference between groups. However, the mixed linear model did not produce a good fit for the amplitude of micro-saccades, with high Bayesian information criterion values compared with models for other measures. We therefore examined another measure of variability of small eye movements, the standard deviation (SD) of eye gaze along the horizontal and vertical axes in valid trials. This measure also takes into account slower fixational eye movements called drifts. Examining the SD along the horizontal axis, we found significant main effects for the factors group (F1,26.1 = 8.1; P < 0.01), age (F11,25.7 = 2.4; P < 0.032) and laterality (F1,138.6 = 4.6; P < 0.035). The mean horizontal SD in the ASD group was 7.8 pixels (0.22°), while it was 7.2 (0.2°) for the TD group (Fig. 9). Along the vertical axis, there was only a significant main effect of group (F1,21.9 = 8.4; P < .01). The mean vertical SD in the ASD group was 8.5 pixels (0.24°), while it was 7.5 (0.21°) for the TD group. Even though the differences between groups are between 1 and 2 min of arc, these results indicate that small fixational eye movements are more variable in the ASD population.
Fig. 9.

Variability of horizontal (A) and vertical (B) eye position during fixation measured in pixels. The gray bars indicate the standard error of the mean (SEM).
Influence of sex
The ratio of male to female participants differed between the two groups. To ensure that the reported group effects were not driven by gender differences, we also performed the above analyses without the female participants. For all but one test, the pattern of significant results was the same. In the case of the peripheral VEP P1, the amplitude difference between ASD and TD groups approached significance (t30 = 1.87, P = 0.072). As this trended in the predicted direction, and the other tests replicated the main analyses, we interpret the data based on the main analyses.
Discussion
The current study examined visual processing of central and peripheral inputs in ASD children and adolescents. We hypothesized that their peripheral processing might be altered, as they often exhibit peculiarities in eye-fixation and eye-movement behavior, which probably influence the development of peripheral cortical visual representations. Under this hypothesis, processing of centrally fixated inputs should be largely unaffected, and indeed we found indistinguishable responses between TD and ASD groups for central stimulation for all stimulus types employed. This is not fully consistent with prior reports, as processing differences for central inputs have been reported (Boeschoten et al., 2007; Neumann et al., 2011). Notably, eye position is usually not tightly controlled, as it was here. Thus, differences in cortical representation for different areas of space, or more variability in eye position in one group over the other, could partially account for these differences. In contrast to responses to centrally presented stimuli, we did uncover marked differences in visual responses to stimuli presented to peripheral portions of the retina, a finding replicated across all three stimulus conditions. These peripheral differences reached significance in the timeframe of the P1, indicative of changes in early extrastriate visual areas during relatively early sensory–perceptual processing time-frames (Di Russo et al., 2002; Foxe & Simpson, 2002).
The altered cortical magnification model
The electrophysiological response in the P1 timeframe is generated by multiple visual cortical areas including V1, V2, V3 and V4 (Di Russo et al., 2002). On the other hand, the simple cortical magnification model introduced earlier is entirely based on measurements in V1. Nonetheless, work has shown a general maintenance of spatial mapping patterns across progressively higher levels of the cortical hierarchy, such that one would expect initially reorganized spatial maps to be maintained to at least some degree in later retinotopically mapped regions (Motter, 2009; Harvey & Dumoulin, 2011), although as receptive field sizes progressively increase along the hierarchy, an entirely strict one-to-one maintenance of initial mapping would seem unlikely. As such, a precise match between predictions of the V1-derived model and evoked potential amplitudes representing multiple generators would be not expected. Even so, if we apply this simple model, the cortical area (striate cortex) processing the central stimulus should be about nine times the size of the area processing the peripheral stimulus in our experimental setup. Assuming a 12% decrease in the exponent of the cortical magnification function in ASD, this factor would reduce to about 6.9. The peak P1 amplitude for the Full VESPA is on average 4.9 times bigger for central compared with peripheral presentation in TD, while it is only 2.8 times bigger in the ASD group. For the VEP the ratio of central to peripheral early response is 3.9 in TD and 2.4 in ASD. Even though there is no direct linear relationship between these ratios and the cortical magnification predicted by our model, these values are consistent with the notion that the cortical magnification map is indeed altered in individuals with an ASD.
Note that the VESPA method, which represents only linear aspects of the visual evoked response, exhibits the biggest difference in ratio between TD and ASD. In addition, the Full VESPA is the only measure for which we find a significant correlation with the clinical measure SBRI. It therefore seems that this technique may be especially sensitive to differences between sensory processing in ASD and TD individuals.
The current electrophysiological findings support the hypothesis of altered visuo-cortical representation in ASD. What remain in question are the mechanisms by which these altered representations arise. As mentioned, amblyopia studies illustrate the powerful role that cortical remapping plays in compensating for visuo-motor abnormalities (Conner et al., 2007). However, the severity of oculomotor errors in ASD is clearly not comparable to that seen in strabismic amblyopia. How could more subtle oculomotor abnormalities lead to altered visual representations? A possible mechanism is offered by a recent computational modeling study (Nandy & Tjan, 2012). Before executing a saccade, we generally attend the intended target location covertly in advance of the actual eye movement itself (Deubel & Schneider, 1996; Belyusar et al., 2013) and the crux of this model relates to tight temporal coupling between these covert attentional deployments and the subsequent overt eye movements that typically ensue (Nandy & Tjan, 2012). The model proposes that when the eyes begin to move, the representation of image statistics at the target location, which was acquired through the initial covert attentional deployment, begins to be displaced in the direction of the saccade. One could conceive of this as a form of ‘neural blurring’. In essence, the interaction of attentionally acquired peripheral information and saccade-confounded image displacements is an important contributing factor to the poorer resolution in the periphery. Their quantitative model supports the hypothesis that temporal coupling between covert attention and eye movement image displacements leads to changes in the lateral connections between neurons representing the anticipated saccadic landing location. Paradoxically, one might predict that a decrement in the fidelity of the coupling between these systems would actually lead to better sensitivity to image statistics at more peripheral locations, a notion that has often been applied to autistic individuals (see below). Regardless, given that individuals with autism exhibit more variable and inaccurate eye movements (Goldberg et al., 2002; Takarae et al., 2004; Stanley-Cary et al., 2011), a possible explanation for these inaccuracies to clearly visible target stimuli could well relate to decrements in the temporal coupling of covert attention and overt movements. If so, early cortical representations as established within the lateral connections could be less influenced by these processes in ASD. It is noteworthy that the thesis that altered visual perception in ASD might be a function of atypical neural connectivity in early visual cortices has been previously invoked (Bertone et al., 2005). Based on psychophysical results pointing to reduced discriminability for second-order contrast gratings despite increased discriminability for simple first-order gratings, these authors concluded that lateral inhibition must be enhanced in ASD.
Neuroanatomical studies also support the notion that cortical representations are altered in autism. There are reports of microstructural differences in several parts of neocortex. In post-mortem studies, it has been noted that brains of individuals with ASD exhibit a neuronal microstructure consistent with smaller cortical minicolumns in sensory and higher-order cortices (Casanova et al., 2010). Minicolumns can be conceptualized as an interconnected, vertical group of 80–100 neurons that exhibit similar response characteristics (Mountcastle, 1997). In V1, many of these minicolumns are thought to consist of cells that are responsive to a given spatial orientation, while neighboring minicolumns will prefer another orientation. Minicolumns have been reported to contain fewer cells in ASD, but at the same time, the number of neurons is comparable due to a concomitant increase in the overall number of minicolumns in brains of autistic individuals (Casanova et al., 2002). Even though these studies examined the number of neurons in cortex and not the number of connections, it is very likely that the observed differences in neuronal arrangement are related to, or even caused by, changes in lateral connections. However, as every minicolumn is thought to represent a receptive field (Buxhoeveden & Casanova, 2002), it is conceivable that there is an increase in the number of receptive fields in different cortical areas in ASD. Therefore, the observed increase in response to peripheral visual stimulation could also be explained by an increased number of receptive units per area of peripheral visual space.
Fixational eye movements
It is commonly observed that our eyes produce small eye movements, such as microsaccades and drifts, while we maintain fixation (Martinez-Conde et al., 2013). In the current study, these fixational eye movements are more pronounced in ASD, due to slow drifts, as no significant differences in estimates of microsaccades were found between groups. It is extremely unlikely that the small differences (< 2 min of arc) in the standard deviation of eye position could account for the differences in amplitude of visual evoked responses observed here. Recall that the stimuli used herein subtended fully 6° of visual space, and this variance between groups is two orders of magnitude smaller. Further, the same levels of eye-position variability were also observed for centrally presented stimuli where we found no differences in evoked response between groups. In recent years a number of studies have provided evidence for common generators of saccades and microsaccades (Martinez-Conde et al., 2013). The observed higher variability of eye position during fixation in the ASD participants might therefore mirror studies that reported problems in oculomotor control for saccadic eye movements (Goldberg et al., 2002; Takarae et al., 2004; Stanley-Cary et al., 2011), with higher variability of landing positions in ASD participants.
An alternative attentional account
While an altered cortical representation account of the present findings is the most parsimonious with existing evidence in our view, there are other explanations that should be considered. When humans deploy attention covertly, stimuli at the attended peripheral location receive enhanced processing. This commonly results in greater P1 amplitudes in VEP (Hillyard & Anllo-Vento, 1998; Kelly et al., 2008) and VESPA studies (Frey et al., 2010). Therefore, one possibility is that ASD participants covertly attended the peripherally presented stimuli, or maintained a broader focus of attention than their neurotypical peers. A purely attentional account, however, seems unlikely. We employed an attention-demanding central task during peripheral stimulation. Because neither behavioral performance nor eye-tracking measures differed between ASD and TD groups, it seems likely that both deployed attention equally to the central fixation task.
Relation to previous research
Cortical remapping could account for a number of reported results on visual functioning in autism. For example, it has been reported that individuals with autism exhibit superior performance in visual search tasks (Plaisted et al., 1998; O’Riordan et al., 2001). Such a pattern of results could be explained by an enhanced representation of peripheral space, allowing individuals with ASD to explore their visual environment more efficiently. Another finding that could potentially relate to enhanced representation of peripheral space is lateral glance behavior (Mottron et al., 2007), frequently exhibited by a subpopulation of children with ASD. Lateral glances involve looking at an object while either turning the head in the opposite direction or looking out of the corner of the eye. Although not directly measured, it is assumed that during lateral glances, objects are not projected onto the foveal part of the retina. Mottron and colleagues have speculated that this behavior is employed to reduce the effects of ‘superior, and possibly uncomfortable or overwhelming, processing of low-level visual information’ (Mottron et al., 2007: 33), as acuity of visual representation typically decreases with eccentricity. Based on the current findings, there is an obvious alternative account for these lateral glances. If perception of stimuli in the periphery is enhanced in ASD, then the advantage of central over peripheral stimulation might be reduced, making lateral glances also effective. It is also the case that differential representation of peripheral information would lead to differences in retinotopic mapping, which would also have consequences for perceptual experience. A specific study of peripheral visual representations in the subpopulation of ASD children who exhibit this lateral glance behavior is clearly merited.
Dorsal stream processing
One question is how our finding of increased visual responses for peripherally presented stimuli might fit with the relatively robust finding of impaired processing in posterior superior temporal sulcus (pSTS) in ASD (Dakin & Frith, 2005; Pelphrey et al., 2011), a dorsal region associated with the processing of visual biological motion (Grossman et al., 2005; Michels et al., 2005; Krakowski et al., 2011), social information (Wyk et al., 2009), as well as multisensory integration (Beauchamp et al., 2004; Saint-Amour et al., 2007). Individuals with an ASD exhibit altered hemodynamic responses in pSTS during biological motion processing (Koldewyn et al., 2011) and processing of another person’s gaze (Pelphrey et al., 2005). Multisensory integration has also been shown to be reduced in ASD (Russo et al., 2010; Brandwein et al., 2012). In the current study, the differences between TD and ASD in evoked responses for peripheral stimuli appear to have sources in early visual areas, considerably lower in the hierarchy than pSTS. It is plausible, however, that changes in visual field representations in early visual cortex (such as V1) affect processing in higher cortical areas like pSTS during the initial feed-forward cascade. Recently, two studies provided evidence that visual maps of higher cortical areas can be explained by a constant sampling of the V1 visual field map (Motter, 2009; Harvey & Dumoulin, 2011). This means that at any eccentricity, the receptive field size of a neuron in a higher tier region (e.g. ventral stream area V4) is determined by the size of receptive fields at the corresponding location in the V1 and V2 maps. Therefore, any significant change in receptive field sizes in early visual areas would probably propagate through the hierarchy to affect higher visual areas and ultimately perception. However, to our knowledge, a comparable examination has not been conducted for dorsal stream areas. Future research might elucidate whether alterations in early cortical areas directly affect processing in upstream areas within the dorsal processing stream.
Magnocellular function
In addition to studying visual cortical mapping, the current study also aimed to assess differences in low-level visual processing in individuals with an ASD. The goal was to use an established, sensitive and objective probe of magnocellular processing, and in this way to resolve the question of whether differences in magnocellular function might account for some of the visual processing differences that are so commonly observed in this group. The resulting data strongly favor a model of visual function in ASD in which magnocellular function is intact. Magnocellular-biased visual responses (as measured using the Magno VESPA) were highly similar to, and did not differ significantly from, those recorded in a typically developing control group for centrally presented stimuli. Examination of scalp topographies and source localization data supported successful biasing of the dorsal visual stream, indicating that our measure should be sensitive to magnocellular processing differences were they present.
Limitations of the current study
A caveat should be made about the VESPA technique used here to examine visual processing. The VESPA estimates the brain’s impulse response function assuming a linear relationship between brain activity and stimulus contrast. Non-linear aspects of cortical processing and processing of stimulus features other than contrast are therefore not captured by this version of the technique. This is a limiting factor for inferences drawn from our results. For example, it is known that the firing rate of neurons in early visual cortex increases in a sigmoidal fashion with increasing contrast (Reich et al., 2001). Therefore, for both the Magno (~70% of the contrast values ranging between 3 and 7%) as well as the Full-Range VES-PA (~70% of the contrast values between 30 and 70%), the contrast response in early visual cortex can be approximated by a linear function (Albrecht & Hamilton, 1982).
While less accurate eye movement control has commonly been described in autism, at least one study has reported no differences in a visually guided saccade task (Minshew et al., 1999). Therefore, it is possible that not all participants with ASD exhibit less accurate saccadic eye movements. We did not perform a separate saccadic eye movement task and therefore could not correlate saccadic eye movement accuracy with electrophysiological responses, an obvious avenue for future study.
A number of clinical case reports suggest that the fovea in ASD might be especially hyper-sensitive (Bogdashina, 2003; Gerrard & Rugg, 2009). That is, ASD individuals sometimes report averting direct gaze to alleviate discomfort caused by a sense of over-stimulation from complex or moving stimuli, thereby favoring the use of parafoveal retinal areas. The enhanced electrophysiological responses to peripheral stimuli therefore might be related to the hyper-sensitivity of the fovea. However, we conducted multiple clinical tests with the children and discomfort from foveal stimulation was not reported.
While our aim here was to provide evidence that processing of peripheral visual space is altered during the early sensory processing period in ASD, the resolution of our methods does not allow for localization of these altered representations at the level of specific cortical regions. However, this probably includes the early retinotopically mapped areas (V1 and V2) as well as other early extra-striate regions. These regions are very rapidly activated (see Foxe & Simpson, 2002) and parsing their respective contributions to the early VEP components using source localization, with a sensor array that was relatively sparse (only 72 scalp sites), is not possible. However, an obvious direction for future research would be to use much more precise retinotopic mapping techniques and considerably denser electrode arrays to try to tease apart the respective contribution of these early regions to this remapping (see Kelly et al., 2008; Shpaner et al., 2013 for methods). It would also be instructive to assess how changes in peripheral representation might affect visual perceptual sensitivity at peripheral locations in ASD, as the present study did not explicitly assay potential behavioral effects.
Conclusions
The present electrophysiological results provide evidence that peripheral visual processing is atypical in ASD. We hypothesize that these observed changes in processing are due to altered cortical representations of visual space in ASD, which might be a consequence of the more variable fixation behavior often observed in this population. In contrast to the peripheral stimulation condition, there was no detectable difference between autistic and control children in processing of centrally presented, simple visual stimuli, independent of whether the stimuli were biased towards magnocellular neurons or not. This pattern of results is not in line with a magnocellular deficit theory of autism.
Acknowledgments
We thank Dr Juliana Bates, Alice B. Brandwein, Daniella Blanco, Sarah Ruberman, Kristina Dumas, Joanna Peters and Frantzy Acluche for their valuable support over the course of this project. We acknowledge Dr Jonathan Horton of the Beckman Vision Center at UCSF for very kindly providing area estimates of the cortical magnification factor in squirrel monkey V1 (personal communication with J.J.F.). We also extend our heartfelt gratitude to the children and families who have contributed their time so graciously to participate in this research. This work was primarily supported by a grant from the US National Institute of Mental Health (MH085322 to J.J.F. and S.M.). The Human Clinical Phenotyping Core, where the children enrolled in this study were clinically evaluated, is a facility of the Rose F. Kennedy Intellectual and Developmental Disabilities Research Center (IDDRC), which is funded through a center grant from the Eunice Kennedy Shriver National Institute of Child Health & Human Development (NICHD P30 HD071593). Ongoing support of The Cognitive Neurophysiology Laboratory is provided through a grant from the Sheryl and Daniel R. Tishman Charitable Foundation.
Abbreviations
- AD
analog to digital
- ADI
Autism Diagnostic Interview
- ADOS
Autism Diagnostic Observation Scale
- ASD
autism spectrum disorder
- MUSIC
multiple signal classiffication
- pSTS
posterior superior temporal sulcus
- SBRI
‘Stereotyped Behaviors and Restricted Interests’
- SNR
signal-to-noise ratio
- TD
typically developing
- VEP
visual evoked potential
- VESPA
visual evoked spread spectrum analysis
- WASI
Wechsler Abbreviated Scale of Intelligence
Footnotes
All authors declare no conflict of interest, financial or otherwise, that would have impacted the work reported in this document.
References
- Adams DL, Horton JC. A precise retinotopic map of primate striate cortex generated from the representation of angioscotomas. J Neurosci. 2003;23:3771–3789. doi: 10.1523/JNEUROSCI.23-09-03771.2003. [DOI] [PMC free article] [PubMed] [Google Scholar]
- Albrecht DG, Hamilton DB. Striate cortex of monkey and cat: contrast response function. J Neurophysiol. 1982;48:217–237. doi: 10.1152/jn.1982.48.1.217. [DOI] [PubMed] [Google Scholar]
- American Psychiatric Association. Diagnostic and Statistical Manual of Mental Disorders: DSM-IV-TR. American Psychiatric Association; Washington DC: 2000. [Google Scholar]
- Awater H, Burr D, Lappe M, Morrone MC, Goldberg ME. Effect of saccadic adaptation on localization of visual targets. J Neurophysiol. 2005;93:3605–3614. doi: 10.1152/jn.01013.2003. [DOI] [PubMed] [Google Scholar]
- Baseler HA, Sutter EE. M and P components of the VEP and their visual field distribution. Vision Res. 1997;37:675–690. doi: 10.1016/s0042-6989(96)00209-x. [DOI] [PubMed] [Google Scholar]
- Beauchamp MS, Argall BD, Bodurka J, Duyn JH, Martin A. Unraveling multisensory integration: patchy organization within human STS multisensory cortex. Nat Neurosci. 2004;7:1190–1192. doi: 10.1038/nn1333. [DOI] [PubMed] [Google Scholar]
- Belyusar D, Snyder AC, Frey HP, Harwood MR, Wallman J, Foxe JJ. Oscillatory alpha-band suppression mechanisms during the rapid attentional shifts required to perform an anti-saccade task. Neuro-Image. 2013;65:395–407. doi: 10.1016/j.neuroimage.2012.09.061. [DOI] [PMC free article] [PubMed] [Google Scholar]
- Bertone A, Mottron L, Jelenic P, Faubert J. Enhanced and diminished visuo-spatial information processing in autism depends on stimulus complexity. Brain. 2005;128:2430–2441. doi: 10.1093/brain/awh561. [DOI] [PubMed] [Google Scholar]
- Boeschoten MA, Kenemans JL, van Engeland H, Kemner C. Abnormal spatial frequency processing in high-functioning children with pervasive developmental disorder (PDD) Clin Neurophysiol. 2007;118:2076–2088. doi: 10.1016/j.clinph.2007.05.004. [DOI] [PubMed] [Google Scholar]
- Bogdashina O. Sensory Perceptual Issues in Autism and Asperger Syndrome: Different Sensory Experiences - Different Perceptual Worlds. Jessica Kingsley; London: 2003. [Google Scholar]
- Brandwein AB, Foxe JJ, Butler JS, Russo NN, Altschuler TS, Gomes H, Molholm S. The development of multisensory integration in high-functioning autism: high-density electrical mapping and psychophysical measures reveal impairments in the processing of audiovisual inputs. Cereb Cortex. 2012 doi: 10.1093/cercor/bhs109. Epub ahead of print. [DOI] [PMC free article] [PubMed] [Google Scholar]
- Butler PD, Martinez A, Foxe JJ, Kim D, Zemon V, Silipo G, Mahoney J, Shpaner M, Jalbrzikowski M, Javitt DC. Subcortical visual dysfunction in schizophrenia drives secondary cortical impairments. Brain. 2007;130:417–430. doi: 10.1093/brain/awl233. [DOI] [PMC free article] [PubMed] [Google Scholar]
- Buxhoeveden DP, Casanova MF. The minicolumn hypothesis in neuroscience. Brain. 2002;125:935–951. doi: 10.1093/brain/awf110. [DOI] [PubMed] [Google Scholar]
- Casanova MF, Buxhoeveden DP, Switala AE, Roy E. Minicolumnar pathology in autism. Neurology. 2002;58:428–432. doi: 10.1212/wnl.58.3.428. [DOI] [PubMed] [Google Scholar]
- Casanova MF, El-Baz A, Vanbogaert E, Narahari P, Switala A. A topographic study of minicolumnar core width by lamina comparison between autistic subjects and controls: possible minicolumnar disruption due to an anatomical element in-common to multiple laminae. Brain Pathol. 2010;20:451–458. doi: 10.1111/j.1750-3639.2009.00319.x. [DOI] [PMC free article] [PubMed] [Google Scholar]
- Conner IP, Odom JV, Schwartz TL, Mendola JD. Retinotopic maps and foveal suppression in the visual cortex of amblyopic adults. J Physiol. 2007;583:159–173. doi: 10.1113/jphysiol.2007.136242. [DOI] [PMC free article] [PubMed] [Google Scholar]
- Connolly M, Van Essen D. The representation of the visual field in parvicellular and magnocellular layers of the lateral geniculate nucleus in the macaque monkey. J Comp Neurol. 1984;226:544–564. doi: 10.1002/cne.902260408. [DOI] [PubMed] [Google Scholar]
- Dakin S, Frith U. Vagaries of visual perception in autism. Neuron. 2005;48:497–507. doi: 10.1016/j.neuron.2005.10.018. [DOI] [PubMed] [Google Scholar]
- Dalton KM, Nacewicz BM, Johnstone T, Schaefer HS, Gernsbacher MA, Goldsmith HH, Alexander AL, Davidson RJ. Gaze fixation and the neural circuitry of face processing in autism. Nat Neurosci. 2005;8:519–526. doi: 10.1038/nn1421. [DOI] [PMC free article] [PubMed] [Google Scholar]
- Daniel PM, Whitteridge D. The representation of the visual field on the cerebral cortex in monkeys. J Physiol. 1961;159:203–221. doi: 10.1113/jphysiol.1961.sp006803. [DOI] [PMC free article] [PubMed] [Google Scholar]
- Deubel H, Schneider WX. Saccade target selection and object recognition: evidence for a common attentional mechanism. Vision Res. 1996;36:1827–1837. doi: 10.1016/0042-6989(95)00294-4. [DOI] [PubMed] [Google Scholar]
- Di Russo F, Martinez A, Sereno MI, Pitzalis S, Hillyard SA. Cortical sources of the early components of the visual evoked potential. Hum Brain Mapp. 2002;15:95–111. doi: 10.1002/hbm.10010. [DOI] [PMC free article] [PubMed] [Google Scholar]
- Engbert R, Kliegl R. Microsaccades uncover the orientation of covert attention. Vision Res. 2003;43:1035–1045. doi: 10.1016/s0042-6989(03)00084-1. [DOI] [PubMed] [Google Scholar]
- Foxe JJ, Simpson GV. Flow of activation from V1 to frontal cortex in humans. A framework for defining ‘early’ visual processing. Exp Brain Res. 2002;142:139–150. doi: 10.1007/s00221-001-0906-7. [DOI] [PubMed] [Google Scholar]
- Foxe JJ, Strugstad EC, Sehatpour P, Molholm S, Pasieka W, Schroeder CE, McCourt ME. Parvocellular and magnocellular contributions to the initial generators of the visual evoked potential: high-density electrical mapping of the ‘C1’ component. Brain Topogr. 2008;21:11–21. doi: 10.1007/s10548-008-0063-4. [DOI] [PubMed] [Google Scholar]
- Frey HP, Kelly SP, Lalor EC, Foxe JJ. Early spatial attentional modulation of inputs to the fovea. J Neurosci. 2010;30:4547–4551. doi: 10.1523/JNEUROSCI.5217-09.2010. [DOI] [PMC free article] [PubMed] [Google Scholar]
- Gerrard S, Rugg G. Sensory impairments and autism: a re-examination of causal modelling. J Autism Dev Disord. 2009;39:1449–1463. doi: 10.1007/s10803-009-0773-9. [DOI] [PubMed] [Google Scholar]
- Goldberg MC, Lasker AG, Zee DS, Garth E, Tien A, Landa RJ. Deficits in the initiation of eye movements in the absence of a visual target in adolescents with high functioning autism. Neuropsychologia. 2002;40:2039–2049. doi: 10.1016/s0028-3932(02)00059-3. [DOI] [PubMed] [Google Scholar]
- Grossman ED, Battelli L, Pascual-Leone A. Repetitive TMS over posterior STS disrupts perception of biological motion. Vision Res. 2005;45:2847–2853. doi: 10.1016/j.visres.2005.05.027. [DOI] [PubMed] [Google Scholar]
- Guthrie D, Buchwald JS. Significance testing of difference potentials. Psychophysiology. 1991;28:240–244. doi: 10.1111/j.1469-8986.1991.tb00417.x. [DOI] [PubMed] [Google Scholar]
- Harvey BM, Dumoulin SO. The relationship between cortical magnification factor and population receptive field size in human visual cortex: constancies in cortical architecture. J Neurosci. 2011;31:13604–13612. doi: 10.1523/JNEUROSCI.2572-11.2011. [DOI] [PMC free article] [PubMed] [Google Scholar]
- Hernandez N, Metzger A, Magne R, Bonnet-Brilhault F, Roux S, Barthelemy C, Martineau J. Exploration of core features of a human face by healthy and autistic adults analyzed by visual scanning. Neuropsychologia. 2009;47:1004–1012. doi: 10.1016/j.neuropsychologia.2008.10.023. [DOI] [PubMed] [Google Scholar]
- Hillyard SA, Anllo-Vento L. Event-related brain potentials in the study of visual selective attention. Proc Natl Acad Sci USA. 1998;95:781–787. doi: 10.1073/pnas.95.3.781. [DOI] [PMC free article] [PubMed] [Google Scholar]
- Jedynak A, Skrandies W. Functional perimetry combined with topographical VEP analysis. Int J Neurosci. 1998;93:117–132. doi: 10.3109/00207459808986417. [DOI] [PubMed] [Google Scholar]
- Joseph RM, Keehn B, Connolly C, Wolfe JM, Horowitz TS. Why is visual search superior in autism spectrum disorder? Developmental Sci. 2009;12:1083–1096. doi: 10.1111/j.1467-7687.2009.00855.x. [DOI] [PMC free article] [PubMed] [Google Scholar]
- Kaplan E, Shapley RM. The primate retina contains two types of ganglion cells, with high and low contrast sensitivity. Proc Natl Acad Sci USA. 1986;83:2755–2757. doi: 10.1073/pnas.83.8.2755. [DOI] [PMC free article] [PubMed] [Google Scholar]
- Kelly SP, Gomez-Ramirez M, Foxe JJ. Spatial attention modulates initial afferent activity in human primary visual cortex. Cereb Cortex. 2008;18:2629–2636. doi: 10.1093/cercor/bhn022. [DOI] [PMC free article] [PubMed] [Google Scholar]
- Kliemann D, Dziobek I, Hatri A, Steimke R, Heekeren HR. Atypical reflexive gaze patterns on emotional faces in autism spectrum disorders. J Neurosci. 2010;30:12281–12287. doi: 10.1523/JNEUROSCI.0688-10.2010. [DOI] [PMC free article] [PubMed] [Google Scholar]
- Klin A, Jones W, Schultz R, Volkmar F, Cohen D. Visual fixation patterns during viewing of naturalistic social situations as predictors of social competence in individuals with autism. Arch Gen Psychiat. 2002;59:809–816. doi: 10.1001/archpsyc.59.9.809. [DOI] [PubMed] [Google Scholar]
- Koldewyn K, Whitney D, Rivera SM. Neural correlates of coherent and biological motion perception in autism. Developmental Sci. 2011;14:1075–1088. doi: 10.1111/j.1467-7687.2011.01058.x. [DOI] [PMC free article] [PubMed] [Google Scholar]
- Krakowski AI, Ross LA, Snyder AC, Sehatpour P, Kelly SP, Foxe JJ. The neurophysiology of human biological motion processing: a high-density electrical mapping study. NeuroImage. 2011;56:373–383. doi: 10.1016/j.neuroimage.2011.01.058. [DOI] [PMC free article] [PubMed] [Google Scholar]
- Lalor EC, Foxe JJ. Visual evoked spread spectrum analysis (VESPA) responses to stimuli biased towards magnocellular and parvocellular pathways. Vision Res. 2009;49:127–133. doi: 10.1016/j.visres.2008.09.032. [DOI] [PubMed] [Google Scholar]
- Lalor EC, Pearlmutter BA, Reilly RB, McDarby G, Foxe JJ. The VESPA: a method for the rapid estimation of a visual evoked potential. NeuroImage. 2006;32:1549–1561. doi: 10.1016/j.neuroimage.2006.05.054. [DOI] [PubMed] [Google Scholar]
- Lalor EC, Pearlmutter BA, Foxe JJ. Reverse correlation and the VESPA method. In: Handy TC, editor. Brain Signal Analysis: Advances in Neuroelectric and Neuromagnetic Methods. The MIT Press; Cambridge, Massachussets: 2009. pp. 1–20. [Google Scholar]
- Lalor EC, Kelly SP, Foxe JJ. Generation of the VESPA response to rapid contrast fluctuations is dominated by striate cortex: evidence from retinotopic mapping. Neuroscience. 2012;218:226–234. doi: 10.1016/j.neuroscience.2012.05.067. [DOI] [PMC free article] [PubMed] [Google Scholar]
- Le Couteur A, Rutter M, Lord C, Rios P, Robertson S, Holdgrafer M, McLennan J. Autism diagnostic interview: a standardized investigator-based instrument. J Autism Dev Disord. 1989;19:363–387. doi: 10.1007/BF02212936. [DOI] [PubMed] [Google Scholar]
- Lee BB, Pokorny J, Smith VC, Martin PR, Valberg A. Luminance and chromatic modulation sensitivity of macaque ganglion cells and human observers. J Opt Soc Am A. 1990;7:2223–2236. doi: 10.1364/josaa.7.002223. [DOI] [PubMed] [Google Scholar]
- Lord C, Risi S, Lambrecht L, Cook EH, Jr, Leventhal BL, DiLavore PC, Pickles A, Rutter M. The autism diagnostic observation schedule-generic: a standard measure of social and communication deficits associated with the spectrum of autism. J Autism Dev Disord. 2000;30:205–223. [PubMed] [Google Scholar]
- Martinez-Conde S, Macknik SL, Troncoso XG, Dyar TA. Microsaccades counteract visual fading during fixation. Neuron. 2006;49:297–305. doi: 10.1016/j.neuron.2005.11.033. [DOI] [PubMed] [Google Scholar]
- Martinez-Conde S, Otero-Millan J, Macknik SL. The impact of microsaccades on vision: towards a unified theory of saccadic function. Nat Rev Neurosci. 2013;14:83–96. doi: 10.1038/nrn3405. [DOI] [PubMed] [Google Scholar]
- Michels L, Lappe M, Vaina LM. Visual areas involved in the perception of human movement from dynamic form analysis. Neuro-Report. 2005;16:1037–1041. doi: 10.1097/00001756-200507130-00002. [DOI] [PubMed] [Google Scholar]
- Milne E, Swettenham J, Hansen P, Campbell R, Jeffries H, Plaisted K. High motion coherence thresholds in children with autism. J Child Psychol Psyc. 2002;43:255–263. doi: 10.1111/1469-7610.00018. [DOI] [PubMed] [Google Scholar]
- Minshew NJ, Luna B, Sweeney JA. Oculomotor evidence for neocortical systems but not cerebellar dysfunction in autism. Neurology. 1999;52:917–922. doi: 10.1212/wnl.52.5.917. [DOI] [PMC free article] [PubMed] [Google Scholar]
- Mishkin M, Ungerleider LG. Contribution of striate inputs to the visuospatial functions of parieto-preoccipital cortex in monkeys. Behav Brain Res. 1982;6:57–77. doi: 10.1016/0166-4328(82)90081-x. [DOI] [PubMed] [Google Scholar]
- Motter BC. Central V4 receptive fields are scaled by the V1 cortical magnification and correspond to a constant-sized sampling of the V1 surface. J Neurosci. 2009;29:5749–5757. doi: 10.1523/JNEUROSCI.4496-08.2009. [DOI] [PMC free article] [PubMed] [Google Scholar]
- Mottron L, Mineau S, Martel G, Bernier CS, Berthiaume C, Dawson M, Lemay M, Palardy S, Charman T, Faubert J. Lateral glances toward moving stimuli among young children with autism: early regulation of locally oriented perception? Dev Psychopathol. 2007;19:23–36. doi: 10.1017/S0954579407070022. [DOI] [PubMed] [Google Scholar]
- Mountcastle VB. The columnar organization of the neocortex. Brain. 1997;120(Pt 4):701–722. doi: 10.1093/brain/120.4.701. [DOI] [PubMed] [Google Scholar]
- Murphy JW, Kelly SP, Foxe JJ, Lalor EC. Isolating early cortical generators of visual-evoked activity: a systems identification approach. Exp Brain Res. 2012;220:191–199. doi: 10.1007/s00221-012-3129-1. [DOI] [PubMed] [Google Scholar]
- Nandy AS, Tjan BS. Saccade-confounded image statistics explain visual crowding. Nat Neurosci. 2012;15:463–469. doi: 10.1038/nn.3021. [DOI] [PMC free article] [PubMed] [Google Scholar]
- Neumann N, Dubischar-Krivec AM, Poustka F, Birbaumer N, Bolte S, Braun C. Electromagnetic evidence of altered visual processing in autism. Neuropsychologia. 2011;49:3011–3017. doi: 10.1016/j.neuropsychologia.2011.06.028. [DOI] [PubMed] [Google Scholar]
- O’Riordan MA, Plaisted KC, Driver J, Baron-Cohen S. Superior visual search in autism. J Exp Psychol Human. 2001;27:719–730. doi: 10.1037//0096-1523.27.3.719. [DOI] [PubMed] [Google Scholar]
- Pascual-Marqui RD. Standardized low-resolution brain electromagnetic tomography (sLORETA): technical details. Method Find Exp Clin. 2002;24(Suppl D):5–12. [PubMed] [Google Scholar]
- Pelphrey KA, Sasson NJ, Reznick JS, Paul G, Goldman BD, Piven J. Visual scanning of faces in autism. J Autism Dev Disord. 2002;32:249–261. doi: 10.1023/a:1016374617369. [DOI] [PubMed] [Google Scholar]
- Pelphrey KA, Morris JP, McCarthy G. Neural basis of eye gaze processing deficits in autism. Brain. 2005;128:1038–1048. doi: 10.1093/brain/awh404. [DOI] [PubMed] [Google Scholar]
- Pelphrey KA, Shultz S, Hudac CM, Vander Wyk BC. Research review: constraining heterogeneity: the social brain and its development in autism spectrum disorder. J Child Psychol Psyc. 2011;52:631–644. doi: 10.1111/j.1469-7610.2010.02349.x. [DOI] [PMC free article] [PubMed] [Google Scholar]
- Plaisted K, O’Riordan M, Baron-Cohen S. Enhanced visual search for a conjunctive target in autism: a research note. J Child Psychol Psyc. 1998;39:777–783. [PubMed] [Google Scholar]
- Reich DS, Mechler F, Victor JD. Temporal coding of contrast in primary visual cortex: when, what, and why. J Neurophysiol. 2001;85:1039–1050. doi: 10.1152/jn.2001.85.3.1039. [DOI] [PubMed] [Google Scholar]
- Rice K, Moriuchi JM, Jones W, Klin A. Parsing heterogeneity in autism spectrum disorders: visual scanning of dynamic social scenes in school-aged children. J Am Acad Child Psy. 2012;51:238–248. doi: 10.1016/j.jaac.2011.12.017. [DOI] [PMC free article] [PubMed] [Google Scholar]
- Robertson CE, Martin A, Baker CI, Baron-Cohen S. Atypical integration of motion signals in autism spectrum conditions. PLoS ONE. 2012;7:e48173. doi: 10.1371/journal.pone.0048173. [DOI] [PMC free article] [PubMed] [Google Scholar]
- Russo N, Foxe JJ, Brandwein AB, Altschuler T, Gomes H, Molholm S. Multisensory processing in children with autism: high-density electrical mapping of auditory-somatosensory integration. Autism Res. 2010;3:253–267. doi: 10.1002/aur.152. [DOI] [PubMed] [Google Scholar]
- Saint-Amour D, De Sanctis P, Molholm S, Ritter W, Foxe JJ. Seeing voices: high-density electrical mapping and source-analysis of the multisensory mismatch negativity evoked during the McGurk illusion. Neuropsychologia. 2007;45:587–597. doi: 10.1016/j.neuropsychologia.2006.03.036. [DOI] [PMC free article] [PubMed] [Google Scholar]
- Schlykowa L, van Dijk BW, Ehrenstein WH. Motion-onset visual-evoked potentials as a function of retinal eccentricity in man. Brain Res Cogn Brain Res. 1993;1:169–174. doi: 10.1016/0926-6410(93)90024-y. [DOI] [PubMed] [Google Scholar]
- Shpaner M, Molholm S, Forde E, Foxe JJ. Disambiguating the roles of area V1 and the lateral occipital complex (LOC) in contour integration. NeuroImage. 2013;69:146–156. doi: 10.1016/j.neuroimage.2012.11.023. [DOI] [PMC free article] [PubMed] [Google Scholar]
- Spencer J, O’Brien J, Riggs K, Braddick O, Atkinson J, Wattam-Bell J. Motion processing in autism: evidence for a dorsal stream deficiency. NeuroReport. 2000;11:2765–2767. doi: 10.1097/00001756-200008210-00031. [DOI] [PubMed] [Google Scholar]
- Stanley-Cary C, Rinehart N, Tonge B, White O, Fielding J. Greater disruption to control of voluntary saccades in autistic disorder than Asperger’s disorder: evidence for greater cerebellar involvement in autism? Cerebellum. 2011;10:70–80. doi: 10.1007/s12311-010-0229-y. [DOI] [PubMed] [Google Scholar]
- Sutherland A, Crewther DP. Magnocellular visual evoked potential delay with high autism spectrum quotient yields a neural mechanism for altered perception. Brain. 2010;133:2089–2097. doi: 10.1093/brain/awq122. [DOI] [PubMed] [Google Scholar]
- Takarae Y, Minshew NJ, Luna B, Sweeney JA. Oculomotor abnormalities parallel cerebellar histopathology in autism. J Neurol Neurosur Ps. 2004;75:1359–1361. doi: 10.1136/jnnp.2003.022491. [DOI] [PMC free article] [PubMed] [Google Scholar]
- Tootell RB, Silverman MS, Switkes E, De Valois RL. Deoxyglucose analysis of retinotopic organization in primate striate cortex. Science. 1982;218:902–904. doi: 10.1126/science.7134981. [DOI] [PubMed] [Google Scholar]
- Wechsler D. Wechsler abbreviated scale of intelligence. Psychological Corporation; San Antonio, Texas: 1999. [Google Scholar]
- Wyk BC, Hudac CM, Carter EJ, Sobel DM, Pelphrey KA. Action understanding in the superior temporal sulcus region. Psychol Sci. 2009;20:771–777. doi: 10.1111/j.1467-9280.2009.02359.x. [DOI] [PMC free article] [PubMed] [Google Scholar]