

Abstract
The kidney developmental program encodes the intricate branching and organization of approximately 1 million functional units (nephrons). Branching regulation is poorly understood, as is the source of a 10-fold variation in nephron number. Notably, low nephron count increases the risk for developing hypertension and renal failure. To better understand the source of this variation, we analyzed the complete gestational trajectory of mouse kidney development. We constructed a computerized architectural map of the branching process throughout fetal life and found that organogenesis is composed of two distinct developmental phases, each with stage-specific rate and morphologic parameters. The early phase is characterized by a rapid acceleration in branching rate and by branching divisions that repeat with relatively reproducible morphology. The latter phase, however, is notable for a significantly decreased yet constant branching rate and the presence of nonstereotyped branching events that generate progressive variability in tree morphology until birth. Our map identifies and quantitates the contribution of four developmental mechanisms that guide organogenesis: growth, patterning, branching rate, and nephron induction. When applied to organs that developed under conditions of malnutrition or in the setting of growth factor mutation, our normative map provided an essential link between kidney architecture and the fundamental morphogenetic mechanisms that guide development. This morphogenetic map is expected to find widespread applications and help identify modifiable targets to prevent developmental programming of common diseases.
Keywords: kidney development, branching morphogenesis, variability, nephron number
The mammalian kidney is composed of a ramified network of epithelial tubes arranged in intricate and reproducible patterns. The structure of the ureteric tree is established via ongoing interactions between the ureteric bud (UB) and metanephric mesenchyme (MM) (Supplemental Figure 1). Human kidney development occurs entirely in utero. Prematurity, maternal stress, and nutrient deficiencies are among factors that increase risk of fetally programmed disease.1,2 Brenner et al. postulated that such influences might reduce nephron count and numerous studies have since shown that low nephron number is associated with increased risk of essential hypertension.3,4 Moreover, a marked 10-fold range in nephron number has been observed between various patient populations undergoing autopsy for unexpected death.5,6 To understand the source of this variation, a comprehensive map of the branching tree is needed. Here we report the complete spatial-temporal trajectory of kidney development throughout intrauterine life in the form of a computerized architectural map.
We developed a stereohistologic method that utilizes confocal imaging and reconstruction tools to resolve three-dimensional branching structures throughout the entire course of gestation at unprecedented resolution. Our developmental map identifies two distinct phases characterized by specific branching rates, growth, and variation in the reproducibility of branching pattern. A critical window is also identified when intrauterine stressors may maximally affect kidney development. Whereas previous studies of organogenesis proposed genetic models that encode robust and stereotyped branching events,7,8 our study outlines that the late developmental program, previously not analyzed, specifies inherent asymmetry, variability, and progressive complexity in branching architecture. These results provide important new insights into the factors that determine nephron number and, more generally, that control branching rate and trajectory.
We applied our normative map to analyze organogenesis under various pathologic conditions. In each case, effects on branching rate, branch segment number, tree morphology, and efficiency of nephron induction were deficiency specific and quantifiable. Because congenital and intrauterine defects are a common cause of renal failure, our detailed models of kidney development and its sensitivity to environmental insults may help to identify therapeutic targets to aid organogenesis. The temporal-spatial analysis presented here provides an essential link between kidney architecture and the fundamental developmental programs that regulate branching and nephron formation throughout fetal life.
Results
A Map of Branching Morphogenesis throughout Gestation
To analyze the sequence of events that forms the mammalian kidney, we constructed a spatial map of normal kidney development throughout gestation. Morphologic measurements including branch segment length, diameter and volume, branching angle, branching lineage and tree geometry were computed for each specimen.
Branching Rate Varies over Two Developmental Time Windows
Figure 1 presents daily three-dimensional reconstructions of the ureteric tree and provides a trajectory of branching morphogenesis throughout intrauterine development. Relevant parameters are summarized in Figure 2A and Supplemental Table 1. We detected 587 tips at E15.5 compared with similar reports of 362 and 534 that utilized immunofluorescence microscopy and optical projection tomography, respectively.8,9 These differences may arise from variation in genetic background, imaging, and counting techniques. In addition, the standard overnight mating period introduces slight age variation.
Figure 1.
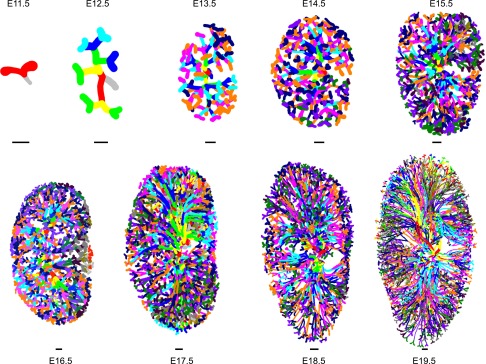
Reconstruction of the ureteric tree throughout intrauterine development. One representative three-dimensional tracing is shown for each gestational day. Each successive branching generation is represented by a different color. Note that the color scheme is repeated after 14 branching orders starting at E15.5. Scale bar, 100 μm.
Figure 2.

Growth and branching rates throughout gestation. (A) Growth curves for total tip and glomerulus count at each day (semi-log2 plot). The rate of glomerulus formation lags behind tip formation. Vertical bars represent variance. (B) Observed tip branching probability per day calculated from the time course of the mean in A. Early and late branching phases are indicated.
To analyze intrauterine branching rates, we calculated differences in tip numbers between consecutive days and normalized these over gestation (see the Concise Methods). The resultant biphasic rate curve is composed of two distinct developmental windows of approximately 4 days each, which we designate as the early and late branching phases (Figure 2B). The former spans E11.5 to E15.5 and is characterized by a burst in branching rate that peaks at E13.5. The late phase spans E15.5 to E19.5 and is defined by a constant and considerably slower rate. Overall, we calculate a 149-fold and a 5.6-fold increase in the number of new tips generated during the early and late branching phases, respectively. The maximal branching rate falls within midpregnancy, a vulnerable period when critical structures are forming, and is consistent with studies that correlated midgestation starvation with impaired adult renal function.10,11
Binary Stereotyped Branching Dominates the Early Branching Phase
Within the context of these differential rates, we analyzed associated morphologic processes that shape organogenesis. A stereotyped, repeating bifurcating branching pattern predominates during the early phase. Specifically, initial branching events are highly reproducible because most divisions produce two daughters. This is shown at E12.5 in the three-dimensional tracing (Figure 3A) and in the form of a dendrogram (Figure 3B). Most divisions are bifurcating (Supplemental Figure 2A) although some are trifurcating (Supplemental Figure 2B), consistent with previous reports.12
Figure 3.

Stereotyped and variable branching patterns. (A) Three-dimensional tracing representing the topology and lineage of binary (blue) and variable (red) branching patterns at E12.5. (B) Dendrograms are tree diagrams that are generated from the manual tracing of each specimen that outline branch lengths and lineage. Horizontal lines represent measured branch lengths, and intersections represent branch nodes. Vertical line lengths are arbitrary. Numbers represent centrifugal order assignment of nodes where the root is shown by order 0. Early branching events follow a stereotyped pattern such that, on average, two daughters are produced per division. These (shown in blue) comprise a full binary tree (also see Supplemental Figure 3). (C) The tracing at E13.5 localizes blue segments to the interior and red to the periphery and tips. (D) Representative dendrogram at E13.5. Segments shown in red represent branch processes outside the full binary tree that are composed of asymmetric and variable patterns. (E) The graph shows maximum branch orders occupied by the stereotyped and variable patterns during gestation. At each day, the height (maximum order) of the full binary tree generated by stereotyped branching events increases linearly (blue). However, the curve for subtrees that divide beyond the full binary tree significantly increases at the beginning of the late branching phase (red). This slope reflects progressive contribution of variable pattering until birth. (F) Average total node number per order in four kidneys taken from littermates at E13.5. Ureteric tree branching for orders 1 to about 5 primarily form by bifurcation of each tip and show an exponential growth phase. Thereafter, variance (vertical bars) increases as branches from orders 6–10 occupy increasingly different configurations. (G) The curve for branch segment lengths summed over each order shows analogous shape and behavior. Similar curves were found on all gestational days (data not shown).
As branching rate rapidly accelerates during the early phase, not all parent nodes produce two daughters; a subset of processes will branch out to higher order. These notably populate the upper and lower poles, requiring a greater number of branch iterations to extend farther from the origin. This is shown on day E13.5 (Figure 3, C and D) in which, within the branches colored in blue, each and every node divides to produce two daughter segments (although occasionally three). Supplemental Figure 3 outlines a similarly sized tree that comprises a full binary tree defined by height h and (2h+1−1) vertices.13 Thus, significant stereotypy is observed early on in age-matched kidneys, primarily because the majority of lower-order branching divisions utilize a bifurcating replication pattern. Segments that divide beyond this full binary tree are shown to branch with more variability (in red). Some of these divisions are binary but repeat to higher order than others and some are trefoil. These set the stage for progressive asymmetry required to sculpt the irregular kidney shape.
The Developmental History of Kidney Modularity
From an anatomic perspective, kidneys are modular. Human studies have outlined the existence of six and four conserved lobes in the upper and lower poles, respectively.14 Our results show that this modularity can be traced to early branching events. In all kidneys studied, a specific branch consistently arises from the upper main stem and establishes gross asymmetry by E12.5 (Figure 1, Supplemental Figure 2C). This buds off in a lateral orientation from a preexisting segment instead of a tip, a motif previously described in culture and kidney explants.12 Branch descendants can be traced from E12.5 to E13.0 to E19.5 (Supplemental Figure 4) as this segment develops into a lateral lobe (yellow). Overall, the developmental program of the kidney provides instructions that generate gross asymmetry.
Stochastic Events Modulate Patterning during the Late Branching Phase
The late branching phase initiates at E15.5 with a marked decrease in branching rate that remains active over an increasing population of tips. This precludes division of each and every tip. Stochasticity in branching pattern becomes more prominent during this phase as terminal segments are progressively added in variable patterns and play a role in sculpting the kidney’s unique shape. The curve in Figure 3E shows that throughout intrauterine life, the maximum branching order of segments that comprise a full binary tree follows a linear pattern (blue curve). However, the maximum branching order of segments that are added in variable spatial patterns begins to outweigh the progress of the full binary tree at E15.5 (red curve), notably timed with onset of the late phase.
An example of the degree of variability is outlined in Figure 3, F and G, and shows increasing statistical variance in node number and segment lengths over terminal branch orders in E13.5 littermate (identically aged) kidneys. Low variance at orders 1–5 is due to the dominant binary stereotyped pattern, but increasing noise between 6 and 10 reflects greater variation in node occupancy. Corresponding branches are characterized by increasing stochasticity in developmental pattern. More detailed comparison of these littermate kidneys shows that terminal branching patterns are similar but not identical (Figure 4, Supplemental Figure 5). Even right and left kidneys dissected from a single embryo display unique branching patterns (Supplemental Figure 6). Thus the ureteric tree, particularly at the periphery, is composed of an array of asymmetrically branched processes of varying order, length, and lineage. In other words, there does not appear to be a “wave” of uniform branching per tip. Rather, each process (from origin to tip) is characterized by its own specific morphology.
Figure 4.

Symmetry, asymmetry, and stochasticity in kidney development. (A) Dendrogram for E13.5 wild-type kidney showing lineage of each tree. Colored ellipses outline four lobes in the upper and three lobes in the lower half of the kidney. These are defined by clusters of associated nodes and branch segments, are conserved in all kidneys studied, and correlate with kidney anatomy. (B) The dendrogram adjusted radially to show two-dimensional lobe arrangement. (C) The average number of tips present within each lobe is indicated. n=4 kidneys, each extracted from each of four (identically aged) littermates at E13.5.
Nephron Induction Occurs in the Late Branching Phase
Mature glomeruli (a marker for nephron formation) begin to appear at E13.5, a delay that reflects UB and MM comaturation. Average branch tip to glomerulus stoichiometry is 5:1 until E19.5, when approximately 3000 tips and 1000 morphologically mature glomeruli are formed. At birth, the tip count in newborn mice is estimated by extrapolation to be 4000. This is consistent with other estimates at E19.5 ranging from 3000 clusters of condensed mesenchyme8 to 8000 glomeruli in all stages from the S-shaped body to maturity.9
Global Remodeling and Sculpting of the Tree Occurs during the Late Branching Phase
At E15.5, a central cavity forms at the origin (Supplemental Figure 7A), coinciding with initiation of urine flow.15 Supplemental Figure 7B shows simultaneous proliferation and apoptosis as the initial branch segments are remodeled. By E16.5, segments comprising the first two branching orders begin to be resorbed into the expanding renal pelvis (Supplemental Figure 7C). At E19.5, further erosion creates seven independent subtrees (Supplemental Figures 4 and 7D), indicating that approximately three orders (23) have undergone significant remodeling.
Despite the finding that branching rate markedly decreases during the late phase, the kidney’s upper-to-lower pole length increases 3-fold. On subsequent days, differential elongation of low-order branch segments was observed (Supplemental Figure 7E). This directed growth in the longitudinal axis is timed to rapid cranial-caudal elongation of the fetal body.16
Mapping of Growth Curves throughout Kidney Development
To delineate the developmental trajectory, we mapped the growth of the branching network throughout gestation. Normal growth curves for four select ages are analyzed in Figure 5A. In each, the left curve edge shows a rapid rise in the total number of segments per order (n=order, slope approximately 2n). Thus, the subset of the tree represented within this exponential portion of the curve is characterized by minimal variability simply because most of the branching events are dichotomous and almost each and every node produces two daughter segments. At higher orders, total branch numbers smoothly decline reflecting the decreasing quantity of high (from origin to tip) order branch processes. The area under the curve (AUC) is calculated by summing the number of branches over each order and represents the total number of branch segments in the entire tree. From this family of curves, we are able to extract growth and branching rates, the number and distribution of branch segments per generation, and maximal branching order.
Figure 5.

Growth curves and architecture of wild-type and mutant kidneys. (A) Wild-type segment distribution at embryonic days E13.5, E15.5, E17.5, and E19.5. The total number of branch segments per order is plotted. The left edge of each curve increases exponentially between orders 1 and 6 for E13.5, 1 and 7 for E15.5, 1 and 8 for E17.5, and 1 and 9 for E19.5. The right tail represents the average maximal number of branching generations at each age. The AUC represents the total number of segments per kidney. Characteristic curve shape is maintained at each day of gestation. (B) E15.5 ureteric tree tracings for each condition (to scale). N is the maximum generation number and glom represents the mean glomerular count (minimum of three kidneys studied per condition). In each case, glomerular count is reduced compared with the wild type. The number of branching generations is specific to each condition. (C) Growth curves for each deficient condition are in red at E15.5. The E15.5 wild type is shown in gray. In the case of the FGF7 mutant, the E14.5 wild type is shown in blue. WT, wild type; Vit, vitamin.
Application of the Normative Map to Mutation and Maternal-Fetal Malnutrition
To explain the observed variation in human nephron number and to determine whether our model is consistent with known nephron defects, we assayed effects of genetic and nutritional deficiencies known to affect nephron number at E15.5, an age when major features have formed and branching rate has stabilized. We analyzed induced changes in growth curves, branch lineage, and complete geometries in an attempt to correlate specific morphogenetic abnormalities with mechanisms of branching and nephron formation.
Fibroblast Growth Factor-7 Knockout
Fibroblast growth factor-7 (FGF7) plays a key role in branching and nephron number specification.17,18 We found that gross organ shape and relative branch segment lengths and angles are maintained in mutants, thereby preserving wild-type geometry. The major defects, however, arise from a delay in development. The traced ureteric tree is compared with the wild type in Figure 5B. Although the overall shape of the mutant and wild-type growth curves are alike (Figure 5C), the FGF7(−/−) profile (red) lies directly between the E14.5 (blue) and E15.5 (gray) wild-type curves. The age of this mutant is 0.5 days behind the normal trajectory, consistent with a primary developmental delay. Comparable shapes of all curves reflects that relative tree geometries and proportions are maintained in the mutant; the number of glomeruli is reduced by 30%, the volume of the ureteric tree by 25%, and the total number of branch segments (AUC) by 25% in the mutant (P<0.01 for all three). Most notably, the branching rate is significantly reduced, because the average maximum branch order at E15.5 is 12 in the mutant as compared with 15 in the wild type (P<0.01).
These data indicate that the observed decrease in nephron number in FGF7(−/−) arises from a primary loss of developmental time via deceleration in branching rate, a finding that supports a timing function for FGF7. The equivalent decrease in glomerular number suggests that each tip, although late in appearing, is equally potent in inducing nephrons.
Vitamin A Deficiency
Kidney development requires normal retinoid levels and low fetal vitamin A status is associated with decreased human kidney size and nephron number.19 To examine branching effects, we used a previously published protocol to induce vitamin A deficiency in rats to levels compatible with gestation.20 Animals were maintained on a low vitamin A diet for 3 weeks before mating then throughout pregnancy. At E15.5, we found that despite significant growth impairment, normal branching rate is maintained (Figure 5, B and C). Although tree volume is decreased by 32% (P<0.01), there is no significant difference in the total number of branch segments (AUC) and in branching rate compared with the wild type. However, maximum branching order increases from 15 to 18 (P<0.05) accompanied by a change in shape of the normal growth profile (Figure 5C). The initial curve shows that stereotyped binary branching is diminished to four generations compared with seven in the wild type (P<0.05), indicating a significant shift toward increased pattern variation.
Most importantly, despite maintenance of normal branching rate and segment number, glomerular count is decreased by 55% (P=0.002) (consistent with animal studies19,21). Impaired ability of each tip to induce glomeruli is possibly due to retinoid-dependent signals that act directly on the UB or, based on reciprocal molecular signaling, indirectly via the stroma and MM.20,22,23 Such effects also might contribute to increased variability in branching pattern.
Protein Deficiency
Protein deficiency is known to adversely affect kidney size.24 Starvation during midgestation in humans resulted in low birth weight (a marker for low nephron number) and increased risk of proteinuria in adults.1,25 We placed animals on a low protein diet for 3 weeks before mating and then during pregnancy and found that E15.5 kidneys from protein-restricted dams have a 50% decrease in total segment number, 75% decrease in glomerular number, and 90% decrease in tree volume (P=0.001, P=0.001, and P<0.001, respectively) (Figure 5, B and C). However, there is no significant difference in the maximum branch order. Although the stereotyped binary branching pattern remains intact over the first 5 orders, there is a marked loss in the sum of branches per order between 7 and 12 (Figure 5C). The tracing (Supplemental Figure 8C) shows that although the origin-to-tip order of branch processes that span the longitudinal axis remain unchanged, there is a directed reduction in maximal order in those that delineate circumference. The latter branch to fewer generations and consequently have a significant reduction in both total length and in pattern variation.
These gross anatomic changes correlate with human ultrasonography studies that detected “sausage-shaped” kidneys of reduced diameter in growth-restricted fetuses.26 The presence of distinct longitudinal and circumferential growth axes during development also has been demonstrated.9 Because the radius of each branch normally tapers with each successive division, the decrease in overall branch order also results in the loss of more finely branched segments (Supplemental Figure 8, A and B). In summary, the generalized insult of protein deficiency affects most, if not all, of the steps that specify branching morphology and complexity, nephron number, growth axes, and organ size.
Discussion
Epidemiologic studies have shown that fetal programming plays a significant role during kidney development and progression of disease later in life.3,4 Here we present a high-resolution map that analyzes the trajectory of normal kidney development throughout gestation. We identify two distinct temporal phases, each characterized by stage-specific morphogenetic mechanisms that guide organogenesis. During the early phase, stereotyped branching divisions occur at maximal rate and construct the core scaffolding. This denotes a vulnerable gestational period when environmental influences can have profound implications on organ structure and nephron number. During the late phase, a marked increase in tip population is accompanied by a significantly reduced branching rate. This relative mismatch prohibits division of each and every tip and comparison of age-matched ureteric trees shows variation in spatial overlap specifically in peripheral branching pattern. As branch and tip numbers multiply during late gestation, this variation became more prominent. The degree of pattern variability seen at E18.5 and E19.5 was based on examination of three specimens each, but loss of stereotyped branching appears much earlier in development. Indeed, this same result also was found in kidneys at E13.5 and older (where more specimens were examined), also suggesting a breakdown of stereotyped pattern. With the caveat that sample size may be small at any one stage, we believe that this level of variation will continue to be observed.
We found that initial stereotyped branching events transition into a stochastic branching process that becomes increasingly dominant during the second half of organogenesis. Short et al. recently concluded that kidney architecture is structurally stereotypic,8 a result that is consistent with our findings during early development. They also noted that when comparing age-matched kidneys between E11.75 and E15.5, the average tree fraction contained within the maximum common subtree was 0.85±0.11 (1 represents perfect overlay). This degree of variability is also consistent with our findings during early organogenesis. Although limitations in resolution using optical projection tomography prohibited their analysis of the complete ureteric tree past E15.5, we were able to study global branching events at later ages. It is during late gestation, notably between E15.5 and E19.5, that we found increasing levels of pattern variation. Natural spatiotemporal variation in lung branching configuration, particularly at later generations, has also been reported.27,28
The map presented here provides a refined quantitative assay that outlines the entire trajectory of intrauterine kidney development. It defines key developmental periods and associated morphogenetic mechanisms that guide organogenesis. Although the genetic program of epithelial branching has not yet been demonstrated, our analysis identifies specific time points that mark transitions between major stages of organogenesis29,30 and may guide further studies. Indeed, evolving global gene expression patterns during kidney development have been shown to mark critical transitions between separable developmental stages.31 Our approach should also be applicable to study other organs that develop via repetitive branching and make tractable rigorous analysis of morphologic events at any age. Although we present a complete map of intrauterine kidney development, it is important to note that in rodents, a significant portion of nephrogenesis continues for a short time after birth and >50% of nephrons form after cessation of branching.8,32 In humans, Oliver discovered that the pattern of branching changes significantly during late nephrogenesis.33 During this period, bifid branching gives way to division of single terminal branches that lead to the formation of many nephrons by lateral branching. Further work may reveal whether the level of variation increases or stabilizes after birth.
We used our normative map as a basis for examining kidneys that developed under three pathologic conditions and identified a spectrum of abnormalities. Our analysis is consistent with previous studies but provides much new insight into specific morphogenetic effects of different insults. Growth is affected in all, but the reduction in glomerular number is condition specific. These developmental perturbations can be attributed to separable morphogenetic processes that include primary developmental delay, defects in nephron induction, changes in growth axis, and alterations in balance between stereotyped and stochastic processes. These produced up to a 3-fold decrease in glomeruli and 2-fold decrease in total branching events. Although the range in human nephron number is even larger, we now have two examples for genetically identical mice and one FGF7 knockout model in which nephron number is significantly variable. Together our findings support the notion that genetic defects and environmental abnormalities such as fetal nutrient delivery modulate final nephron count. The varied response to these different insults suggests existence of a number of definable mechanisms that control organogenesis. Most generally, we believe that our model will facilitate correlation between organ architecture and the genetic mechanisms that regulate underlying developmental pathways.
Concise Methods
The Columbia Institutional Animal Care and Use Committee approved all animal procedures. Embryonic kidneys were obtained from timed C57BL/6 or FGF7 mutant mice (Jackson Laboratories). The morning of plug detection was designated E0.5 and embryos were harvested at noon. To preserve organ structure, intact embryos were fixed with 4% paraformaldehyde, equilibrated in 30% sucrose, snap-frozen in Tissue-Tek OCT compound (Sakura Finetek), and then sectioned to 150 µm using a Leica CM3050S cryostat. Nutrient-deficient diets (Harlan) were initiated 3 weeks before mating and continued throughout gestation; the diets contained trace vitamin A (TD.86143) and 6% protein (TD.90016). The control standard rodent diet contains 24.3% crude protein and 12.6 IU/g vitamin A (TD.8604).
Sections were blocked (PBS, 5% donkey serum, 0.1% Triton X-100) for 1 hour at room temperature, incubated overnight at 4°C in cytokeratin-8 (DSHB) and podocalyxin (R&D Systems) primary antibodies, washed with PBS, and were then incubated with Alexa Fluor secondary antibodies (Invitrogen). Apoptosis was detected with the InSitu Cell Death Detection Kit (Roche) and proliferation with Ki-67 antigen (DAKO). Z-stacks were obtained using a Zeiss LSM510 META scanning confocal microscope (Supplemental Figure 9). Successive stacks were aligned and concatenated with the ImageJ34 Image Layering Toolkit (Supplemental Figure 10A). Reconstructed images were imported into Neurolucida (MBF Bioscience), manually traced, and analyzed (Supplemental Figure 10B).
The number of wild-type kidneys analyzed per day is five for E11.5 (limb stage [ls] 5–7), five for E12.5 (ls8–9), five for E13.5 (ls10), six for E14.5 (ls11), five for E15.5 (ls12), three for E16.5 (ls13), three for E17.5 (ls13), three for E18.5 (ls13), and three for for E19.5 (ls13). Three to seven kidneys were studied for each deficiency. Sex of the embryos was not determined. Data were analyzed by the t test.
The observed daily branching probability was calculated using the following formula:
 |
where ni+1/ni compares fold difference in tip number between days i+1 and i. Day 1 represents comparison of day E11.5 (two tips) to the initial ureteric budding event (n=one tip). Days 2–9 represent subsequent days through E19.5. At each time point, fold change in tips is normalized by the sum of day-to-day fold difference throughout gestation.
Disclosures
None.
Supplementary Material
Acknowledgments
We thank J. Barasch, F. Costantini, B. Levin, A. Monge, and J. Ross for input and comments.
This study was supported by a Research Career Award from the National Institute of Diabetes and Digestive and Kidney Diseases (K08-DK078014) and a Carl W. Gottschalk Research Scholar Grant from the American Society of Nephrology (both to R.V.S.).
Footnotes
Published online ahead of print. Publication date available at www.jasn.org.
This article contains supplemental material online at http://jasn.asnjournals.org/lookup/suppl/doi:10.1681/ASN.2014090886/-/DCSupplemental.
References
- 1.Luyckx VA, Bertram JF, Brenner BM, Fall C, Hoy WE, Ozanne SE, Vikse BE: Effect of fetal and child health on kidney development and long-term risk of hypertension and kidney disease. Lancet 382: 273–283, 2013 [DOI] [PubMed] [Google Scholar]
- 2.Bagby SP: Developmental origins of renal disease: Should nephron protection begin at birth? Clin J Am Soc Nephrol 4: 10–13, 2009 [DOI] [PubMed] [Google Scholar]
- 3.Brenner BM, Garcia DL, Anderson S: Glomeruli and blood pressure. Less of one, more the other? Am J Hypertens 1: 335–347, 1988 [DOI] [PubMed] [Google Scholar]
- 4.Barker DJ, Bull AR, Osmond C, Simmonds SJ: Fetal and placental size and risk of hypertension in adult life. BMJ 301: 259–262, 1990 [DOI] [PMC free article] [PubMed] [Google Scholar]
- 5.Puelles VG, Hoy WE, Hughson MD, Diouf B, Douglas-Denton RN, Bertram JF: Glomerular number and size variability and risk for kidney disease. Curr Opin Nephrol Hypertens 20: 7–15, 2011 [DOI] [PubMed] [Google Scholar]
- 6.Hoy WE, Ingelfinger JR, Hallan S, Hughson MD, Mott SA, Bertram JF: The early development of the kidney and implications for future health. J Dev Orig Health Dis 1: 216–233, 2010 [DOI] [PubMed] [Google Scholar]
- 7.Metzger RJ, Klein OD, Martin GR, Krasnow MA: The branching programme of mouse lung development. Nature 453: 745–750, 2008 [DOI] [PMC free article] [PubMed] [Google Scholar]
- 8.Short KM, Combes AN, Lefevre J, Ju AL, Georgas KM, Lamberton T, Cairncross O, Rumballe BA, McMahon AP, Hamilton NA, Smyth IM, Little MH: Global quantification of tissue dynamics in the developing mouse kidney. Dev Cell 29: 188–202, 2014 [DOI] [PubMed] [Google Scholar]
- 9.Cebrián C, Borodo K, Charles N, Herzlinger DA: Morphometric index of the developing murine kidney. Dev Dyn 231: 601–608, 2004 [DOI] [PubMed] [Google Scholar]
- 10.Roseboom T, de Rooij S, Painter R: The Dutch famine and its long-term consequences for adult health. Early Hum Dev 82: 485–491, 2006 [DOI] [PubMed] [Google Scholar]
- 11.Schulz LC: The Dutch Hunger Winter and the developmental origins of health and disease. Proc Natl Acad Sci U S A 107: 16757–16758, 2010 [DOI] [PMC free article] [PubMed] [Google Scholar]
- 12.Watanabe T, Costantini F: Real-time analysis of ureteric bud branching morphogenesis in vitro. Dev Biol 271: 98–108, 2004 [DOI] [PubMed] [Google Scholar]
- 13.Rosen KH: Graph Theory and Its Applications, Boca Raton, FL, Chapman and Hall/CRC Press, 2006 [Google Scholar]
- 14.Jennette JC, Olson JL, Schwartz MM, Silva FG: Heptinstall’s Pathology of the Kidney, Philadelphia, Lippincott Williams and Wilkins, 2007 [Google Scholar]
- 15.Airik R, Kispert A: Down the tube of obstructive nephropathies: The importance of tissue interactions during ureter development. Kidney Int 72: 1459–1467, 2007 [DOI] [PubMed] [Google Scholar]
- 16.Schoenwolf GC, Bleyl SB, Brauer PR, Francis-West PH: Larsen’s Human Embryology, Philadelphia, Churchill Livingstone/Elsevier, 2008 [Google Scholar]
- 17.Qiao J, Uzzo R, Obara-Ishihara T, Degenstein L, Fuchs E, Herzlinger D: FGF-7 modulates ureteric bud growth and nephron number in the developing kidney. Development 126: 547–554, 1999 [DOI] [PubMed] [Google Scholar]
- 18.Qiao J, Bush KT, Steer DL, Stuart RO, Sakurai H, Wachsman W, Nigam SK: Multiple fibroblast growth factors support growth of the ureteric bud but have different effects on branching morphogenesis. Mech Dev 109: 123–135, 2001 [DOI] [PubMed] [Google Scholar]
- 19.Merlet-Bénichou C: Influence of fetal environment on kidney development. Int J Dev Biol 43: 453–456, 1999 [PubMed] [Google Scholar]
- 20.Lelièvre-Pégorier M, Vilar J, Ferrier ML, Moreau E, Freund N, Gilbert T, Merlet-Bénichou C: Mild vitamin A deficiency leads to inborn nephron deficit in the rat. Kidney Int 54: 1455–1462, 1998 [DOI] [PubMed] [Google Scholar]
- 21.Moreau E, Vilar J, Lelièvre-Pégorier M, Merlet-Bénichou C, Gilbert T: Regulation of c-ret expression by retinoic acid in rat metanephros: Implication in nephron mass control. Am J Physiol 275: F938–F945, 1998 [DOI] [PubMed] [Google Scholar]
- 22.Batourina E, Gim S, Bello N, Shy M, Clagett-Dame M, Srinivas S, Costantini F, Mendelsohn C: Vitamin A controls epithelial/mesenchymal interactions through Ret expression. Nat Genet 27: 74–78, 2001 [DOI] [PubMed] [Google Scholar]
- 23.Rosselot C, Spraggon L, Chia I, Batourina E, Riccio P, Lu B, Niederreither K, Dolle P, Duester G, Chambon P, Costantini F, Gilbert T, Molotkov A, Mendelsohn C: Non-cell-autonomous retinoid signaling is crucial for renal development. Development 137: 283–292, 2010 [DOI] [PMC free article] [PubMed] [Google Scholar]
- 24.Moritz KM, Singh RR, Probyn ME, Denton KM: Developmental programming of a reduced nephron endowment: More than just a baby’s birth weight. Am J Physiol Renal Physiol 296: F1–F9, 2009 [DOI] [PubMed] [Google Scholar]
- 25.Bertram JF, Douglas-Denton RN, Diouf B, Hughson MD, Hoy WE: Human nephron number: Implications for health and disease. Pediatr Nephrol 26: 1529–1533, 2011 [DOI] [PubMed] [Google Scholar]
- 26.Konje JC, Okaro CI, Bell SC, de Chazal R, Taylor DJ: A cross-sectional study of changes in fetal renal size with gestation in appropriate- and small-for-gestational-age fetuses. Ultrasound Obstet Gynecol 10: 22–26, 1997 [DOI] [PubMed] [Google Scholar]
- 27.Boyden EA: A synthesis of the prevailing patterns of the bronchopulmonary segments in the light of their variations. Dis Chest 15: 657–668, 1949 [DOI] [PubMed] [Google Scholar]
- 28.Blanc P, Coste K, Pouchin P, Azaïs JM, Blanchon L, Gallot D, Sapin V: A role for mesenchyme dynamics in mouse lung branching morphogenesis. PLoS ONE 7: e41643, 2012 [DOI] [PMC free article] [PubMed] [Google Scholar]
- 29.Shah MM, Sampogna RV, Sakurai H, Bush KT, Nigam SK: Branching morphogenesis and kidney disease. Development 131: 1449–1462, 2004 [DOI] [PubMed] [Google Scholar]
- 30.Nigam SK, Shah MM: How does the ureteric bud branch? J Am Soc Nephrol 20: 1465–1469, 2009 [DOI] [PubMed] [Google Scholar]
- 31.Tsigelny IF, Kouznetsova VL, Sweeney DE, Wu W, Bush KT, Nigam SK: Analysis of metagene portraits reveals distinct transitions during kidney organogenesis. Sci Signal 1: ra16, 2008 [DOI] [PMC free article] [PubMed] [Google Scholar]
- 32.Rumballe BA, Georgas KM, Combes AN, Ju AL, Gilbert T, Little MH: Nephron formation adopts a novel spatial topology at cessation of nephrogenesis. Dev Biol 360: 110–122, 2011 [DOI] [PMC free article] [PubMed] [Google Scholar]
- 33.Oliver J: Nephrons and Kidneys: A Quantitative Study of Developmental and Evolutionary Renal Architectonics, New York, Hoeber Medical Division, Harper & Row, 1968 [Google Scholar]
- 34.Schneider CA, Rasband WS, Eliceiri KW: NIH Image to ImageJ: 25 years of image analysis. Nat Methods 9: 671–675, 2012 [DOI] [PMC free article] [PubMed] [Google Scholar]
Associated Data
This section collects any data citations, data availability statements, or supplementary materials included in this article.