Abstract
Background
Altered gut microbiome is associated with systemic inflammation and cirrhosis decompensation. However, the correlation of the oral microbiome with inflammation in cirrhosis is unclear.
Aim
Evaluate the oral microbiome in cirrhosis and compare with stool microbiome.
Methods
Cirrhotic outpatients [with/without hepatic encephalopathy (HE)] and controls underwent stool/saliva microbiome analysis (for composition and function) and also systemic inflammatory evaluation. 90-day liver-related hospitalizations were recorded. Salivary inflammation was studied using Th1 cytokines/secretory IgA, histatins and lysozyme in a subsequent group.
Results
102 cirrhotics (43 prior-HE) and 32 age-matched controls were included. On PCO, stool and saliva microbiome clustered far apart showing differences between sites as a whole.
Salivary microbiome
With prior-HE, relative abundance of autochthonous families decreased while potentially pathogenic ones (Enterobacteriaceae, Enterococcaceae) increased in saliva. Endotoxin-related predicted functions were significantly higher in cirrhotic saliva.
Stool microbiome
Relative autochthonous taxa abundance reduced in prior-HE, along with increased Enterobacteriaceae and Enterococcaceae. Cirrhotic stool microbiota demonstrated a significantly higher correlation with systemic inflammation compared to saliva microbiota on correlation networks.
Outcomes
38 patients were hospitalized within 90 days. Their salivary dysbiosis was significantly worse and predicted this outcome independent of cirrhosis severity.
Salivary inflammation
was studied in an additional 86 age-matched subjects (43 controls/43 cirrhotics); significantly higher IL-6/IL-1β, secretory IgA and lower lysozyme, and histatins 1 and 5 were found in cirrhotics compared to controls.
Conclusions
Dysbiosis, represented by reduction in autochthonous bacteria, is present in both saliva and stool in cirrhosis patients compared to controls. Cirrhotic patients have impaired salivary defenses and worse inflammation. Salivary dysbiosis was greater in cirrhotics who developed 90-day hospitalizations. These findings could represent a global mucosal-immune interface change in cirrhosis.
Keywords: hepatic encephalopathy, dysbiosis, inflammation, hospitalization, outcomes
Cirrhosis is associated with a pro-inflammatory milieu that can potentiate disease progression and complications such as hepatic encephalopathy (HE) and infections(1). Dysbiosis or altered gut microbiota, due to decreased autochthonous or commensal taxa, has been found in stool and colonic mucosa in cirrhotic patients, which is in turn linked with disease severity and systemic inflammation (2-4). It is not clear however, whether this dysbiosis-inflammatory state exists only in the gut or is a generalized phenomenon in cirrhosis. The salivary microbiome has been studied in healthy individuals as part of the Human Microbiome project but not directly in cirrhosis(5). While Qin et al and our prior studies have shown that microbes presumed to be of oral origin could be present in stool, the direct evaluation of the oral microbiome has not been performed in cirrhosis(6, 7). Cirrhotics are also predisposed to periodontal infections, which necessitates a dental examination before liver transplant listing(8, 9). The study of salivary defenses is important in establishing a global microbiota-immune change as salivary microbiome could influence the distal gut microbiome(7, 10). Also if similarities were noted between stool and salivary microbiota, since saliva is easier to collect compared to stool or mucosal biopsies, this would greatly increase the ease of subject participation in microbiota research. Our aim was to analyze the salivary microbiome composition and function in cirrhotic patients with and without HE, study their linkage with stool microbiota and outcomes and also to analyze the impact of cirrhosis on salivary defenses and oral inflammatory response.
METHODS
The study was conducted in two parts: the first was a microbiota-inflammatory milieu analysis of the stool, saliva and systemic circulation, while the second was the evaluation of salivary inflammatory response.
Cirrhotic outpatients diagnosed by histology, radiologic evidence of cirrhosis or endoscopic evidence of varices in the setting of chronic liver disease were recruited prospectively. Since the focus was HE, we divided patients into those with and without prior-HE as defined by at least one hospitalization for overt HE within the last year that was currently controlled as an outpatient on lactulose and/or rifaximin. We compared prior HE patients to a compensated age-matched cohort (without HE, ascites, variceal bleeding) that was termed no-HE. A group of age-matched healthy controls without chronic diseases were also recruited. A careful smoking history was taken from all groups and an oral examination was performed in addition to review of the dental records within six months. We excluded patients on absorbable antibiotics, tobacco, alcohol or illicit drug use within 3 months, TIPS, periodontal/gingival disease undergoing treatment or edentulous patients.
The dietary history for the day prior to stool sampling was recorded using recall. All subjects underwent serum, stool and saliva collection the same day. For the saliva collection, all subjects were asked to rinse their mouth with normal saline using published protocols in presence of the coordinator(11). This rinse was discarded and the saliva collected after that was collected and flash-frozen. Serum endotoxin was evaluated using published Limulus Amebocyte Lysate gel-clot techniques while inflammatory cytokines (IL-6, IL-2, IL-1β, IL-4, IL-10, TNF-α, IFN-γ) were analyzed using ELISA (Assaygate, Ijamsville, MD)(12). Patients were then followed for 90 days for their first hospitalization due to liver-associated conditions or infections (HE, infections, fluid/electrolyte issues, GI bleeding).
Additional subset for salivary inflammation analysis
We subsequently recruited an additional group of age-matched healthy controls and cirrhotics in a case-control based approach (with identical inclusion/exclusion criteria as above), that underwent analysis of saliva for IL-6, IL-1β, histatin 1, 3 and 5, lysozyme and secretory IgA.
Statistical analysis
Stool and salivary microbial DNA was extracted, which was analyzed using published multi-tagged pyrosequencing techniques (Supplementary section) (13). The microbiota results were analyzed using Metastats, standard non-parametric tests (Kruskal-Wallis test) and UNIFRAC QIIME principle component(PCO) analyses(14) with multiple comparison adjustments. Functionality of the microbiota was assessed using PiCRUST(Phylogenetic Investigation of Communities by Reconstruction of Unobserved States)(15) and results compared between groups (16).
We compared controls with cirrhotics and those with/without prior-HE using ANOVA and Kruskal-Wallis tests. Based on prior studies, the MTPS results were expressed as relative abundances between groups and compared for saliva and stool between groups. Correlation networks were created between microbiota and inflammatory cytokines for saliva and stool separately. Differences in correlations were evaluated and visualized using Cytoscape(17, 18). We compared dysbiosis ratios created separately for stool and saliva within the cirrhosis group. In order to account for potential baseline differences between those who were hospitalized, a univariate and multi-variable logistic regression with disease severity indices, age, diabetes and salivary dysbiosis ratio was performed. In addition a sensitivity analysis for outcome prediction using the dysbiosis ratio alone and with other significant variables was performed using ROC curves using the Youden index.
RESULTS
Initial study of the microbiota-inflammatory analysis
We considered 167 cirrhotics; eleven were edentulous, fifteen had current periodontitis/gingival disease or were undergoing dental treatment, 13 were using alcohol/illicit drugs and 26 refused participation. We ultimately enrolled 102 cirrhotics. We also enrolled 32 age-matched healthy controls without any chronic systemic or oral diseases (age 54±5 years, 21 men, median daily calories 2201±124). None of the controls were on proton pump inhibitors. There was no significant difference in the tobacco use between controls [18 never used tobacco, 14 had a remote history (>3 months ago) with none current users] and cirrhotics (56 never used, 46 remote use and none current users). Review of the dental history and oral examination did not reveal active gingival or periodontal disease in any of the included subjects. The leading etiologies of cirrhosis were HCV (47%), alcohol alone (17%), alcohol+HCV (21%) and NASH (16%). Most subjects were Caucasian (53%) followed by African-American (43%) and Hispanic (4%). Eight-five percent of subjects were men. Forty-two percent of cirrhotics had prior-HE [median HE episodes: 1 (range 1-5), last HE episode: median 3 months prior (range 2-11 months)] prior to sample collection. All prior-HE patients were alert and oriented with a mini-mental status exam of >25, and were able to give informed consent. These patients were adherent on lactulose and 24% were on additional rifaximin; both medications were prescribed for at least 2 months. Patients on rifaximin had a non-significant trend towards a higher MELD score (18±10 vs. 16±7, p=0.09). Prior-HE patients had a higher MELD score with evidence of a systemic pro-inflammatory milieu and endotoxemia compared to no-HE patients (table 1). None of the prior-HE patients were on antibiotics, the patients with ascites were controlled on diuretics and four patients had prior variceal bleeding more than 1 year prior with obliterated varices at the time of sample collection. The no-HE patients had no ascites determined by imaging and physical examination, were not on any antibiotics for any current/past infections and did not have a history of variceal bleeding.
Table 1.
Comparison between prior HE and no-HE patients
| No-HE (n=59) | Prior HE (n=43) | |
|---|---|---|
| Age (years) | 54±13 | 56±16 |
| Gender (Men/Women) | 50/9 | 34/9 |
| Tobacco use (none /remote/ current) | 35/24/0 | 21/22/0 |
| Use of proton pump inhibitors (%) | 21 (35.6%) | 19 (44.2%) |
| Type 2 diabetes | 16 (27.1%) | 15 (34.9%) |
| Etiology (HCV, alcohol, HCV+Alcohol, NASH, others) | 27/14/7/7/4 | 20/6/9/7/1 |
| Calories in the past day (mean±SD) | 2304±732 | 2245±920 |
| MELD score(mean±SD)*** | 8.6±2.5 | 17.2±7.2 |
| Child-Pugh score (mean±SD)*** | 6.2±5.1 | 9.7±4.4 |
| Serum Albumin (mg/dl, mean ±SD)*** | 3.5±1.7 | 3.3±1.1 |
| Ascites (%)** | 0 | 16 (37%) |
| IL-6 pg/ml (median, IQR)** | 2.4 (8.3) | 4.5 (33.5) |
| IL-2 pg/ml (median, IQR)** | 0.0 (3.0) | 1.9 (10.4) |
| IL-1beta pg/ml (median, IQR)* | 0.0 (1.8) | 0.7 (8.4) |
| IL-4 pg/ml (median, IQR) | 0.6 (2.3) | 0.6 (15.5) |
| TNF-α pg/ml (median, IQR)** | 4.2 (2.7) | 5.4 (10.8) |
| IFN-γ pg/ml (median, IQR)* | 0.9 (10.5) | 0.5 (3.2) |
| IL-10 pg/ml (median, IQR) | 1.9 (6.2) | 1.6 (6.0) |
| Endotoxin EU/ml (mean±SD)** | 0.05±0.01 | 0.34±0.21 |
p<0.001
p<0.01
p<0.05
Prior-HE patients had a significantly worse systemic inflammation compared to patients without HE.
Outcomes
within 90 days, 38 patients required a hospitalization for liver-related conditions a median of 39 days (range 12-85 days) after sample collection. None of the patients were started on antibiotics, HE therapy or underwent non-liver-related hospitalizations between enrollment and this hospitalization. Those who were hospitalized had a higher MELD score (15.6±8.4 vs. 10.6±4.8, p=0.003) and included a higher proportion of prior-HE (67% vs. 45%, p=0.001) at the time of sample collection compared to those were free of hospitalization. Twelve hospitalizations were due to HE without infection (dyselectrolytemia in 5, lactulose non-compliance 6, one spontaneous), 4 for HE with infection (3 SBP/spontaneous bacteremia, 1 pneumonia), 6 additional patients were admitted for infections without HE (4 SBP/spontaneous bacteremia, 2 UTI), 16 for other liver issues (9 fluid/electrolyte management, 3 variceal bleeding, 1 peptic ulcer bleeding and 3 hepatic hydrothorax). Median time to the hospitalization was not significantly different between HE/infections vs. other liver-related conditions (36 vs. 42 days, p=0.5)
Overall microbiome analysis
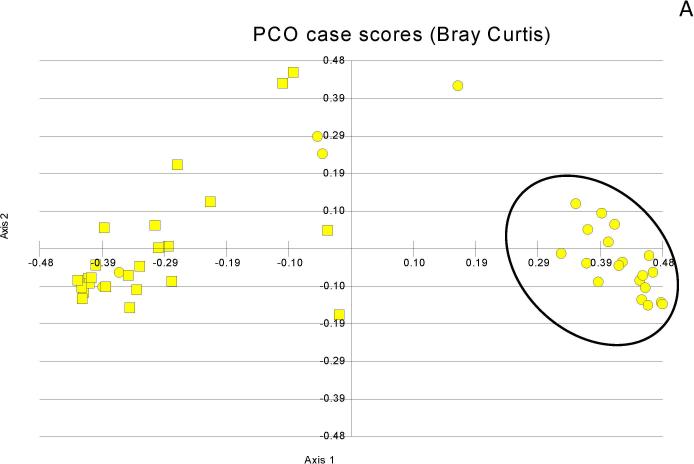
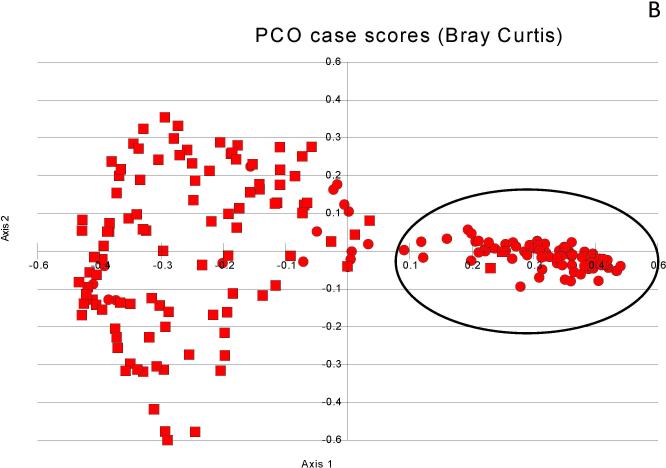
The specific families differing between cirrhotics and controls are shown in table 2. When clustering of the microbiota within groups was performed, stool and saliva clustered separately in cirrhotic patients as well as in controls demonstrating that the microbiota in the saliva is significantly different from the stool, regardless of the presence of cirrhosis (Figures 1A/B).
Table 2.
Median relative abundances of bacterial families between groups
| Bacterial Family | Saliva | Stool | ||||
|---|---|---|---|---|---|---|
| Controls | No-HE | HE | Controls | No-HE | HE | |
| Clostridiales XIV‡ | 7.8% | 5.6% | 2.7%* | 9.2% | 6.6% | 4.5%* |
| Lachnospiraceae ‡ | 20.2% | 15.0% | 9.5%* | 27.0% | 21.3% | 16.0%* |
| Ruminococcaceae ‡ | 7.0% | 4.9% | 3.7%* | 13.4% | 8.7% | 7.4%* |
| Fusobacteriaceae | 0.0% | 1.6% | 1.6%† | 0.0% | 0.0% | 1.0% |
| Prevotellaceae | 4.2% | 7.3% | 7.4%† | 5.4% | 5.3% | 5.0% |
| Enterococcaceae | 0.0% | 2.5% | 3.1%† | 0.0% | 0.0% | 1.0% |
| Enterobacteriaceae | 2.2% | 5.5% | 5.8%† | 0.0% | 3.0% | 3.1%† |
| Erysipelotrichaceae | 3.5% | 1.2% | 1.3%† | 5.3% | 1.9% | 0.6%* |
| Bacteroidaceae | 3.4% | 3.8% | 4.6% | 19.9% | 24.5% | 24.9% |
| Streptococcacae | 33.0% | 29.1% | 33.3% | 2.4% | 4.4% | 1.9% |
autochthonous taxa
significant differences between controls and cirrhotic patients but no difference within HE and no-HE patients
significant differences between controls, HE and no-HE patients.
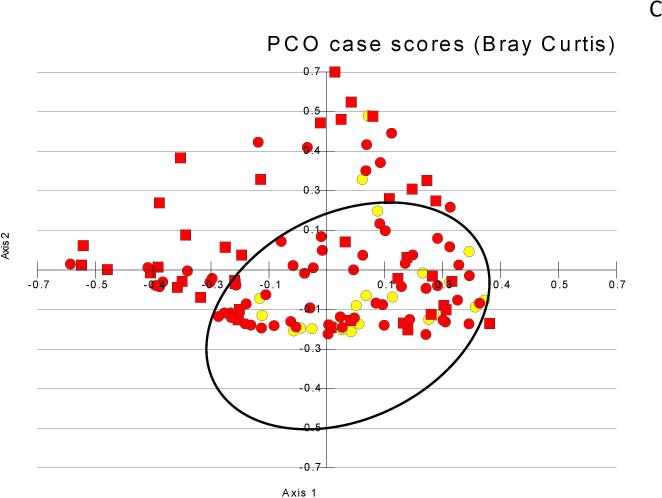
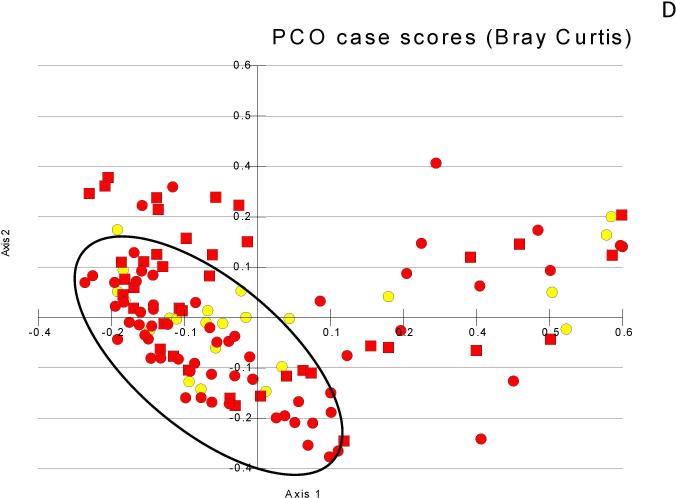
Figure 1. Principal component analyses of microbiota change.
Figure 1A: Salivary microbiota (black oval) cluster far apart from the stool in controls (squares=stool, circles=saliva)
Figure 1B: Salivary microbiota (black oval) cluster far apart from the stool in cirrhosis (squares=stool, circles=saliva)
Figure 1C: Stool microbiota showing clustering of control and no-HE (black oval) compared to those with prior-HE that is not as apparent as between the control/cirrhosis comparisons (yellow circles=control, red circles=no-HE, red squares= prior-HE)
Figure 1D: Salivary microbiota showing clustering of control and no-HE (black oval) compared to those with prior-HE that is not as apparent as between the control/cirrhosis comparisons (yellow circles=control, red circles=no-HE, red squares= prior-HE)
Stool microbiome
Cirrhotics had a significantly lower relative abundance of autochthonous taxa (Lachnospiraceae, Ruminococcaceae and Clostridiales XIV)(2) compared to controls and this was further reduced in prior-HE versus no-HE patients. The cirrhosis dysbiosis ratio(3) (Lachnospiraceae+ Ruminococcaceae+ Clostridiales Incertae Sedis XIV +Veillonelllaceae/Enterobacteriaceae + Bacteroidaceae) was significantly lower (indicates dysbiosis) in cirrhotics compared to controls (3.4±6 vs.6.7±9, p=0.03) and significantly worse in prior HE (prior HE 2.0±3.3, no-HE 4.4±6, p=0.04). The predominant enterotype was Bacteroides, although as shown above, Ruminococcus was significantly lower in prior-HE cirrhotics (supplementary fig 1)(19). On PCO the clustering of the stool microbiota between controls and cirrhotics were not as marked as between site differences (Figure 1C).
Salivary microbiome
The salivary microbiome in controls and cirrhotics showed significant differences, which was accentuated in prior-HE. We found that the relative abundance of Streptococcaceae in the saliva was significantly higher than that in the stool in both groups. There was a reduction in autochthonous taxa even in the saliva in cirrhotics, especially in prior-HE. Given the different composition of microbiota in the saliva, we created a salivary microbiota ratio (Lachnospiraceae+ Ruminococcaceae+ Clostridiales Incertae Sedis XIV / Streptococcaceae) which was significantly lower (indicates dysbiosis) in cirrhotics compared to controls (2.0±6 vs.0.4±1.0, p=0.04); although changes within the cirrhosis group using this ratio were not significant (prior HE 0.34±0.9 vs. no-HE 0.45±1.0, p=0.6). There was relatively weak clustering between controls compared to cirrhotic patients on PCO (Figure 1D).
There was no additional change in dysbiosis (represented by changes in dysbiosis ratios) in prior-HE patients with or without ascites either the stool (ascites 2.7±3.6 vs. no ascites 2.9±4.1, p=0.44) or salivary microbiota (0.29±1.2 vs. 0.34±0.92, p=0.44). A similar lack of effect was seen those with/without rifaximin on saliva (0.41±1.3 vs. 0.37±0.9, p=0.6) or stool (2.7±2.9 vs. 2.9±6.7, p=0.43). We did not find a significant change in those with or without diabetes on the salivary dysbiosis ratio (diabetes 0.43±0.81 vs. 0.37±1.0, p=0.38) and a trend towards decreased dysbiosis on the stool dysbiosis ratio (diabetes 5.9±8.7 vs. 3.4±6.2, p=0.08). A non-significant pattern was also seen for PPI use in saliva (PPI 0.56±0.75 vs. 0.53±1.01, p=0.57) or stool dysbiosis ratios (PPI 3.9±7.3 vs. 4.2±9.1, p=0.43).
Predicted Microbial function results
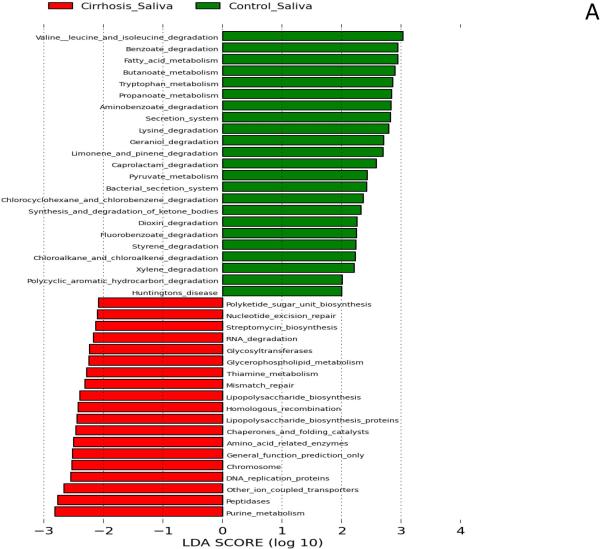
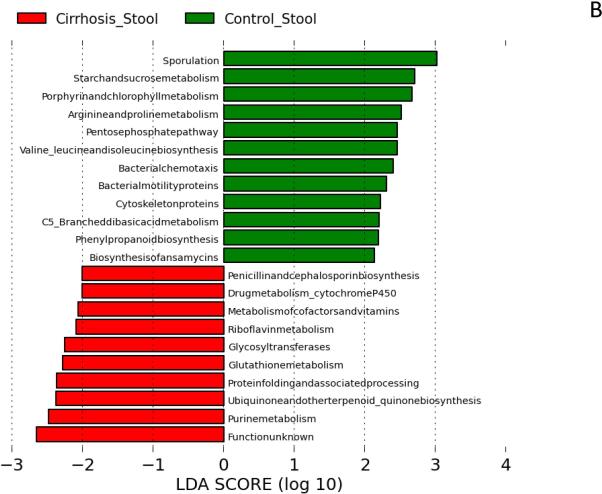
We found significant changes in bacterial functionality in saliva and stool between cirrhotics and controls. Microbiota with greater relative abundance in cirrhotics’ saliva had functions related to endotoxin and endotoxin-protein biosynthesis and purine/nucleotide metabolism. In contrast, those in control saliva were more likely to have functionality related to amino acids, phenolic/benzoate and fatty acid metabolism (Figure 2A). In stool, there was a similar difference with amino acid metabolism, including branched-chain amino acid synthesis and carbohydrate metabolism being more prominent among control microbiota compared to cirrhosis. Microbiota found in cirrhotic stool was likely to have functions related to vitamin and oxidant metabolism, especially related to riboflavin and glutathione (Figure 2B).
Figure 2. Predicted metabolic functions of microbiota in saliva and stool between groups.
LDA score represents log changes in relative gene expression predicted function between groups. Bars in the green indicate higher activity in controls while those in red represent higher activity in cirrhotic saliva or stool.
Figure 2A: Salivary predicted microbiota functional changes in controls is centered on amino-acid and phenolic metabolism while a higher expression of genes related to lipopolysaccharides and purine/pryrimidine metabolism was seen in cirrhotics’ saliva.
Figure 2B: Stool predicted microbiota functional changes showing differences in cirrhotic and control microbiota. There was a higher expression of genes related to vitamins, cofactors and oxidant metabolism in cirrhosis while controls had a significantly higher expression of carbohydrate and amino-acid metabolism.
Correlation differences between groups
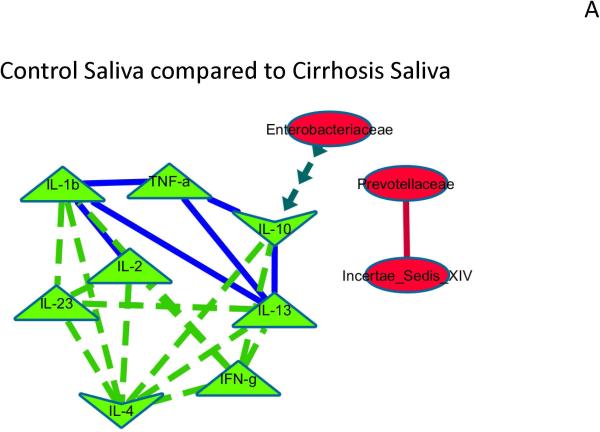
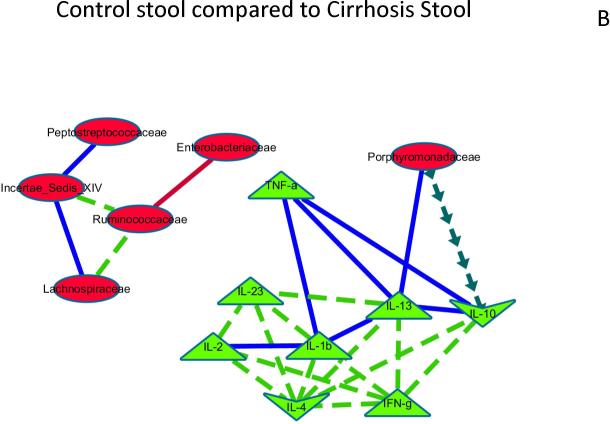
When correlation networks between microbiota and inflammatory cytokines in saliva and stool were compared to each other, significant differences emerged. Control saliva compared to cirrhosis saliva: Th1 inflammatory cytokines were correlated with each other positively in both groups, but more in cirrhotics. In cirrhotics there was a negative correlation between the anti-inflammatory cytokine IL-10 and Enterobacteriaceae (Figure 3A).Control stool compared to cirrhosis stool: similar to saliva, there was higher correlation in cirrhosis within inflammatory cytokines while the autochthonous Ruminococcaceae was more negatively correlated with Enterobacteriaceae in cirrhotics compared to controls. In addition Ruminococcaceae was positively correlated with other autochthonous taxa only in cirrhotics. Porphyromonadaceae was negatively correlated between the anti-inflammatory cytokine IL-10 and positively with IL-13 in cirrhotics (Figure 3B).
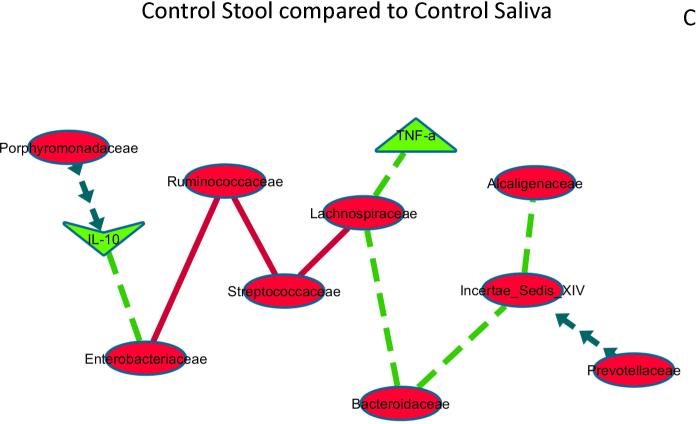
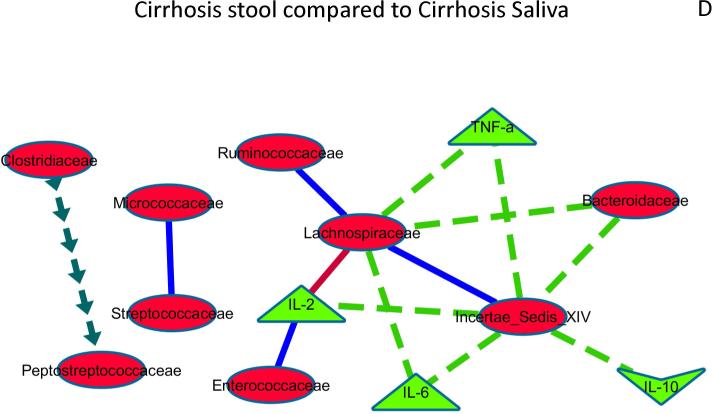
Figure 3. Correlation network differences.
The following figures represent differences between correlations networks created for microbial families and inflammatory cytokines in saliva and stool. In all the subsequent figures, the light green nodes represent systemic inflammatory cytokines while red ones are microbial families. If the correlations are negative in both compared networks, the connecting line is red, if positive in both compared networks it is dark blue, if negative in one and turns to positive in the other, the line is dark green with arrows while if the correlations are positive in one and changes to negative in the other, the line is bright green with dashes.
Figure 3A: Control saliva compared to Cirrhosis Saliva networks.
The correlation network of salivary microbiota and inflammation and a similar network in cirrhotic saliva was compared to evaluate differences that were p<0.001 and r>0.6 or <−0.6. Relationships between microbiota and inflammatory markers that were different are shown and explained below.
Negative correlations in cirrhosis and controls both but more significant in cirrhosis: Between Incertae sedis XIV and Prevotellaceae, Negative/no correlation in control saliva but positive correlation in cirrhosis: inflammatory cytokines with each other, Positive/no correlation in control saliva but negative correlation in cirrhosis: Enterobacteriaceae with IL-10. This shows that cirrhosis saliva has more robust changes with systemic inflammation and within bacteria in the saliva compared to controls.
Figure 3B: Control stool compared to Cirrhosis stool
The correlation network of control stool microbiota and inflammation and a similar network in cirrhotic stool was compared to evaluate differences that were p<0.001 and r>0.6 or <−0.6. Relationships between microbiota and inflammatory markers that were different are shown and explained below.
Negative correlations in cirrhosis and controls both but more significant in cirrhosis: Enterobacteriaceae and Ruminococcaceae, Positive in both groups but more in cirrhosis: Incertae sedis XIV and Peptostreptococcaceae, Porphyromonadaceae with IL-13. Negative/no correlation in control stool but positive correlation in cirrhosis: inflammatory cytokines with each other, Incertae sedis XIV with Ruminococcaceae and Lachnospiraceae, Positive/no correlation in control stool but negative correlation in cirrhosis: Porphyromonadaceae with IL-10. The results demonstrate a higher correlation intensity in cirrhosis stool between autochthonous families and between non-autochthonous families and systemic inflammation.
Figure 3C: Control stool compared to Control saliva
The correlation network of control stool microbiota and inflammation and to control saliva microbiota and inflammation was compared to evaluate differences that were p<0.001 and r>0.6 or <−0.6. Relationships between microbiota and inflammatory markers that were changed significantly are shown and explained below.
Negative in both control saliva and stool, but stronger negativity in saliva: Streptococcaceae with Ruminococcaceae and Lachnospiraceae Negative in both control saliva and stool but stronger negative correlation in stool: Enterobacteriaceae with Ruminococcaceae Negative in control stool without significant relationship/positive in control saliva: autochthonous taxa with Bacteroidaceae, Alcaligenaceae and with inflammatory cytokines Positive in control stool without significant relationship/negative in control saliva: Porphyromonadaceae and IL-10, Prevotellaceae and Incertae sedis XIV. These results show that the strength of most correlations between microbial families (positive or negative) is higher in stool compared to saliva even within the same control group.
Figure 3D: Cirrhosis stool compared to Cirrhosis saliva
The correlation network of cirrhosis stool microbiota and inflammation and to cirrhosis saliva microbiota and inflammation was compared to evaluate differences that were p<0.001 and r>0.6 or <−0.6. Relationships between microbiota and inflammatory markers that were changed significantly are shown and explained below.
Positive in both cirrhosis saliva and stool but stronger positivity in saliva: Micrococcaceae and Streptococcaceae Positive in both cirrhosis saliva and stool but stronger positivity in stool: Enterococcaceae with IL-2, Autochthonous taxa with each other. Negative in both cirrhosis saliva and stool but stronger negative correlation in saliva: Lachnospiraceae with IL-2 Negative in cirrhosis stool without significant relationship/positive correlation in cirrhosis saliva: autochthonous taxa with Bacteroidaceae and with inflammatory cytokines, Positive in cirrhosis stool without significant relationship/negative correlation in saliva: Clostridiaceae with Peptostreptococcaceae. These results show that within the cirrhosis group, salivary correlations of autochthonous families and systemic inflammation and between predominant salivary microbes (Streptococaceae) were higher than in stool, while relationship with predominantly stool microbiota (Bacteroidaceae) with inflammation was higher in stool.
Correlation differences within groups
Significant differences were also seen when saliva and stool correlation networks were compared within groups. Control stool compared to control saliva: As expected, saliva-predominant taxa such as Streptococcaceae were more negatively correlated with Ruminococcaceae and Lachnospiraceae in saliva than in stool while the reverse was true for Enterobacteriaceae with Ruminococcaceae (Figure 3C).
In control stool autochthonous taxa were negatively correlated with Bacteroidaceae, Alcaligenaceae and with inflammatory cytokines but not in saliva while stool Lachnospiraceae and targets, Porphyromonadaceae and IL-10, Prevotellaceae and Incertae sedis XIV were positively correlated but not in saliva. Cirrhosis stool compared to cirrhosis saliva: Similar to controls, taxa present in a higher abundance in saliva were related to each other more in saliva (positive between Micrococcaceae with Streptococcaceae and negative between Lachnospiraceae with IL-2) compared to stool, while there was a higher correlation in stool with Enterococcaceae with IL-2, and within autochthonous taxa (Figure 3D). In cirrhotics, there were several relationships that were found in stool that were not significant in saliva. Negative stool-only correlations were autochthonous taxa with Bacteroidaceae and with inflammatory cytokines while positive stool-only correlations were Clostridiaceae with Peptostreptococcaceae.
Outcome and microbiota changes
we found a significantly higher dysbiosis i.e. a lower stool dysbiosis ratio (5.5±8.3 vs. 2.9±4.6, p=0.04) and lower salivary dysbiosis ratio (0.15±0.24 vs. 0.52±1.2, p=0.016) in those that were hospitalized compared to those who remained free of hospitalization at 90 days. There was a non-significant trend towards worse dysbiosis in the patients admitted due to HE/infections compared to others in saliva (0.09±0.15 vs. 0.22±0.3, p=0.08) and stool (2.1±2.4 vs. ±4.1 vs. 7.2, p=0.12). Given the differences in baseline in disease severity between those who with/without 90-day hospitalizations, we fit an univariate binary logistic regression model with age, diabetes, MELD score, HE or no-HE and the salivary dysbiosis ratio as predictors of 90-day hospitalization. The variables significant on univariate analysis were HE (OR 4.7, 95%CI 1.93-12.1, p=0.006), MELD (OR 1.12, 95%CI: 1.05-1.22) and salivary dysbiosis ratio (OR 0.4, 95%CI 0.00-0.95, p=0.03). Once adjusted for salivary dysbiosis and HE, MELD score was not an independent predictor of 90 day hospitalization. We then fit a second multivariable logistic model that included only HE and salivary dysbiosis, which showed both variables to be independent significant predictors of 90-day hospitalization (HE OR 4.4, 95%CI 1.7-11.5, p=0.001 and salivary dysbiosis ratio OR: 0.5 95%CI 0.1-0.9, p=0.04). A further sensitivity analysis was performed using salivary dysbiosis alone; a value >0.18 had a AUC of only 0.59 however, the sensitivity was 84% with specificity of 36% for 90-day hospitalizations. When the second independent variable, HE was added to this the threshold of the probability equation [−1.27+1.48 (HE yes/no)−0.78 (Salivary dysbiosis ratio)] above which hospitalizations were predicted was >0.44 with a 0.72 AUC, 67% sensitivity and 73% specificity.
Salivary Inflammatory Analysis
Given these changes in salivary microbiota, we subsequently enrolled an age-matched group of cirrhotic patients and healthy controls (n=43 each, Table 3) to study the inflammatory milieu in the saliva. All subjects fulfilled the same inclusion/exclusion criteria as the microbiome analysis study. None of the controls were on PPIs or had diabetes or other chronic diseases. Of the 43 cirrhotic patients, twenty-one were prior-HE [age 56±4 years, MELD 12±3, 67% HCV, 24% Alcoholic cirrhosis, 10 on PPI, 4 with type 2 diabetes, last HE episode median 2 months prior(range 1-11 months)]) and 22 were no-HE(Age 55±6 years, MELD 9±5, 55% HCV, 32% Alcoholic cirrhosis, 10 on PPI and 6 with type 2 diabetes). All HE patients were on lactulose and 2 were on additional rifaximin. None of these patients had ascites, current alcohol/tobacco use and underwent the same protocol for salivary collection. We found a significantly higher inflammatory response in cirrhotics compared to controls as shown by a significantly higher IL-1β, IL-6 and secretory IgA. Interestingly, this was accompanied by a significant decrease in lysozyme and all histatins except histatin-3 in the cirrhosis group. We did not find a change in all above values in cirrhotic patients with and without HE. No changes were seen in oral inflammatory markers between patients with/without diabetes and with/without PPI.
Table 3.
Comparison between controls and cirrhotic patients on salivary immunological measures (data presented as mean±SEM)
| Controls (n=43) | Cirrhosis (n=43) | |
|---|---|---|
| Age (years) | 53±15 | 57±18 |
| Gender (Men/Women) | 29/14 | 34/9 |
| Tobacco use (none /remote/ current) | 38/5/0 | 31/11/0 |
| Calories in the past day (mean±SD) | 2213±834 | 2109±689 |
| IL-6 (pg/ml)** | 2.9±0.6 | 7.9±1.8 |
| IL-1β (pg/ml)* | 21±10 | 117±40 |
| Secretory IgA (μg/ml)* | 159±48 | 281±26 |
| Lyzozyme (pg/ml)* | 19.2±3.0 | 12.3±2.5 |
| Histatin-1 (μg/ml)* | 12.3±2.0 | 5.7±2.8 |
| Histatin-3 (μg/ml) | 158±12 | 187±18 |
| Histatin-5 (μg/ml)*** | 6.3±0.2 | 5.1±0.1 |
p<0.001
p<0.01
p<0.05
DISCUSSION
The data shows that there is evidence of pervasive immune-microbiota interface change in cirrhotic patients in the saliva which is similar to that found in stool. This widespread dysbiosis in cirrhotic patients’ stool and saliva is associated with inflammation, changes in bacterial defenses and is associated with subsequent liver-related hospitalizations.
As shown in prior studies, there was significant inflammation related to Th1 and Th17 system activation in the systemic circulation in cirrhotics, especially those with prior-HE(20). The microbiota in both saliva and stool were related to the systemic inflammatory milieu although the linkage with stool microbiota was stronger. Our study shows that, as expected, stool and saliva had different microbiota in both controls and cirrhotic patients. The major family in the salivary microbiota was Streptococcaceae while the predominant family in stool was Bacteroidaceae, however neither of these families’ relative abundances was different between cirrhotics and controls in saliva or stool. We confirmed prior analysis that stool dysbiosis was greatest in prior-HE(3). Our study extended this onto saliva in cirrhotic patients with an increase in Enterobacteriaceae and reduction in autochthonous microbiota and Erysipelothricaceae in HE compared to no-HE and controls. We found that a similar clustering between microbiota from controls and no-HE compared to prior-HE patients in saliva and stool. The salivary microbiota showed a significantly higher relative abundance of Prevotellaceae, Fusobacteriaceae and Enterococcaceae in cirrhotics compared to controls. While Prevotellaceae and Fusobacteriaceae contain species that can cause oral and periodontal infections, the increase in Enterococcaceae is intriguing(9). Species of this family have been recently isolated from saliva and root canals of patients(21). However genetic studies suggest that salivary Enterococcus is likely exogenous, and is unrelated to the species that reside in the lower gastrointestinal tract. In prior studies, these organisms are typically cleared from the mouth but can often persist in patients with deficient immune responses, which could be a potential reason for their detection in cirrhotics(22). Although Qin et al and our group's evaluation of acid suppression in cirrhotics have suggested that microbiota of oral origin might be present in the stool through comparisons with a standard microbial database; they did not directly measure salivary microbiota. The presence of these bacteria in the stool in these studies is likely an epiphenomenon of impaired bile and gastric acid output in cirrhosis (6, 7, 23). Our results are novel because they directly measure bacterial presence in the saliva of cirrhotics and then relate them to stool bacteria.
This similar trend also continued when changes in salivary microbiota were associated with liver-related hospitalizations over the next 90 days. This builds upon a prior study that showed the stool microbiota can predict 30-day outcomes in infected cirrhotic patients and extends it onto outpatients without infections and into the salivary microbiota(3). Of interest, there remained a non-significant trend towards worse dysbiosis in those ultimately hospitalized with conditions likely related to the microbiota, i.e. HE and infections, adding biological plausibility to this association. Although the exact mechanism is not clear, it is likely that changes in the oral microbiota follow a systemic pro-inflammatory milieu that in turn is associated with worse outcomes. Since stool microbiota is relatively stable over six months, it is likely the enrollment may provide a window as to what may occur subsequently (3). Despite the underlying differences in cirrhosis severity, we were able to define a threshold independent of MELD score and HE status that could predict hospitalizations within 90-days using salivary microbiota. This association with poor prognosis gives these microbiota changes a “real-world” connotation. However it is unlikely that they will replace clinical or laboratory prognosticators at this time, but rather can be developed as potential biomarkers in further validation studies.
Interestingly, the predicted functional analysis showed that the cirrhotics’ saliva was enriched with genes pertaining to endotoxin and endotoxin synthesis proteins, and to nucleic acid and vitamin metabolism. Our results and prior studies have shown that endotoxemia worsens with and is associated with cirrhosis progression, and is assumed to be due to intestinal bacterial overgrowth(1, 3). However, the increased relative abundance of Enterobacteriaceae in saliva of cirrhotics coupled with functions related to endotoxin may suggest a role of oral microbiota towards the overall endotoxemia in cirrhosis. Genes related to phenolic and amino acid metabolism were more common in control saliva compared to cirrhotics. Phenolic compounds are breakdown products of dietary constituents that have putative host beneficial effects(24). Similar to cirrhosis saliva, cirrhotics’ stool microbiota were more likely to be related to nucleic acid and vitamin metabolism. The bacterial contribution to the vitamin metabolism, such as thiamine, riboflavin and glutathione could be important in modulating the intestinal barrier integrity and oxidative stress that is present in cirrhosis(25, 26).
There were interesting differences in correlations between microbiota and Th1 inflammatory cytokines in both biofluids. Cirrhotic salivary Clostridiales Incertae Sedis XIV were negatively correlated with Prevotellaceae, and Enterobacteriaceae was significantly negatively correlated with the anti-inflammatory cytokine IL-10, compared to controls while there was a stronger relationship with systemic inflammation. This indicates that the relatively dysbiotic cirrhotic microbiota was significantly more related to the systemic inflammatory milieu than the otherwise healthy control salivary microbiota. This trend was also replicated in the stool correlation differences in which cirrhotic stool Enterobacteriaceae were negatively linked with the autochthonous taxa and there was a strong linkage within those taxa compared to controls. Interestingly, when saliva correlations were compared to stool correlations within groups, significantly higher correlations were seen with stool microbiota. This points to the changes in gut microbiota being relatively more important that salivary microbiota in determining the overall inflammatory milieu. The relationship between intestinal and oral inflammation has also been explored in inflammatory bowel disease and celiac disease which showed changes that were commensurate with intestinal findings(27, 28). However evaluation of oral microbiota after probiotic supplementation did not lead to changes in the oral ecology(29). This points again to a systemic impact that shapes oral microbiota in these diseases and potentially in cirrhosis.
As expected, we found significant systemic inflammation related to Th1 activation in cirrhosis, especially in prior-HE(30). The cirrhotic group as a whole also exhibited a pro-inflammatory milieu in the saliva with higher salivary IL-1β and IL-6 concentration and a resultant increase in secretory IgA(31). This was accompanied by evidence of impaired innate local defenses with reduced histatins 1 and 5 and lysozyme (32). This extends a study of increased fecal secretory IgA into saliva in cirrhosis and points to an overall activation of systemic inflammation, potentially through contributors in the gut and the oral cavity(33). Interestingly, while there clearly were differences in the systemic inflammatory response in prior-HE compared to no-HE, we did not find similar changes in the salivary inflammatory response between these subgroups. This may point towards a greater contribution of gut dysbiosis towards systemic inflammation compared to the salivary changes. This is not surprising given the quantum difference in the number of bacteria between the two sites. An underlying reason for the increased inflammation could be the reduced histatin 1 and 5 and lyzozymes that promote wound healing and prevent bacterial colonization (34-36). Only histatin 1 and 3 are gene-coded, while histatin 5 is a cleavage product of histatin 3 that has its own antibacterial properties; therefore the similarity in histatin-3 may be due to a reduced cleavage to histatin 5 in cirrhotic patients (35). Lysozyme in particular has been associated with anti-inflammatory effects, particularly related to gram-negative bacteria, which could explain the overabundance of these families in the cirrhotics’ saliva(37, 38). This reduced generation of lysozyme and histatins are likely permissive of the oral cavity dysbiosis that may lead to local and potential systemic inflammation (30, 39).
Our study is limited by the analysis of associations, which do not prove causation or mechanisms. We focused on prior-HE but it is likely that similar dysbiosis in saliva might be present in those with other forms of decompensation, which requires further study. All our prior-HE patients, as per standard of care, were on lactulose and/or rifaximin. However, prior studies have not shown a significant change in bacterial composition after this therapy(40-42). Therefore the changes are likely to be due to underlying disease process. It is interesting that although there were differences between controls and cirrhotics in salivary microbiota composition and inflammatory markers, the relative differences between prior-HE and no-HE patients were not as prominent as they were in the stool. This could be due to the inherent higher bacterial number and the proximity of the gut bacteria to the cirrhotic liver. However this warrants further investigation. The study also excluded patients with periodontitis who may actually have even higher dysbiosis. Despite this exclusion, we were still able to demonstrate significant changes in the microbiota in cirrhotic saliva. We also did not find changes in microbiota related to PPI therapy that replicates our prior cross-sectional analysis(3). We also did not find an appreciable change with diabetes. These findings may be due to background dysbiotic state of the cirrhotic microbiota that diluted any potential impact of diabetes. Given that diet and tobacco can influence the oral microbiota, we carefully controlled for these issues.
We conclude that dysbiosis represented by reduction in autochthonous bacterial abundance and change in bacterial function is also present in saliva in addition to the stool in cirrhotic patients compared to controls. The alteration in bacterial composition in saliva is associated with a higher risk of further hospitalization due to liver-related conditions. This could reflect a global mucosal-immune interface change in cirrhotic patients and represent a target for future microbiota research into the prognostication of cirrhosis.
Supplementary Material
Acknowledgements
The authors would like to acknowledge Dr Swati Dalmet for her help with the sample processing.
Grant Support: This was partly supported by RO1AA020203 from the National Institute on Alcohol Abuse and Alcoholism, by grant RO1DK087913 from the National Institute of Diabetes and Digestive and Kidney Diseases, VA Merit Review Grant CX001076 and by the McGuire Research Institute.
Abbreviations
- HE
hepatic encephalopathy
- PCO
principal component analysis
- QIIME
Quantitative Insights Into Microbial Ecology
- MTPS
multi-tagged pyrosequencing
- PiCRUST
Phylogenetic Investigation of Communities by Reconstruction of Unobserved States
- LDA
linear discriminant analysis
- LEfSe
LDA effect size
Footnotes
Disclosures: none
Author contributions: JSB was involved in all aspects of the study, PMG, NSB, and MS were involved in data analysis and interpretation, MBW, AU, KD and DJK helped with patient recruitment and sample preparation, PMG, DMH, PB, AJS were involved in writing and revising the manuscript.
Prior presentations: Portions of this paper were presented under the title “Salivary Microbiome shows Dysbiosis comparable to Stool Microbiome in Cirrhotic Patients with Hepatic Encephalopathy” at the Clinical Plenary Session at the 2014 Liver Meeting held in Boston.
REFERENCES
- 1.Tandon P, Garcia-Tsao G. Bacterial infections, sepsis, and multiorgan failure in cirrhosis. Semin Liver Dis. 2008;28:26–42. doi: 10.1055/s-2008-1040319. [DOI] [PubMed] [Google Scholar]
- 2.Nava GM, Stappenbeck TS. Diversity of the autochthonous colonic microbiota. Gut Microbes. 2011:2. doi: 10.4161/gmic.2.2.15416. [DOI] [PMC free article] [PubMed] [Google Scholar]
- 3.Bajaj JS, Heuman DM, Hylemon PB, Sanyal AJ, White MB, Monteith P, Noble NA, et al. Altered profile of human gut microbiome is associated with cirrhosis and its complications. J Hepatol. 2014;60:940–947. doi: 10.1016/j.jhep.2013.12.019. [DOI] [PMC free article] [PubMed] [Google Scholar]
- 4.Bajaj JS, Hylemon PB, Ridlon JM, Heuman DM, Daita K, White MB, Monteith P, et al. Colonic mucosal microbiome differs from stool microbiome in cirrhosis and hepatic encephalopathy and is linked to cognition and inflammation. Am J Physiol Gastrointest Liver Physiol. 2012;303:G675–685. doi: 10.1152/ajpgi.00152.2012. [DOI] [PMC free article] [PubMed] [Google Scholar]
- 5.Human Microbiome Project C. Structure, function and diversity of the healthy human microbiome. Nature. 2012;486:207–214. doi: 10.1038/nature11234. [DOI] [PMC free article] [PubMed] [Google Scholar]
- 6.Qin N, Yang F, Li A, Prifti E, Chen Y, Shao L, Guo J, et al. Alterations of the human gut microbiome in liver cirrhosis. Nature. 2014 doi: 10.1038/nature13568. [DOI] [PubMed] [Google Scholar]
- 7.Bajaj JS, Cox IJ, Betrapally NS, Heuman DM, Schubert ML, Ratneswaran M, Hylemon PB, et al. Systems Biology Analysis of Omeprazole Therapy in Cirrhosis Demonstrates Significant Shifts in Gut Microbiota Composition and Function. Am J Physiol Gastrointest Liver Physiol. 2014 doi: 10.1152/ajpgi.00268.2014. [DOI] [PMC free article] [PubMed] [Google Scholar]
- 8.Raghava KV, Shivananda H, Mundinamane D, Boloor V, Thomas B. Evaluation of periodontal status in alcoholic liver cirrhosis patients: a comparative study. J Contemp Dent Pract. 2013;14:179–182. doi: 10.5005/jp-journals-10024-1296. [DOI] [PubMed] [Google Scholar]
- 9.Guggenheimer J, Eghtesad B, Close JM, Shay C, Fung JJ. Dental health status of liver transplant candidates. Liver Transpl. 2007;13:280–286. doi: 10.1002/lt.21038. [DOI] [PubMed] [Google Scholar]
- 10.Nasidze I, Li J, Quinque D, Tang K, Stoneking M. Global diversity in the human salivary microbiome. Genome Res. 2009;19:636–643. doi: 10.1101/gr.084616.108. [DOI] [PMC free article] [PubMed] [Google Scholar]
- 11.Ghannoum MA, Jurevic RJ, Mukherjee PK, Cui F, Sikaroodi M, Naqvi A, Gillevet PM. Characterization of the oral fungal microbiome (mycobiome) in healthy individuals. PLoS Pathog. 2010;6:e1000713. doi: 10.1371/journal.ppat.1000713. [DOI] [PMC free article] [PubMed] [Google Scholar]
- 12.Bajaj JS, Ridlon JM, Hylemon PB, Thacker LR, Heuman DM, Smith S, Sikaroodi M, et al. Linkage of gut microbiome with cognition in hepatic encephalopathy. Am J Physiol Gastrointest Liver Physiol. 2012;302:G168–175. doi: 10.1152/ajpgi.00190.2011. [DOI] [PMC free article] [PubMed] [Google Scholar]
- 13.Gillevet P, Sikaroodi M, Keshavarzian A, Mutlu EA. Quantitative assessment of the human gut microbiome using multitag pyrosequencing. Chem Biodivers. 2010;7:1065–1075. doi: 10.1002/cbdv.200900322. [DOI] [PMC free article] [PubMed] [Google Scholar]
- 14.White JR, Nagarajan N, Pop M. Statistical methods for detecting differentially abundant features in clinical metagenomic samples. PLoS Comput Biol. 2009;5:e1000352. doi: 10.1371/journal.pcbi.1000352. [DOI] [PMC free article] [PubMed] [Google Scholar]
- 15.Langille MG, Zaneveld J, Caporaso JG, McDonald D, Knights D, Reyes JA, Clemente JC, et al. Predictive functional profiling of microbial communities using 16S rRNA marker gene sequences. Nat Biotechnol. 2013;31:814–821. doi: 10.1038/nbt.2676. [DOI] [PMC free article] [PubMed] [Google Scholar]
- 16.Segata N, Izard J, Waldron L, Gevers D, Miropolsky L, Garrett WS, Huttenhower C. Metagenomic biomarker discovery and explanation. Genome Biol. 2011;12:R60. doi: 10.1186/gb-2011-12-6-r60. [DOI] [PMC free article] [PubMed] [Google Scholar]
- 17.Naqvi A, Rangwala H, Keshavarzian A, Gillevet P. Network-based modeling of the human gut microbiome. Chem Biodivers. 2010;7:1040–1050. doi: 10.1002/cbdv.200900324. [DOI] [PMC free article] [PubMed] [Google Scholar]
- 18.Shannon P, Markiel A, Ozier O, Baliga NS, Wang JT, Ramage D, Amin N, et al. Cytoscape: a software environment for integrated models of biomolecular interaction networks. Genome Res. 2003;13:2498–2504. doi: 10.1101/gr.1239303. [DOI] [PMC free article] [PubMed] [Google Scholar]
- 19.Arumugam M, Raes J, Pelletier E, Le Paslier D, Yamada T, Mende DR, Fernandes GR, et al. Enterotypes of the human gut microbiome. Nature. 2011;473:174–180. doi: 10.1038/nature09944. [DOI] [PMC free article] [PubMed] [Google Scholar]
- 20.Tranah TH, Vijay GK, Ryan JM, Shawcross DL. Systemic inflammation and ammonia in hepatic encephalopathy. Metab Brain Dis. 2013;28:1–5. doi: 10.1007/s11011-012-9370-2. [DOI] [PubMed] [Google Scholar]
- 21.Wang QQ, Zhang CF, Chu CH, Zhu XF. Prevalence of Enterococcus faecalis in saliva and filled root canals of teeth associated with apical periodontitis. Int J Oral Sci. 2012;4:19–23. doi: 10.1038/ijos.2012.17. [DOI] [PMC free article] [PubMed] [Google Scholar]
- 22.Vidana R, Sullivan A, Billstrom H, Ahlquist M, Lund B. Enterococcus faecalis infection in root canals - host-derived or exogenous source? Lett Appl Microbiol. 2011;52:109–115. doi: 10.1111/j.1472-765X.2010.02972.x. [DOI] [PubMed] [Google Scholar]
- 23.Kakiyama G, Pandak WM, Gillevet PM, Hylemon PB, Heuman DM, Daita K, Takei H, et al. Modulation of the fecal bile acid profile by gut microbiota in cirrhosis. J Hepatol. 2013;58:949–955. doi: 10.1016/j.jhep.2013.01.003. [DOI] [PMC free article] [PubMed] [Google Scholar]
- 24.Selma MV, Espin JC, Tomas-Barberan FA. Interaction between phenolics and gut microbiota: role in human health. J Agric Food Chem. 2009;57:6485–6501. doi: 10.1021/jf902107d. [DOI] [PubMed] [Google Scholar]
- 25.Bodiga VL, Bodiga S, Surampudi S, Boindala S, Putcha U, Nagalla B, Subramaniam K, et al. Effect of vitamin supplementation on cisplatin-induced intestinal epithelial cell apoptosis in Wistar/NIN rats. Nutrition. 2012;28:572–580. doi: 10.1016/j.nut.2011.09.007. [DOI] [PubMed] [Google Scholar]
- 26.Abhilash PA, Harikrishnan R, Indira M. Ascorbic acid supplementation down-regulates the alcohol induced oxidative stress, hepatic stellate cell activation, cytotoxicity and mRNA levels of selected fibrotic genes in guinea pigs. Free Radic Res. 2012;46:204–213. doi: 10.3109/10715762.2011.647691. [DOI] [PubMed] [Google Scholar]
- 27.Francavilla R, Ercolini D, Piccolo M, Vannini L, Siragusa S, De Filippis F, De Pasquale I, et al. Salivary microbiota and metabolome associated with celiac disease. Appl Environ Microbiol. 2014;80:3416–3425. doi: 10.1128/AEM.00362-14. [DOI] [PMC free article] [PubMed] [Google Scholar]
- 28.Rautava J, Pinnell LJ, Vong L, Akseer N, Assa A, Sherman PM. Oral Microbiome Composition Changes in Mouse Models of Colitis. J Gastroenterol Hepatol. 2014 doi: 10.1111/jgh.12713. [DOI] [PubMed] [Google Scholar]
- 29.Sutula J, Coulthwaite LA, Thomas LV, Verran J. The effect of a commercial probiotic drink containing Lactobacillus casei strain Shirota on oral health in healthy dentate people. Microb Ecol Health Dis. 2013:24. doi: 10.3402/mehd.v24i0.21003. [DOI] [PMC free article] [PubMed] [Google Scholar]
- 30.Albillos A, Lario M, Alvarez-Mon M. Cirrhosis-associated immune dysfunction: Distinctive features and clinical relevance. J Hepatol. 2014;61:1385–1396. doi: 10.1016/j.jhep.2014.08.010. [DOI] [PubMed] [Google Scholar]
- 31.Mantis NJ, Rol N, Corthesy B. Secretory IgA's complex roles in immunity and mucosal homeostasis in the gut. Mucosal Immunol. 2011;4:603–611. doi: 10.1038/mi.2011.41. [DOI] [PMC free article] [PubMed] [Google Scholar]
- 32.Imamura Y, Wang PL. Salivary histatin 3 inhibits heat shock cognate protein 70-mediated inflammatory cytokine production through toll-like receptors in human gingival fibroblasts. J Inflamm (Lond) 2014;11:4. doi: 10.1186/1476-9255-11-4. [DOI] [PMC free article] [PubMed] [Google Scholar]
- 33.Lu H, Wu Z, Xu W, Yang J, Chen Y, Li L. Intestinal microbiota was assessed in cirrhotic patients with hepatitis B virus infection. Intestinal microbiota of HBV cirrhotic patients. Microb Ecol. 2011;61:693–703. doi: 10.1007/s00248-010-9801-8. [DOI] [PubMed] [Google Scholar]
- 34.Fabian TK, Hermann P, Beck A, Fejerdy P, Fabian G. Salivary defense proteins: their network and role in innate and acquired oral immunity. Int J Mol Sci. 2012;13:4295–4320. doi: 10.3390/ijms13044295. [DOI] [PMC free article] [PubMed] [Google Scholar]
- 35.Borgwardt DS, Martin AD, Van Hemert JR, Yang J, Fischer CL, Recker EN, Nair PR, et al. Histatin 5 binds to Porphyromonas gingivalis hemagglutinin B (HagB) and alters HagB-induced chemokine responses. Sci Rep. 2014;4:3904. doi: 10.1038/srep03904. [DOI] [PMC free article] [PubMed] [Google Scholar]
- 36.Oudhoff MJ, Bolscher JG, Nazmi K, Kalay H, van 't Hof W, Amerongen AV, Veerman EC. Histatins are the major wound-closure stimulating factors in human saliva as identified in a cell culture assay. FASEB J. 2008;22:3805–3812. doi: 10.1096/fj.08-112003. [DOI] [PubMed] [Google Scholar]
- 37.Erridge C. Lysozyme promotes the release of Toll-like receptor-2 stimulants from gram-positive but not gram-negative intestinal bacteria. Gut Microbes. 2010;1:383–387. doi: 10.4161/gmic.1.6.13726. [DOI] [PMC free article] [PubMed] [Google Scholar]
- 38.Cooper CA, Garas Klobas LC, Maga EA, Murray JD. Consuming transgenic goats' milk containing the antimicrobial protein lysozyme helps resolve diarrhea in young pigs. PLoS One. 2013;8:e58409. doi: 10.1371/journal.pone.0058409. [DOI] [PMC free article] [PubMed] [Google Scholar]
- 39.Lin CY, Tsai IF, Ho YP, Huang CT, Lin YC, Lin CJ, Tseng SC, et al. Endotoxemia contributes to the immune paralysis in patients with cirrhosis. J Hepatol. 2007;46:816–826. doi: 10.1016/j.jhep.2006.12.018. [DOI] [PubMed] [Google Scholar]
- 40.Vanhoutte T, De Preter V, De Brandt E, Verbeke K, Swings J, Huys G. Molecular monitoring of the fecal microbiota of healthy human subjects during administration of lactulose and Saccharomyces boulardii. Appl Environ Microbiol. 2006;72:5990–5997. doi: 10.1128/AEM.00233-06. [DOI] [PMC free article] [PubMed] [Google Scholar]
- 41.Bajaj JS, Gillevet PM, Patel NR, Ahluwalia V, Ridlon JM, Kettenmann B, Schubert CM, et al. A longitudinal systems biology analysis of lactulose withdrawal in hepatic encephalopathy. Metab Brain Dis. 2012;27:205–215. doi: 10.1007/s11011-012-9303-0. [DOI] [PubMed] [Google Scholar]
- 42.Bajaj JS, Heuman DM, Sanyal AJ, Hylemon PB, Sterling RK, Stravitz RT, Fuchs M, et al. Modulation of the metabiome by rifaximin in patients with cirrhosis and minimal hepatic encephalopathy. PLoS One. 2013;8:e60042. doi: 10.1371/journal.pone.0060042. [DOI] [PMC free article] [PubMed] [Google Scholar]
Associated Data
This section collects any data citations, data availability statements, or supplementary materials included in this article.


