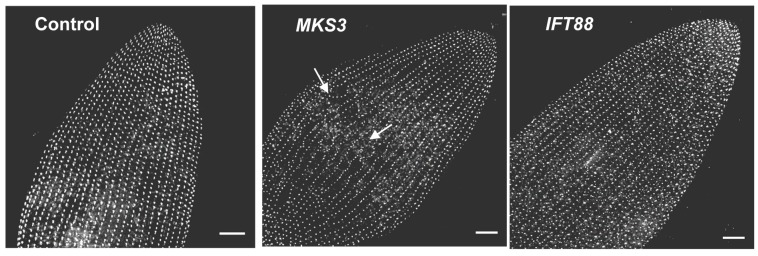
Figure 5.
Cells were stained using anti-centrin to visualize the basal bodies. Images represent stacks of Z sections, approximately 10 µm thick. The images shown are the dorsal surface of the anterior end of the cell. Basal bodies should be arranged in organized rows, as seen in the control and IFT88 depleted cells. These latter cells are controls for the effects of shortened and lost cilia because they are depleted in a protein that is important for the import of proteins into the cilia. The MKS3 depleted cell (center panel) shows the basal bodies not aligned and no longer in straight rows (white arrows) at the midline of the cell. Scale bars: 10 µm. With permission from Cilia [9].

